

Variation characteristics of soybean yield since 1952 and its influencing factors in China
-
摘要: 近几十年来, 我国大豆产需缺口不断扩大, 提升大豆单产水平已成为当前提高大豆总产量的首要可行举措。然而, 影响我国大豆单产的驱动因子及其地域空间差异特征并不明晰。本文通过搜集1952年、1965年、1978年、1990年、2000年、2010年和2017年的全国各省市农业统计年鉴等数据, 从大豆种植的管理措施、自然因素、科技水平、社会因素、经济因素等方面选取与大豆生产密切相关的13个因子, 以大豆单产作为目标变量构建增强回归树模型, 量化各因子的相对重要性及其与大豆单产之间的关系, 分析大豆单产的变异特征, 揭示全国尺度及4个大豆主产区之间的大豆单产驱动力时空分异特征。研究结果表明: 1)各年份的大豆单产变异系数为34.1%~73.2%, 表明全国各地市大豆单产之间存在较大的差异。本研究构建的增强回归树模型可有效解释43.3%的大豆单产变异性, 并可量化揭示各因子与大豆单产之间的非线性关系。2) 1952年以来影响我国大豆单产水平的最重要因素依次为大豆播种面积占农作物总种植面积的百分比(相对重要性为20.9%)、文盲率(18.9%)、每公顷化肥(折纯)施用量(10.7%)。3)不同主产区的大豆单产核心驱动力存在空间差异, 北方春大豆区的最重要因素为每公顷农业机械总动力(13.1%)、文盲率(11.8%), 黄淮海流域夏大豆区的最重要因素为每公顷化肥(折纯)施用量(25.6%)、每公顷农药(折纯)施用量(18.4%), 长江流域春夏大豆区的最重要因素为研发支出占地区生产总值的百分比(21.5%)、有效灌溉面积占农作物播种面积的百分比(14.3%), 南方多熟大豆区的最重要因素为每公顷化肥(折纯)施用量(22.7%)、第一产业占地区生产总值的百分比(13.3%)。4)大豆播种面积占农作物总播种面积的百分比对于全时期、改革开放前、改革开放后3个时期均是影响大豆单产最重要的因子, 改革开放前其他重要的因子包括文盲率和每公顷化肥(折纯)施用量, 改革开放后则包括每公顷农业机械总动力和年均温。总之, 我国各大豆主产区需合理施用化肥和农药, 努力提高机械化水平和农业生产者的知识水平, 本研究结果可为各省市采取有效措施提升大豆单产水平提供科学依据。Abstract: Over the past several decades, the consumers’ demand for soybeans has grown rapidly in China, resulting in a significant increase in the gap between production and demand. Therefore, increasing the total soybean output is of critical importance to ensure food security. Given that it is difficult to increase the total area of cultivated land in China, improving soybean yield per unit area land has become the primary measure for increasing the total soybean output. However, the determinants that directly affect soybean yield, the regional spatial heterogeneity of yield remain unclear. In this study, data from agricultural statistical yearbooks at both the provincial and prefecture levels in China as well as meteorological data (e.g., temperature, precipitation, and sunshine duration) from 1952 to 2017 (comprising 1952, 1965, 1978, 1990, 2000, 2010, and 2017) were collected, whereupon 13 factors closely related to soybean production were selected from the perspective of planting management measures, natural factors, scientific and technogical levels, social factors, and economic factors. Several boosted regression tree models were built to quantify the relative importance of each factor and to determine the mechanism through which it influenced soybean yield; to analyze the variation characteristics of soybean yield; and to reveal the spatiotemporal characteristics of key driving forces across the national scale and among the four major soybean-producing areas (i.e., the northern spring soybean area, the summer soybean area in the Huang-Huai-Hai Basin, the spring and summer soybean area in the Yangtze River Basin, and the southern soybean area) over a long period since 1952. The following results were obtained. 1) The coefficient of variation of soybean yields in different years ranged from 34.1% to 73.2%, indicating that there were substantial differences in yield across the regions in China. The boosted regression tree model could effectively explain 43.3% of the soybean yield variability and quantitatively revealed the nonlinear relationship between each factor and soybean yield in the national scale. 2) The most important factor affecting soybean yield in China since 1952 was the soybean sown area as a percentage of the total crop sown area (relative importance of 20.9%), followed by the illiteracy rate (18.9%) and fertilizer consumption (pure amount) per hectare (10.7%). 3) Spatial differences existed in the dominant driving factors of soybean yield among different main production areas. The main driving factors of the northern spring soybean area were the total power of agricultural machinery per hectare (13.1%) and the illiteracy rate (11.8%); those for the summer soybean area in the Huang-Huai-Hai Basin were the fertilizer consumption (pure amount) per hectare (25.6%) and pesticide consumption (pure amount) per hectare (18.4%); those for the spring and summer soybean area in the Yangtze River Basin were the R&D expenditure as a percentage of regional GDP (21.5%) and the effective irrigation area as a percentage of the crop sown area (14.3%); and those for the southern soybean area were the fertilizer consumption (pure amount) per hectare and the primary industry as a percentage of regional GDP (13.3%). 4) The soybean sown area as a percentage of the total crop sown area was the most important factor that affected soybean yield during 1952–2017, both before and after the reformation and opening up of China. Additionally, the illiteracy rate and fertilizer consumption (pure amount) per hectare were two other important factors for the period before the reformation and opening up of the country, whereas the total power of agricultural machinery per hectare and annual average temperature were important factors afterwards. This study revealed the determinants of soybean yield and its spatiotemporal heterogeneity in China since 1952 and determined the effective measures for improving the yield of this important crop. These findings should be useful for soybean production-related departments at both the provincial and prefecture levels in China for improving the rational usage of fertilizers and pesticides, increasing the level of mechanization, and enhancing the knowledge level of agricultural producers.
-
Key words:
- Soybean /
- Yield /
- Driving factors /
- Boosted regression tree model /
- Spatial heterogeneity
-

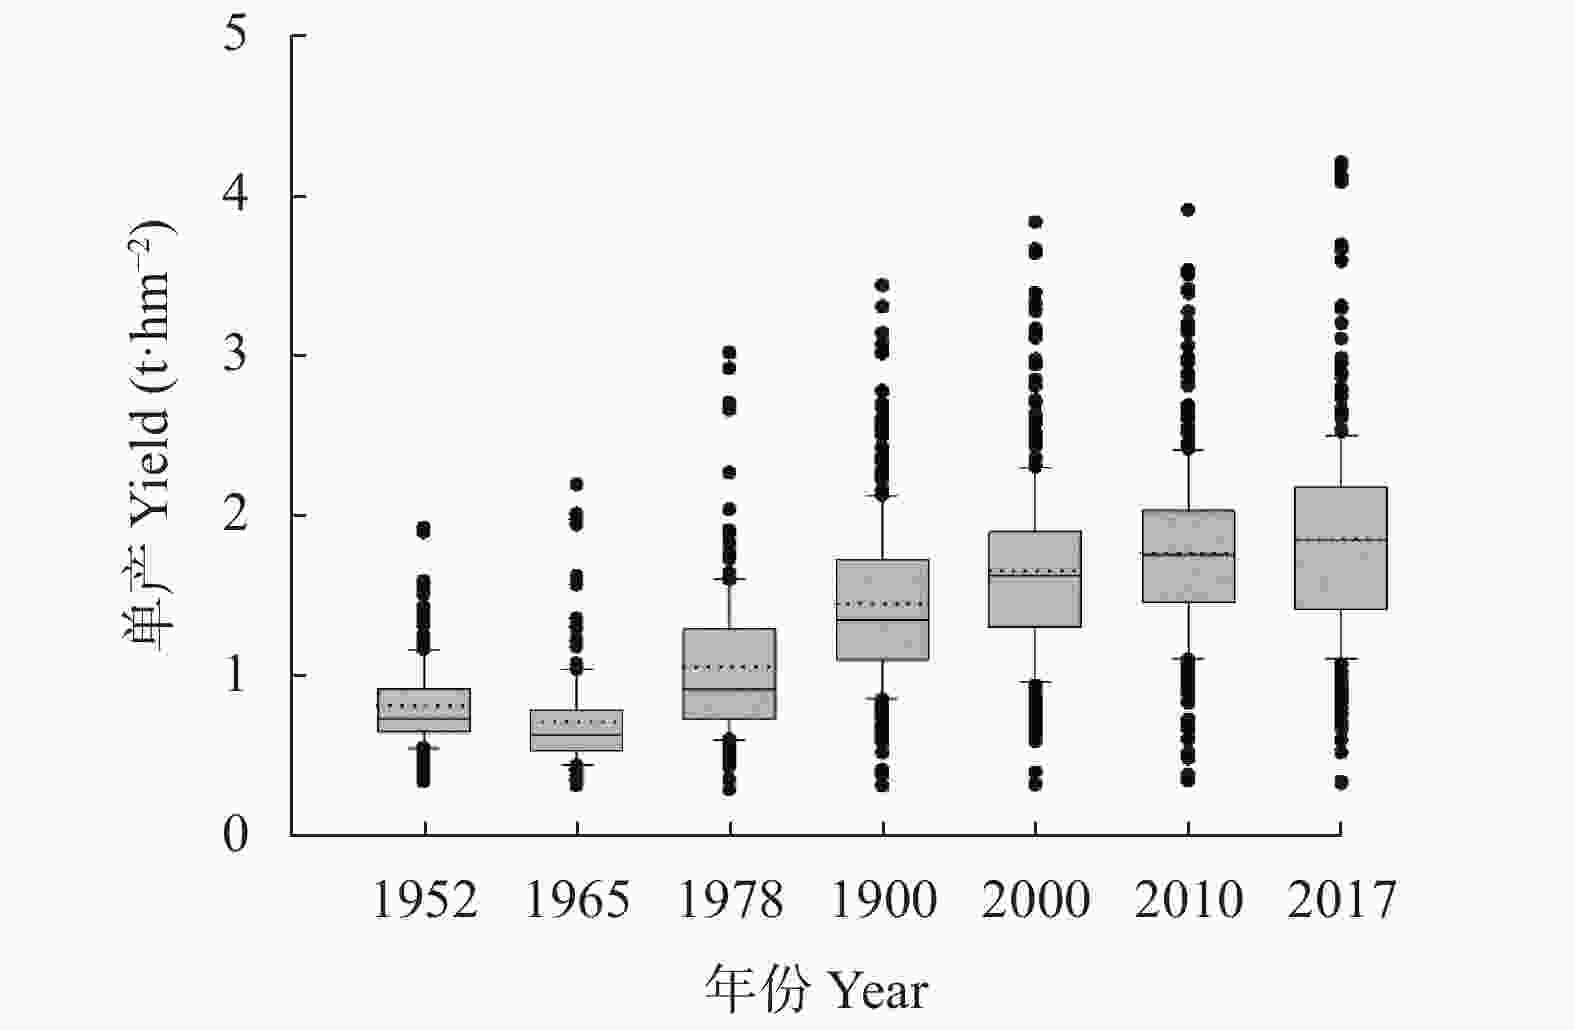
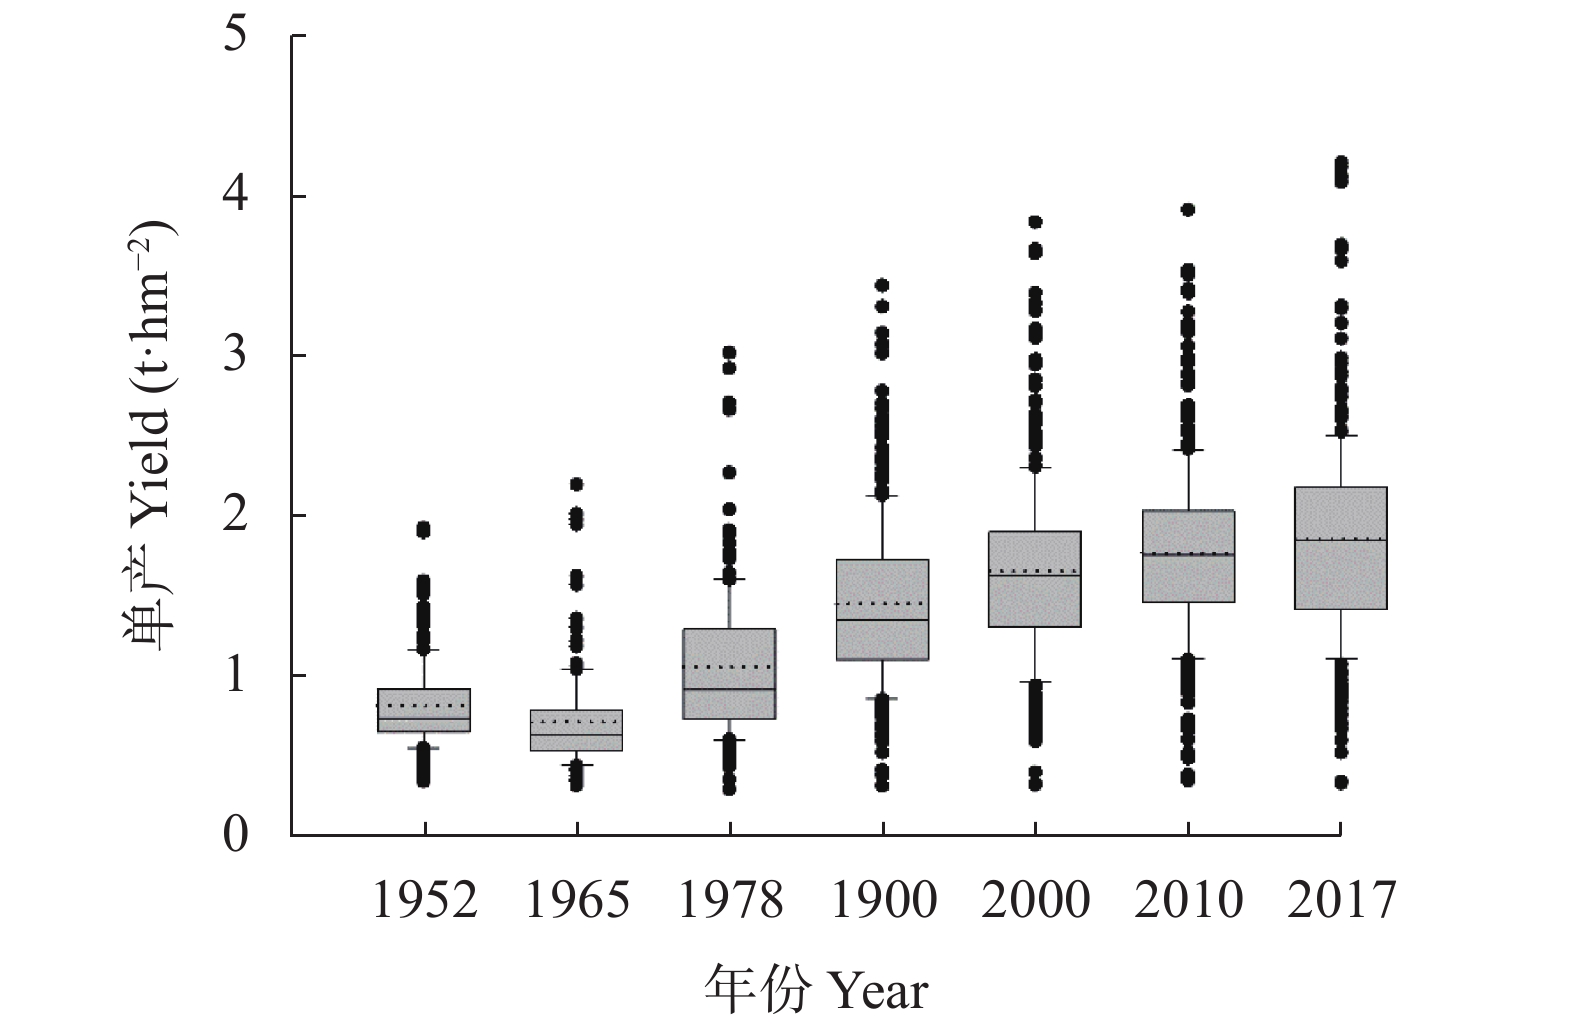
图 1 1952—2017年中国大豆单产的变异特征
箱形图中的虚线表示均值, 实线表示中值, 上边框和下边框分别代表上四分位数和下四分位数, 上边线和下边线代表10%~90%的样本区间, 离散点代表异常值。Dotted lines in boxes represent mean values. Solid lines in boxes represent median values. Boxes show the 25%−75% quartiles. Whisker caps show the 10%–90% percentiles. Discrete points represent outlier values.
Figure 1. Variations of soybean yield in different years from 1952 to 2017 in China
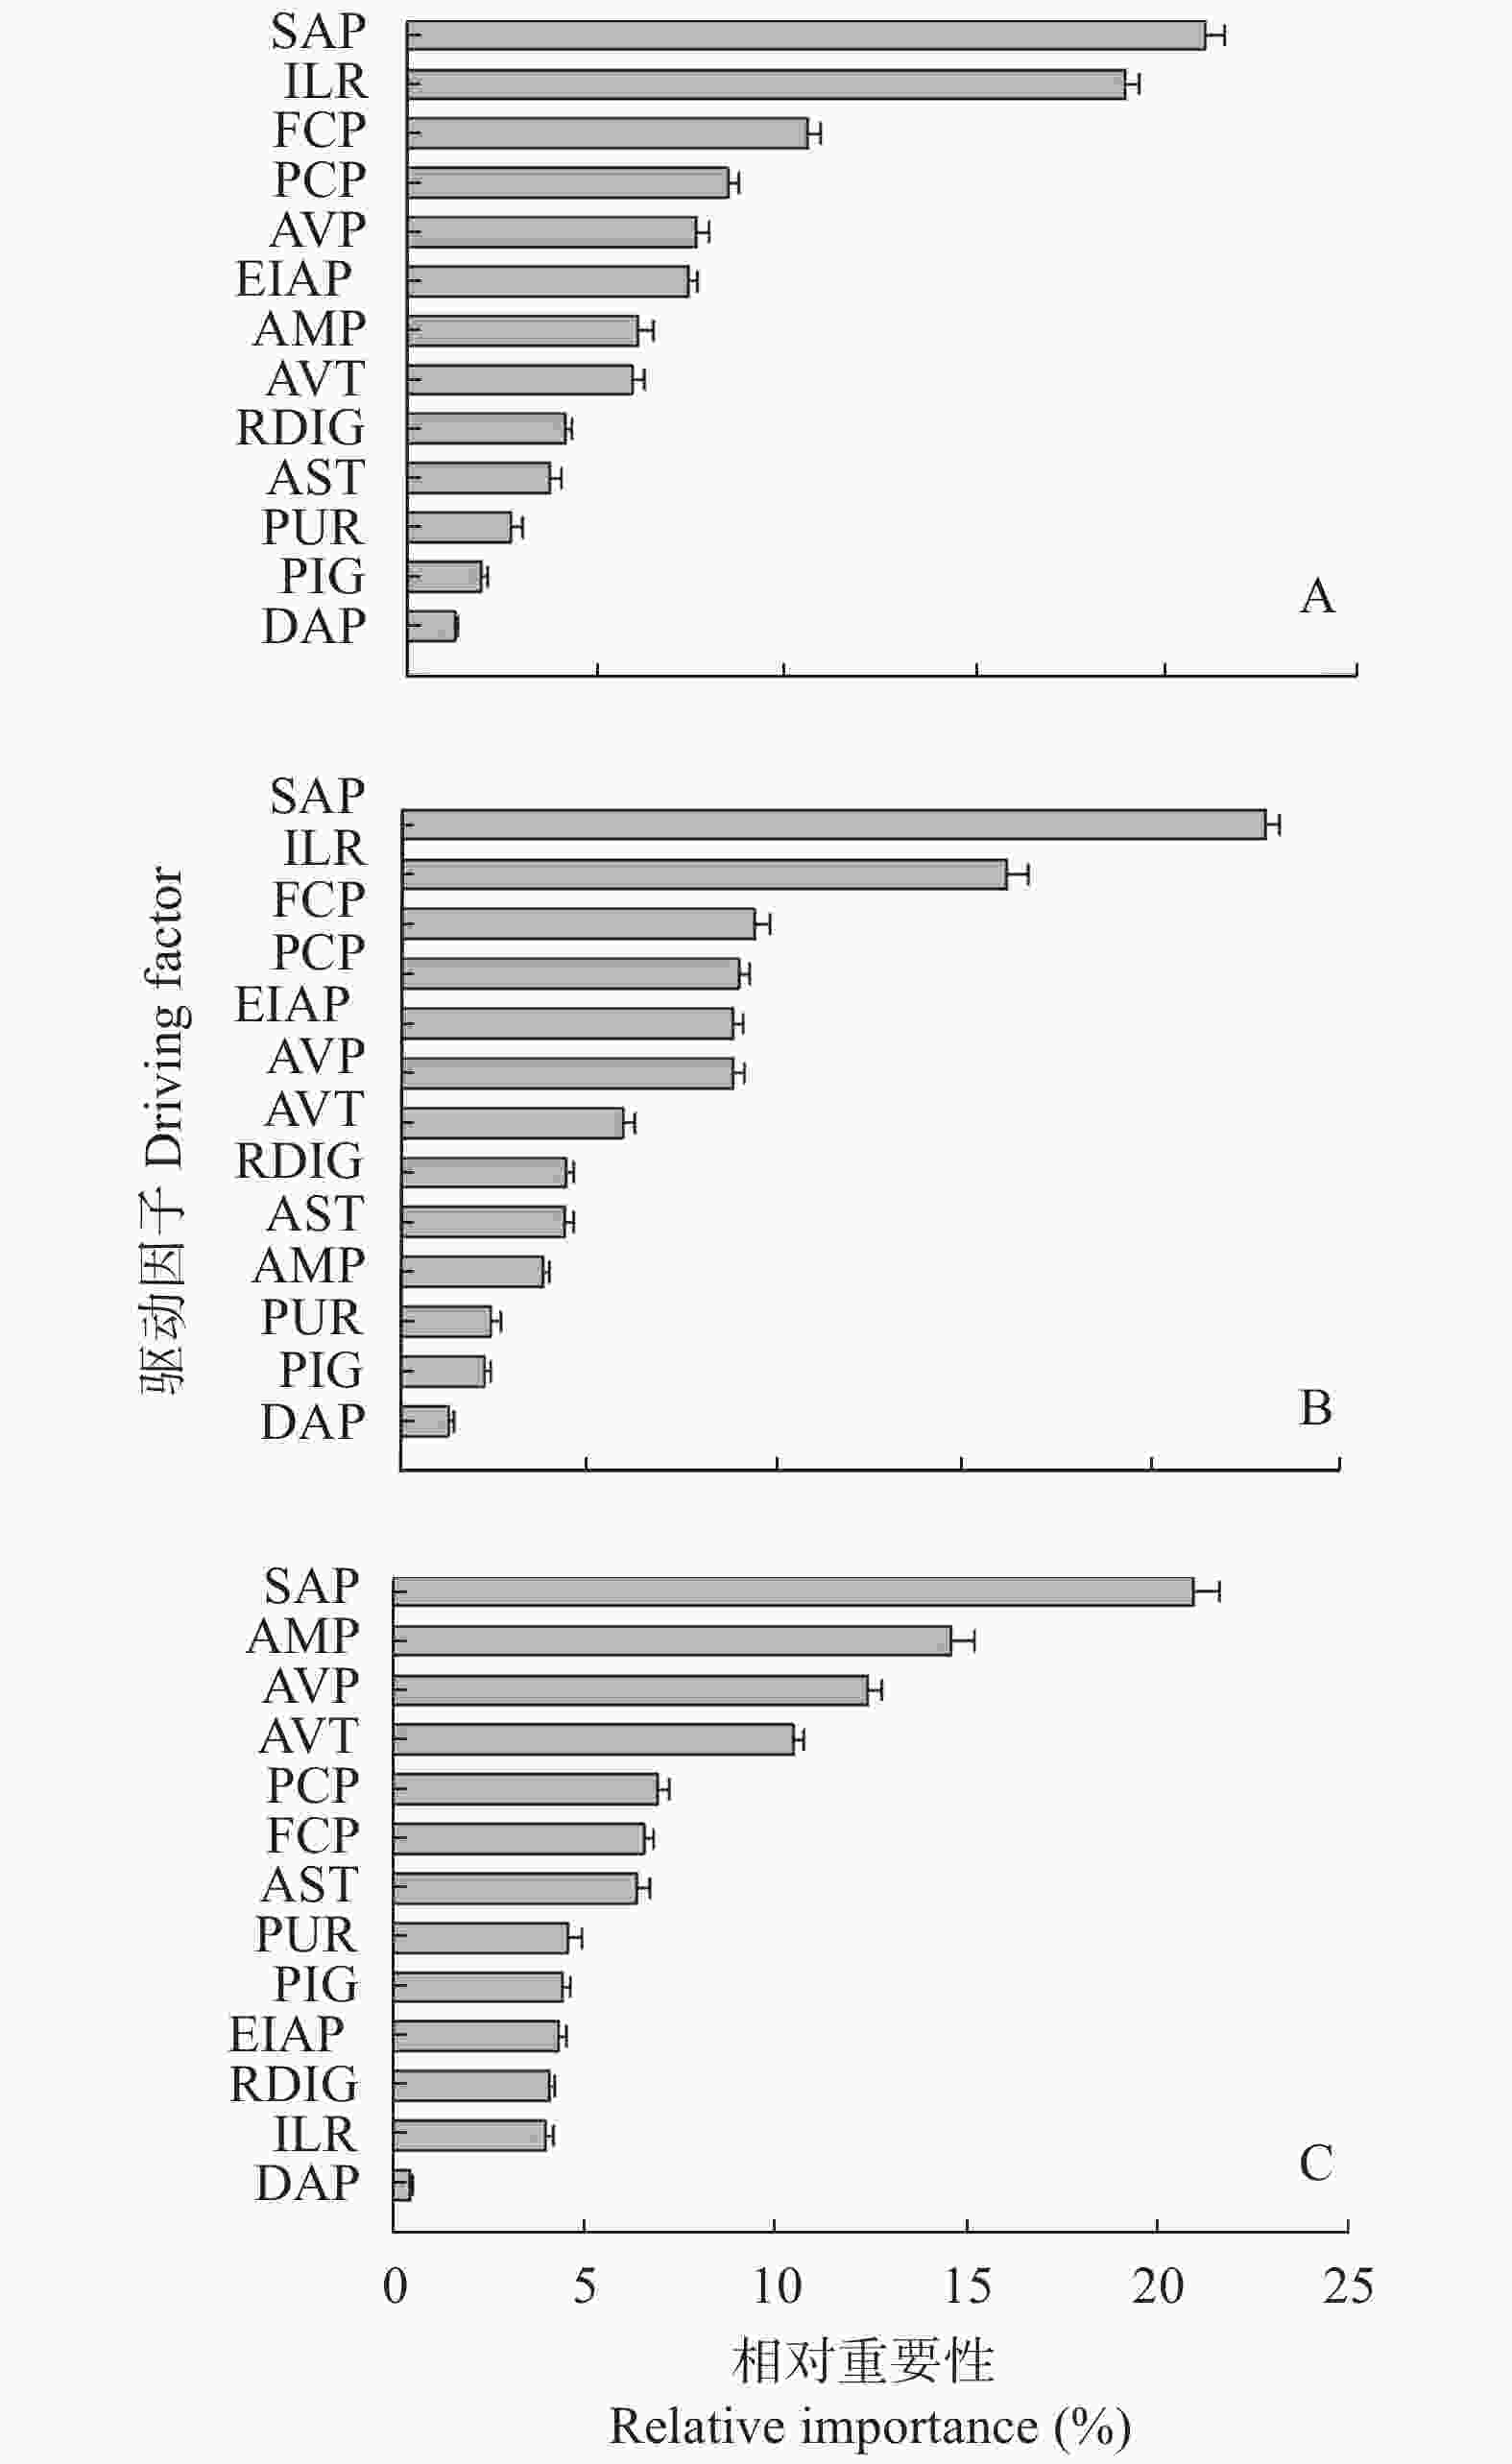
图 2 1952—2017年(A)、改革开放前(1952—1978年, B)和改革开放后(1985—2017年, C)大豆单产各驱动因子的相对重要性(因子简写见表1, 图中误差线表示模型运行50次计算求得的各因子重要性的标准差)
Figure 2. Relative influence of each driving factor on soybean yield during the periods from 1952 to 2017 (A), before the reform and opening up (B, 1952—1978), and after the reform and opening up (C, 1985—2017) (See Table 1 for factors abbreviations, error bars represent standard deviations of the variable importance averaged over 50 model runs)
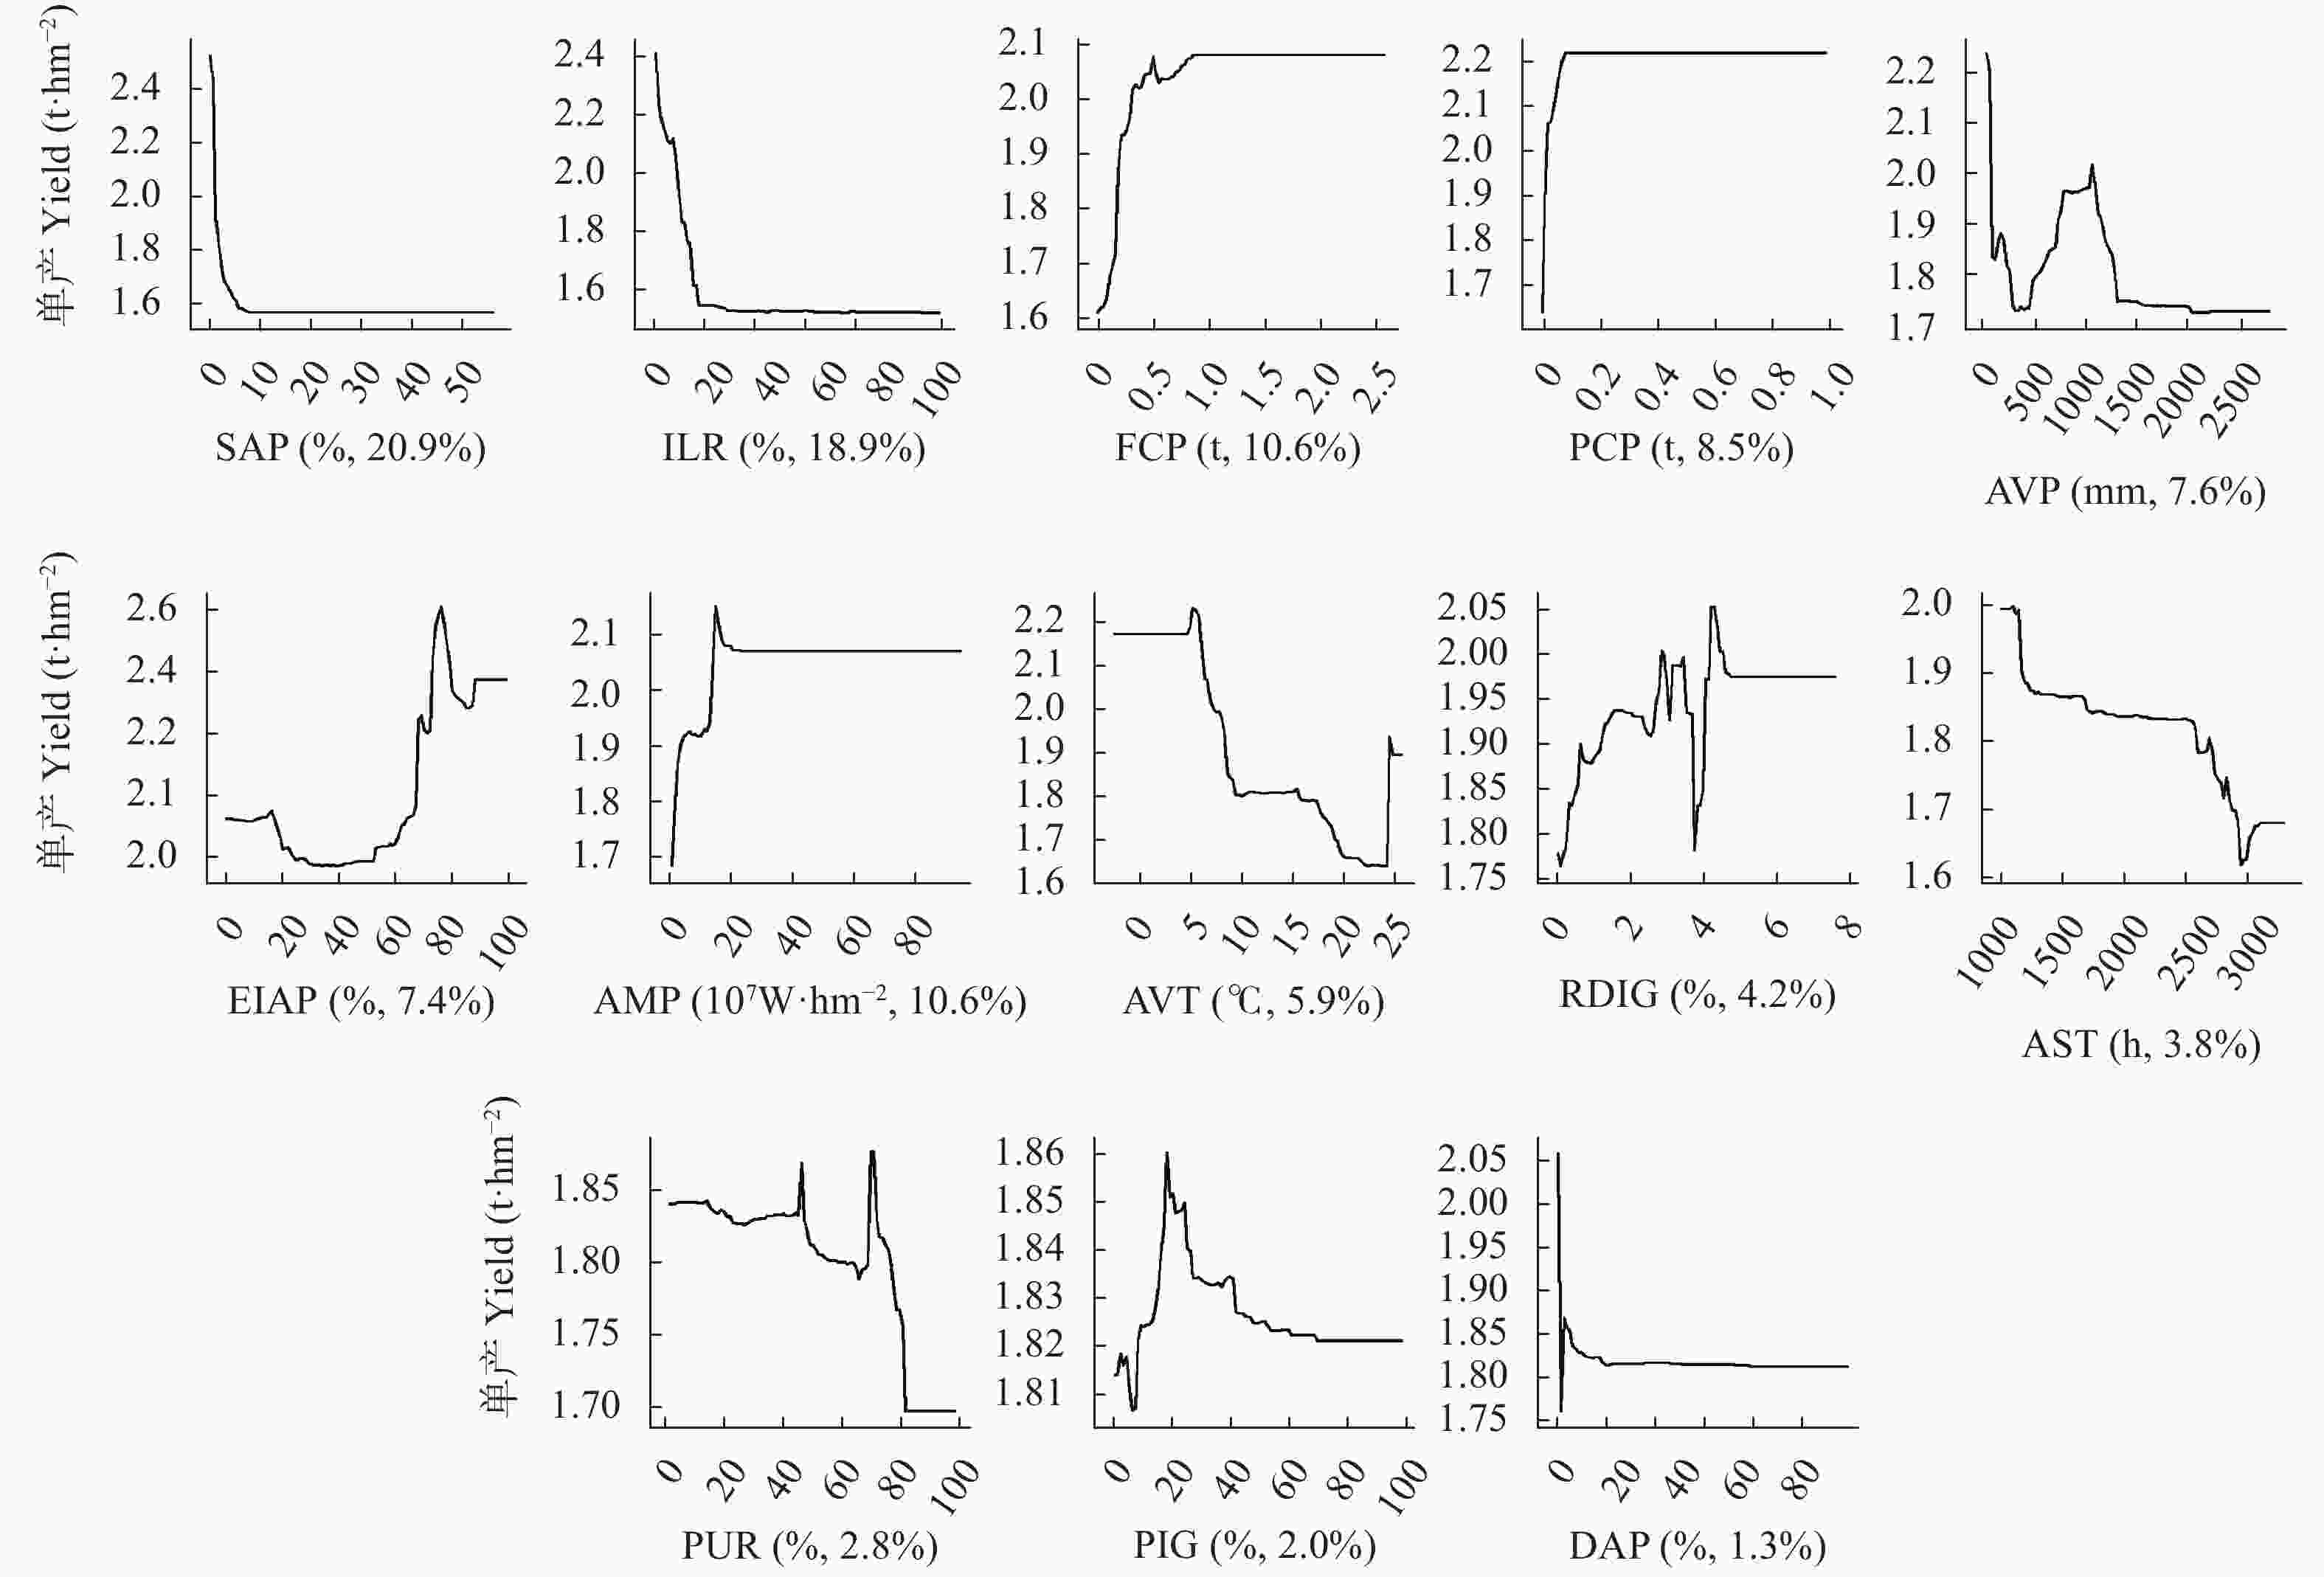
图 3 各驱动因子与大豆单产之间的非线性交互关系(指标全称见表1, 因子名后括号内分别为因子的单位及相对重要性)
Figure 3. Interactive nonlinear relationships between soybean yield and its impact driving factors (See Table 1 for factors abbreviations, the unit and relative importance of each factor were showed in the bracket after factor’s names).
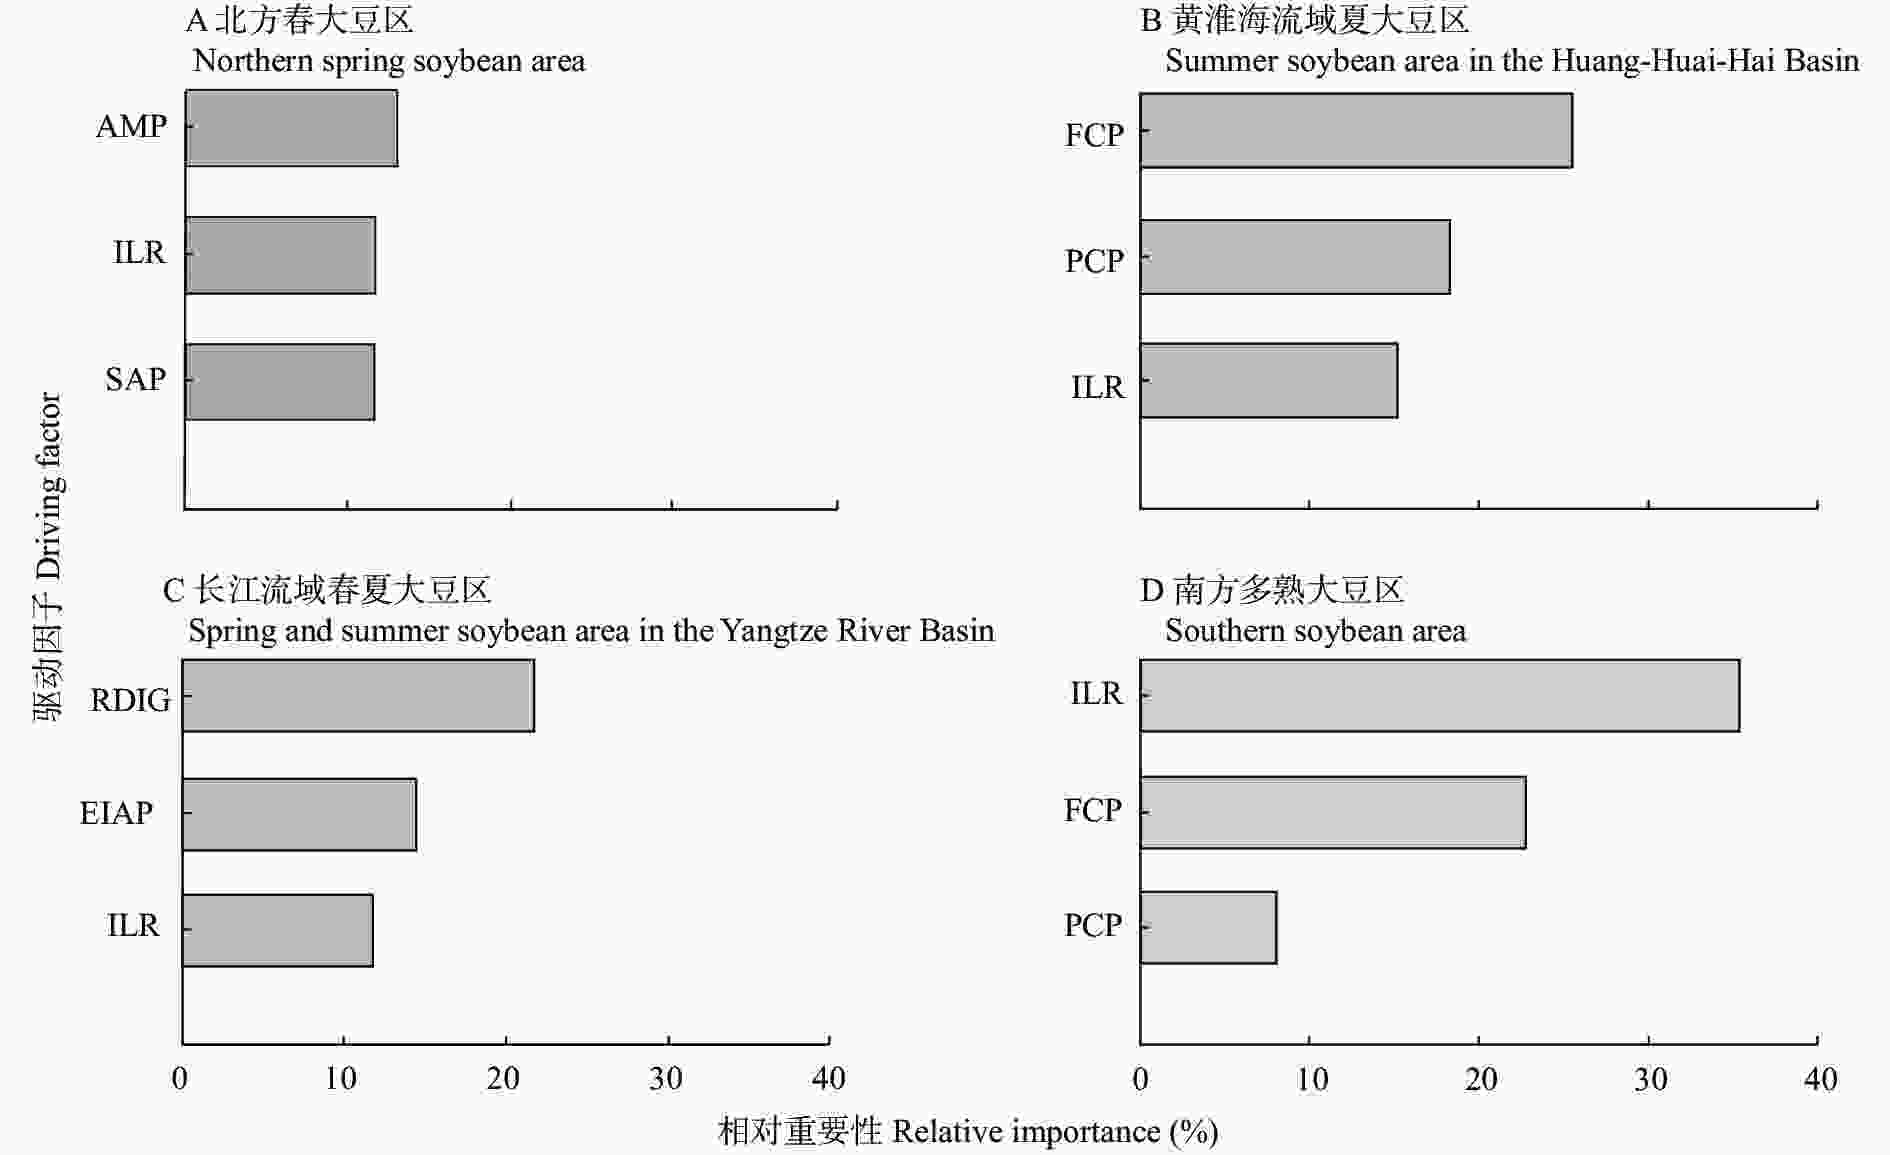
图 4 1952—2017年中国大豆主产区的大豆单产主要驱动因子(指标全称见表1)
Figure 4. Top three determinants of soybean yield in the four major soybean producing areas of China during the period from 1952 to 2017 (See Table 1 for factor abbreviations)
表 1 用于模型构建的大豆单产影响因子
Table 1. Selected influencing factors using for soybean yield modeling
划分依据
Division basis驱动因子
Driving factor简写
Abbreviation单位
Unit说明
Instruction管理措施
Management measures有效灌溉面积占农作物播种面积的百分比
Effective irrigation area as a percentage of crop sown areaEIAP % 指示灌溉水平
Indicates irrigation level大豆播种面积占农作物总种植面积的百分比
Soybean sown area as a percentage of total crop sown areaSAP % 指示大豆的生产规模
Indicates soybean production scale自然因素
Natural factors受灾害面积占农作物总播种面积的百分比
Disaster area as a percentage of total crop sown areaDAP % 指示自然灾害
Indicates natural disasters年平均气温
Annual average temperatureAVT ℃ 指示温度气候因子
Indicates temperature factor年平均日照时间
Annual sunshine durationAST h 指示光照时长气候因子
Indicates illumination duration factor年平均降水量
Annual average precipitationAVP mm 指示降水量气候因子
Indicates precipitation factor科技水平
Scientific and
technological level每公顷农业机械总动力
Total power of agricultural machinery per hectareAMP ×107 W∙hm−2 指示机械化水平
Indicates the level of mechanization每公顷化肥(折纯)施用量
Fertilizer consumption (pure amount) per hectareFCP t∙hm−2 指示重要农业生产资料
Indicates important materials of agricultural production每公顷农药(折纯)施用量
Pesticides consumption (pure amount) per hectarePCP t∙hm−2 指示重要农业生产资料
Indicates important materials of agricultural production研发支出占地区生产总值的百分比
R&D expenditure as percentage of regional GDPRDIG % 指示研发投入
Indicates research and development investment社会因素
Social factors人口城镇化率
Population urbanization ratePUR % 指示地区城镇化水平
Indicates regional urbanization level文盲率
Illiteracy rateILR % 指示地区受教育水平
Indicates regional educational level经济因素
Economic factors第一产业占地区生产总值的百分比
Primary industry as a percentage of regional GDPPIG % 指示农业在本地的经济地位
Indicates the economic status of agriculture in the local area 下载: 导出CSV
表 2 用于大豆单产驱动力分析的增强回归树模型(boosted regression trees, BRT)的性能
Table 2. Performance of boosted regression trees (BRT) models for soybean yield analysis
指标
Index全国
Nationwide北方春大豆区
Northern spring soybean area黄淮海流域夏大豆区
Summer soybean area in the Huang-Huai-Hai Basin长江流域春夏大豆区
Spring and summer soybean area in the Yangtze River Basin南方多熟大豆区
Southern soybean area改革开放前
Before the reform and opening up改革开放后
After the reform and opening upR2 0.433 0.431 0.678 0.586 0.608 0.486 0.494 r 0.639 0.639 0.821 0.753 0.769 0.581 0.614 MAE 0.467 0.467 0.301 0.408 0.350 0.506 0.334 RMSE 0.097 0.101 0.090 0.100 0.075 0.133 0.069
下载: 导出CSV
-
[1] 中华人民共和国国家统计局. 中国统计年鉴[M]. 北京: 中国统计出版社, 2019National Bureau of Statistics of the People’s Republic of China. China Statistical Yearbook[M]. Beijing: China Statistics Press, 2019 [2] 张晓峰, 王宏志, 刘洛, 等. 近50年来气候变化背景下中国大豆生产潜力时空演变特征[J]. 地理科学进展, 2014, 33(10): 1414−1423 doi: 10.11820/dlkxjz.2014.00.013ZHANG X F, WANG H Z, LIU L, et al. Spatial-temporal characteristics of soybean production potential change under the background of climate change over the past 50 years in China[J]. Progress in Geography, 2014, 33(10): 1414−1423 doi: 10.11820/dlkxjz.2014.00.013 [3] MILLER J E, HEAGLE A S, PURSLEY W A. Influence of ozone stress on soybean response to carbon dioxide enrichment: Ⅱ. biomass and development[J]. Crop Science, 1998, 38(1): 122−128 doi: 10.2135/cropsci1998.0011183X003800010021x [4] MORGAN P B, BOLLERO G A, NELSON R L, et al. Smaller than predicted increase in aboveground net primary production and yield of field-grown soybean under fully open-air [CO2] elevation[J]. Global Change Biology, 2005, 11(10): 1856−1865 doi: 10.1111/j.1365-2486.2005.001017.x [5] 郝兴宇, 林而达, 杨锦忠, 等. 自由大气CO2浓度升高对夏大豆生长与产量的影响[J]. 生态学报, 2009, 29(9): 4595−4603 doi: 10.3321/j.issn:1000-0933.2009.09.001HAO X Y, LIN E D, YANG J Z, et al. Effects of free air CO2 enrichment (FACE) on growth and yield of summer soybean[J]. Acta Ecologica Sinica, 2009, 29(9): 4595−4603 doi: 10.3321/j.issn:1000-0933.2009.09.001 [6] 杨峰, 娄莹, 廖敦平, 等. 玉米–大豆带状套作行距配置对作物生物量、根系形态及产量的影响[J]. 作物学报, 2015, 41(4): 642−650 doi: 10.3724/SP.J.1006.2015.00642YANG F, LOU Y, LIAO D P, et al. Effects of row spacing on crop biomass, root morphology and yield in maize–soybean relay strip intercropping system[J]. Acta Agronomica Sinica, 2015, 41(4): 642−650 doi: 10.3724/SP.J.1006.2015.00642 [7] 任媛媛, 王志梁, 王小林, 等. 黄土塬区玉米大豆不同间作方式对产量和经济收益的影响及其机制[J]. 生态学报, 2015, 35(12): 4168−4177REN Y Y, WANG Z L, WANG X L, et al. The effect and mechanism of intercropping pattern on yield and economic benefit on the Loess Plateau[J]. Acta Ecologica Sinica, 2015, 35(12): 4168−4177 [8] 杨文钰, 雍太文, 任万军, 等. 发展套作大豆, 振兴大豆产业[J]. 大豆科学, 2008, 27(1): 1−7YANG W Y, YONG T W, REN W J, et al. Develop relay-planting soybean, revitalize soybean industry[J]. Soybean Science, 2008, 27(1): 1−7 [9] SATARI YUZBASHKANDI S, KHALILIAN S. On projecting climate change impacts on soybean yield in Iran: an econometric approach[J]. Environmental Processes, 2020, 7(1): 73−87 doi: 10.1007/s40710-019-00400-y [10] 解文娟, 杨晓光, 杨婕, 等. 气候变化背景下东北三省大豆干旱时空特征[J]. 生态学报, 2014, 34(21): 6232−6243XIE W J, YANG X G, YANG J, et al. Spatio-temporal characteristics of drought for soybean under climate change in the three provinces of Northeast China[J]. Acta Ecologica Sinica, 2014, 34(21): 6232−6243 [11] 郝兴宇, 韩雪, 居煇, 等. 气候变化对大豆影响的研究进展[J]. 应用生态学报, 2010, 21(10): 2697−2706HAO X Y, HAN X, JU H, et al. Impact of climatic change on soybean production: a review[J]. Chinese Journal of Applied Ecology, 2010, 21(10): 2697−2706 [12] 乔金友, 姜岩, 王博, 等. 我国大豆主产区农业机械化现状及发展策略研究[J]. 农机化研究, 2017, 39(4): 1−6 doi: 10.3969/j.issn.1003-188X.2017.04.001QIAO J Y, JIANG Y, WANG B, et al. Research on current status and developing strategy of agricultural mechanization of soybean main production area in China[J]. Journal of Agricultural Mechanization Research, 2017, 39(4): 1−6 doi: 10.3969/j.issn.1003-188X.2017.04.001 [13] 车升国. 区域作物专用复合(混)肥料配方制定方法与应用[D]. 北京: 中国农业大学, 2015CHE S G. Design method and application of formula of regional crop-based compound fertilizer[D]. Beijing: China Agricultural University, 2015 [14] 李秀芬, 郭昭滨, 朱海霞, 等. 黑龙江省大豆生长季旱涝时序特征及其对产量的影响[J]. 应用生态学报, 2020, 31(4): 1223−1232LI X F, GUO Z B, ZHU H X, et al. Time-series characteristics of drought and flood in spring soybean growing season and its effect on soybean yield in Heilongjiang Province, China[J]. Chinese Journal of Applied Ecology, 2020, 31(4): 1223−1232 [15] 宫丽娟, 李秀芬, 田宝星, 等. 黑龙江省大豆不同生育阶段干旱时空特征[J]. 应用气象学报, 2020, 31(1): 95−104 doi: 10.11898/1001-7313.20200109GONG L J, LI X F, TIAN B X, et al. Spatio-temporal characteristics of drought in different growth stages of soybean in Heilongjiang[J]. Journal of Applied Meteorological Science, 2020, 31(1): 95−104 doi: 10.11898/1001-7313.20200109 [16] 苏营, 张逸飞, 牟文雅, 等. 大豆主要株型和产量指标对大气CO2和温度升高的响应[J]. 生态学报, 2016, 36(9): 2597−2606SU Y, ZHANG Y F, MOU W Y, et al. Morphological traits and yield of soybean under elevated atmospheric CO2 concentration and temperature[J]. Acta Ecologica Sinica, 2016, 36(9): 2597−2606 [17] 张伟明, 管学超, 黄玉威, 等. 生物炭与化学肥料互作的大豆生物学效应[J]. 作物学报, 2015, 41(1): 109−122 doi: 10.3724/SP.J.1006.2015.00109ZHANG W M, GUAN X C, HUANG Y W, et al. Biological effects of biochar and fertilizer interaction in soybean plant[J]. Acta Agronomica Sinica, 2015, 41(1): 109−122 doi: 10.3724/SP.J.1006.2015.00109 [18] 王玎. 山东省城镇化对粮食生产的影响机制研究[D]. 济南: 山东大学, 2014WANG D. Mechanism of impact of urbanization on food production in Shandong Province[D]. Jinan: Shandong University, 2014 [19] 杨志海, 王雅鹏. 城镇化影响了粮食安全吗?−来自1462个县(市)面板数据的实证检验[J]. 城市发展研究, 2012, 19(10): 1−5 doi: 10.3969/j.issn.1006-3862.2012.10.001YANG Z H, WANG Y P. Does urbanization influence food safety? Empirical test based on the panel data of 1462 counties (cities)[J]. Urban Development Studies, 2012, 19(10): 1−5 doi: 10.3969/j.issn.1006-3862.2012.10.001 [20] 杨树果. 产业链视角下的中国大豆产业经济研究[D]. 北京: 中国农业大学, 2014YANG S G. Economics of soybean industry in China from industry chain perspective[D]. Beijing: China Agricultural University, 2014 [21] 李春林, 刘淼, 胡远满, 等. 基于增强回归树和Logistic回归的城市扩展驱动力分析[J]. 生态学报, 2014, 34(3): 727−737LI C L, LIU M, HU Y M, et al. Driving forces analysis of urban expansion based on boosted regression trees and Logistic regression[J]. Acta Ecologica Sinica, 2014, 34(3): 727−737 [22] ELITH J, LEATHWICK J R, HASTIE T. A working guide to boosted regression trees[J]. Journal of Animal Ecology, 2008, 77(4): 802−813 doi: 10.1111/j.1365-2656.2008.01390.x [23] PRASAD A M, IVERSON L R, LIAW A. Newer classification and regression tree techniques: bagging and random forests for ecological prediction[J]. Ecosystems, 2006, 9(2): 181−199 doi: 10.1007/s10021-005-0054-1 [24] 蔡文华, 杨健, 刘志华, 等. 黑龙江省大兴安岭林区火烧迹地森林更新及其影响因子[J]. 生态学报, 2012, 32(11): 3303−3312 doi: 10.5846/stxb201105030574CAI W H, YANG J, LIU Z H, et al. Controls of post-fire tree recruitment in Great Xing’ an Mountains in Heilongjiang Province[J]. Acta Ecologica Sinica, 2012, 32(11): 3303−3312 doi: 10.5846/stxb201105030574 [25] 周济. 大力办好农村教育事业[J]. 中小学校长, 2008(12): 4–7ZHOU J. We will do a good job in rural education[J]. China’s Rural Education, 2008(12): 4–7 [26] 李立军. 中国耕作制度近50年演变规律及未来20年发展趋势研究[D]. 北京: 中国农业大学, 2004LI L J. Involving regularities in recent 50 years and future trends in 2020 on farming system in China[D]. Beijing: China Agricultural University, 2004 [27] LIOUBIMTSEVA E, HENEBRY G M. Grain production trends in Russia, Ukraine and Kazakhstan: New opportunities in an increasingly unstable world?[J]. Frontiers of Earth Science, 2012, 6(2): 157−166 doi: 10.1007/s11707-012-0318-y [28] PRISHCHEPOV A V, PONKINA E, SUN Z L, et al. Revealing the determinants of wheat yields in the Siberian breadbasket of Russia with Bayesian networks[J]. Land Use Policy, 2019, 80: 21−31 doi: 10.1016/j.landusepol.2018.09.038 [29] 王济民. 我国的大豆经济: 供给与需求的重点分析[D]. 北京: 中国农业科学院, 2000WANG J M. Soybean economy in China: with focus on supply and demand[D]. Beijing: Chinese Academy of Agricultural Sciences, 2000 [30] 王畅, 赵海东, 冯乃杰, 等. 两个生态区大豆光热资源利用率和产量的差异及对化控剂的响应[J]. 应用生态学报, 2018, 29(11): 3615−3624WANG C, ZHAO H D, FENG N J, et al. Differences in light and heat utilization efficiency and yield of soybean in two ecological zones and their response to chemical control regulators[J]. Chinese Journal of Applied Ecology, 2018, 29(11): 3615−3624 [31] 程叶青, 张平宇. 东北商品粮基地粮食生产的区域分异[J]. 自然资源学报, 2005, 20(6): 925−931 doi: 10.3321/j.issn:1000-3037.2005.06.018CHENG Y Q, ZHANG P Y. Regional differentiation of grain production of commodity grain bases in the northeast China[J]. Journal of Natural Resources, 2005, 20(6): 925−931 doi: 10.3321/j.issn:1000-3037.2005.06.018 [32] 成雪峰, 张凤云. 黄淮海夏大豆生产现状及发展对策[J]. 大豆科学, 2010, 29(1): 157−160CHENG X F, ZHANG F Y. Present conditions and countermeasures of soybean production in Huang-Huai-Hai regions[J]. Soybean Science, 2010, 29(1): 157−160 [33] 蒋慕东. 二十世纪中国大豆改良、生产与利用研究[D]. 南京: 南京农业大学, 2006JIANG M D. Study on improvement, production and utilization of soybean in China during the 20th Century[D]. Nanjing: Nanjing Agricultural University, 2006 -

 下载:
下载:


 点击查看大图

计量
- 文章访问数: 349
- HTML全文浏览量: 102
- PDF下载量: 64
- 被引次数: 0
