

Estimation method of daily global radiation under different sunshine conditions: A case study of Jiangsu Province
-
摘要: 太阳辐射是影响农田生态系统碳交换和能量收支等的关键因子。为了准确估算不同日照情况下的太阳日辐射量, 更好地开展农田生态系统的相关研究, 本文以江苏省为例, 利用淮安、吕泗和南京3个辐射观测站2005—2020年逐日气象资料和辐射资料, 以逐日日照时数是否为0, 将研究样本划分为无日照和有日照两类, 梳理了可观测得到的24个气象因子、3个地理因子, 通过相关分析确定了不同日照情况下太阳日辐射的高度相关因子; 选取3个站2005—2016年奇数年份的逐日资料样本作为建模集, 采用基于最小二乘法的逐步回归方式, 分别以太阳日辐射(GR)和日大气透明系数(太阳日辐射与天空辐射的比值, GR/SR)作为因变量建立了不同日照情况下的太阳日辐射估算模型; 选取3个站2005—2016年偶数年份的逐日资料样本为组间验证集、2017—2020年的逐日资料样本为组外验证集。通过比较模型的拟合效果及其对建模集、组间验证集和组外验证集太阳日辐射的估算效果, 最终确定太阳日辐射估算的最佳模型。结果表明: 1)无论是在无日照情况还是有日照情况下, 太阳日辐射都与各气象因子普遍呈现极显著相关(P<0.01)。其中在有日照情况下, 太阳日辐射与日照因子呈最强的相关性, 而在无日照情况下, 太阳日辐射与日最高地表温度表现出最强的相关性, 两者之间的相关系数高于其他气温类因子。2)无日照情况下应选择以太阳日辐射为因变量、以日最高地表温度和日露点温度为自变量的估算模型, 模型的决定系数R2为0.650, 对太阳日辐射的估算准确度接近75%; 在有日照情况下选择以日大气透明系数为因变量、以日日照百分率和日日照时数为自变量集的估算模型, 模型的决定系数R2可达0.769, 对太阳日辐射的估算准确度平均为87.60%。基于该分段估算模型, 江苏地区不同日照情况下的太阳日辐射估算准确度平均可达84.71%, 异常点占比为2.04%。引入准确的太阳辐射量将利于更好地开展作物生长和产量模拟、土壤水分蒸散估算等研究, 最终为农田生态系统的相关研究提供基础。Abstract: Global radiation is a key factor affecting carbon exchange and the surface energy budget of agroecosystems. To accurately estimate the daily global radiation (GR) under different sunshine conditions and to improve the research carried out on agroecosystems, this study used daily meteorological and radiation data collected between 2005 and 2020 at three radiation observation stations in Jiangsu Province, namely Huai’an, Lüsi, and Nanjing, to divide the research samples into two categories, namely with and without sunshine, according to whether the number of hours of sunshine per day was zero. In total, 24 observable meteorological factors and 3 geographical factors were identified, with the main factors influencing GR under different sunshine conditions being determined using correlation analysis. Daily data from the three stations collected during odd-numbered years between 2005 and 2016 were selected as the modeling dataset, and the least-squares stepwise regression method was adopted to establish the GR estimation models for conditions with and without sunshine, with GR and the daily atmospheric transparency coefficient (ratio of GR to sky radiation [SR], GR/SR) representing the dependent variables. Daily data samples from the three stations collected during even-numbered years between 2005 and 2016 were selected as the between-group verification set, while daily data samples collected from 2017 to 2020 were selected as outside-group verification sets. The optimal GR estimation model for Jiangsu Province was determined by comparing the model fits and the estimation effects of the original models with the between-group and the outside-group verification sets. The results showed that first, GR was significantly correlated with most of the meteorological factors (P<0.01) regardless of the presence of sunshine. GR under sunshine conditions had the strongest correlation with sunshine factors, while GR under without sunshine condition had the strongest correlation with the daily maximum ground temperature (TGMax). Furthermore, the correlation coefficient between GR and TGMax was higher than the correlation between GR and other temperature factors. Second, the estimation model with GR as the dependent variable and TGMax and daily dew point temperature as the independent variables was selected when the daily sunshine duration was zero; the coefficient of determination (R2) of this model was 0.650, and the estimation accuracy of GR was close to 75%. The estimation model with GR/SR as the dependent variable and daily percentage of sunshine and sunshine duration as the independent variables was selected when the daily sunshine duration was greater than zero; the R2 of this model reached 0.769 and the average estimation accuracy of GR was 87.60%. On the basis of subsection of estimation models, the average accuracy of GR under different sunshine conditions in Jiangsu reached 84.71%, and the proportion of outliers in the total sample was 2.04%. The introduction of accurate GR estimation is greatly beneficial to carry out research on crop growth and yield simulation and soil moisture estimation, and ultimately provide a basis for related research on agroecosystems.
-
Key words:
- Daily global radiation /
- Sunshine hours /
- Stepwise regression /
- Sunshine condition /
- Estimation method
-

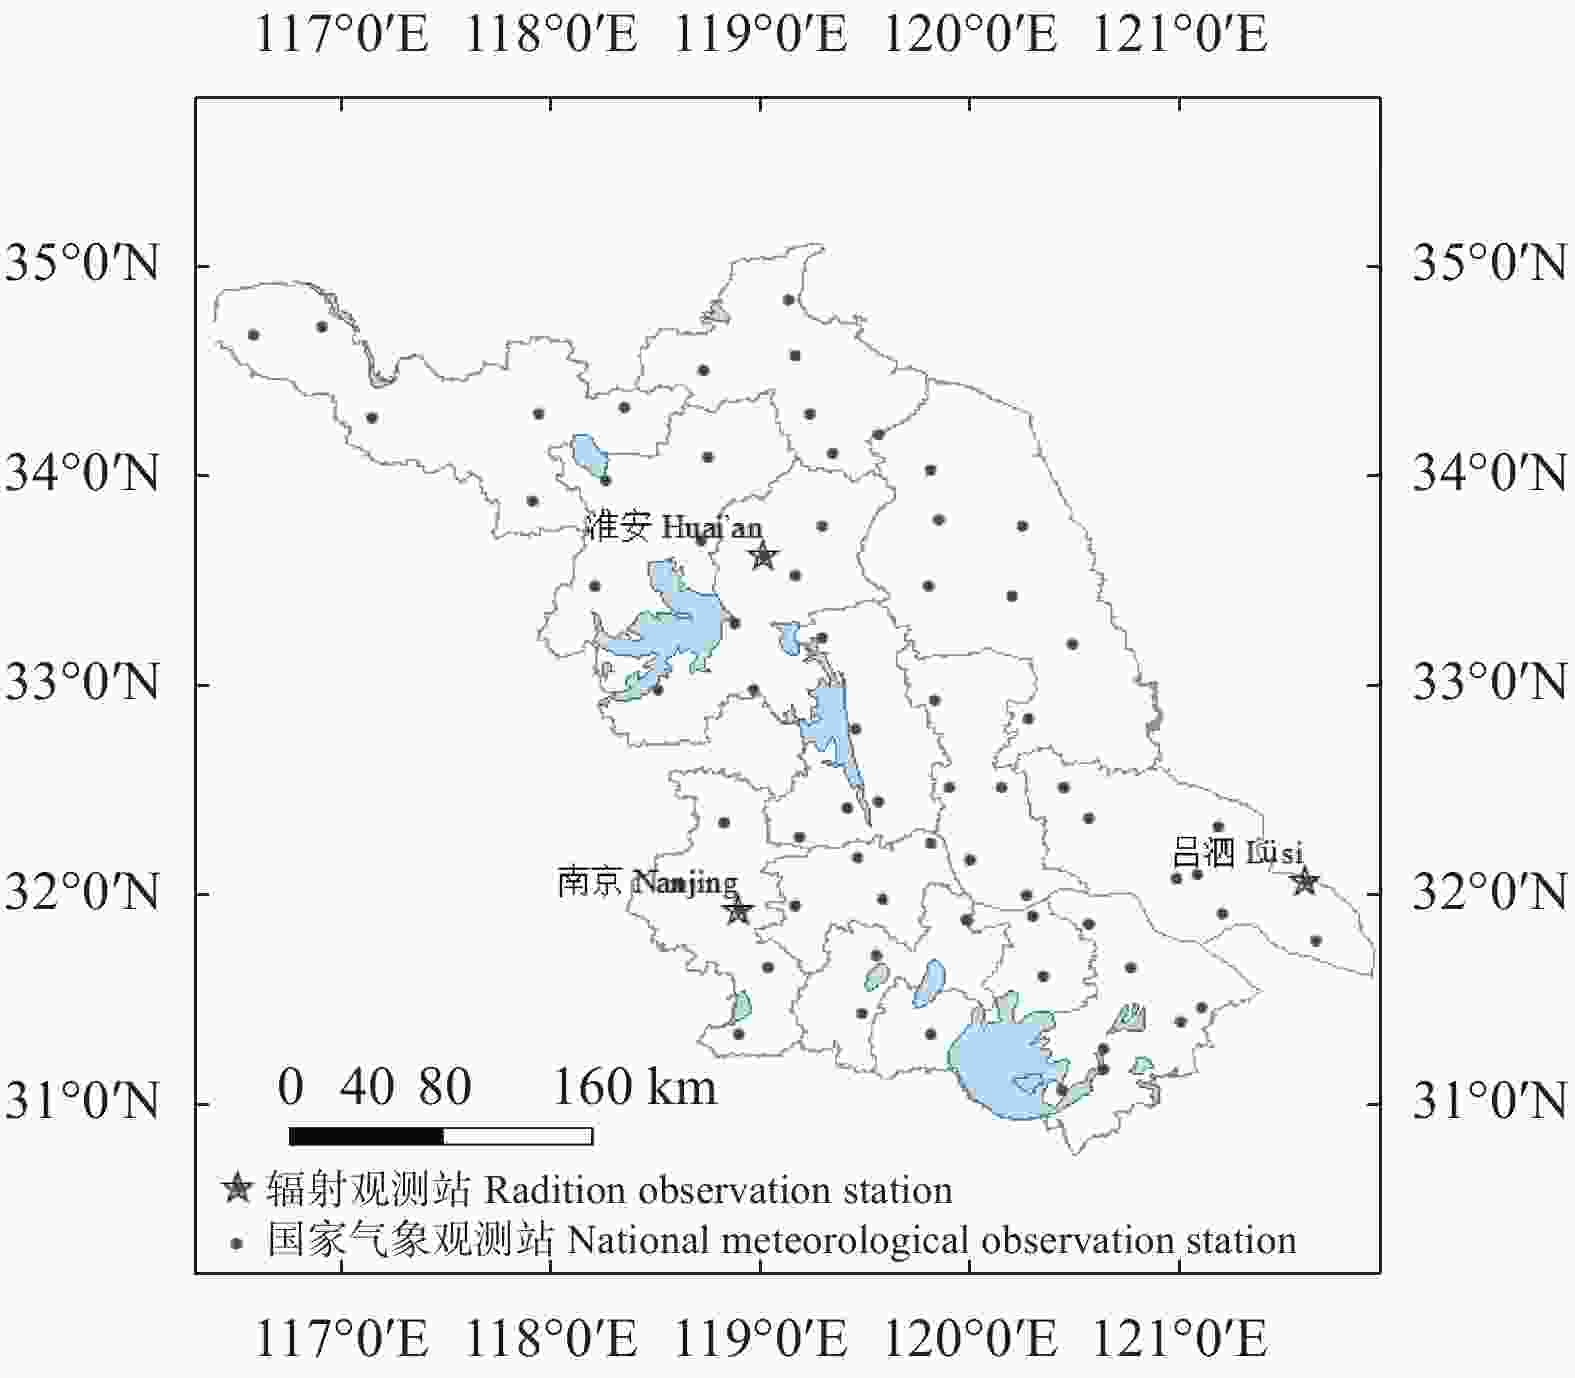
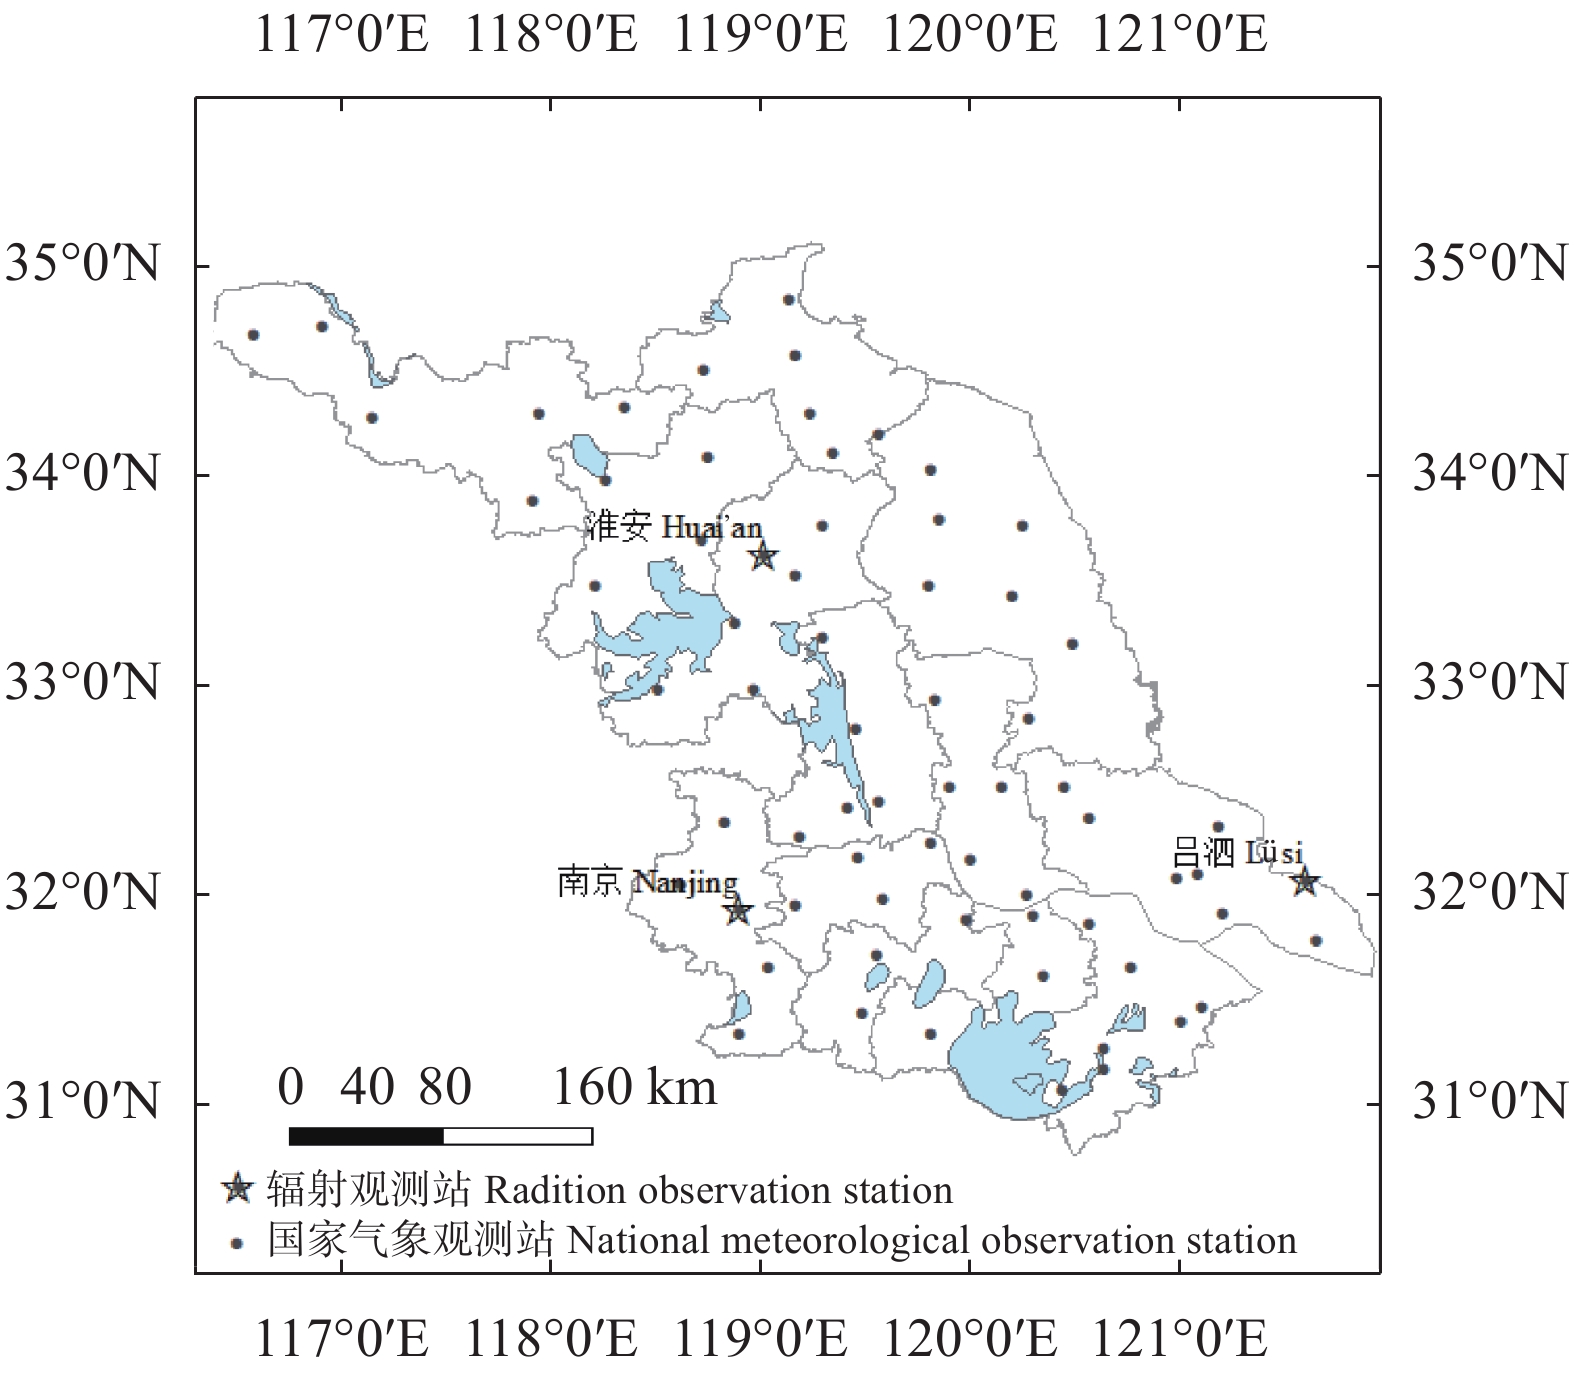
图 1 江苏省3个辐射观测站和69个国家气象观测站空间分布
Figure 1. Spatial distribution of 3 radiation observation stations and 69 national meteorological observation stations in Jiangsu Province
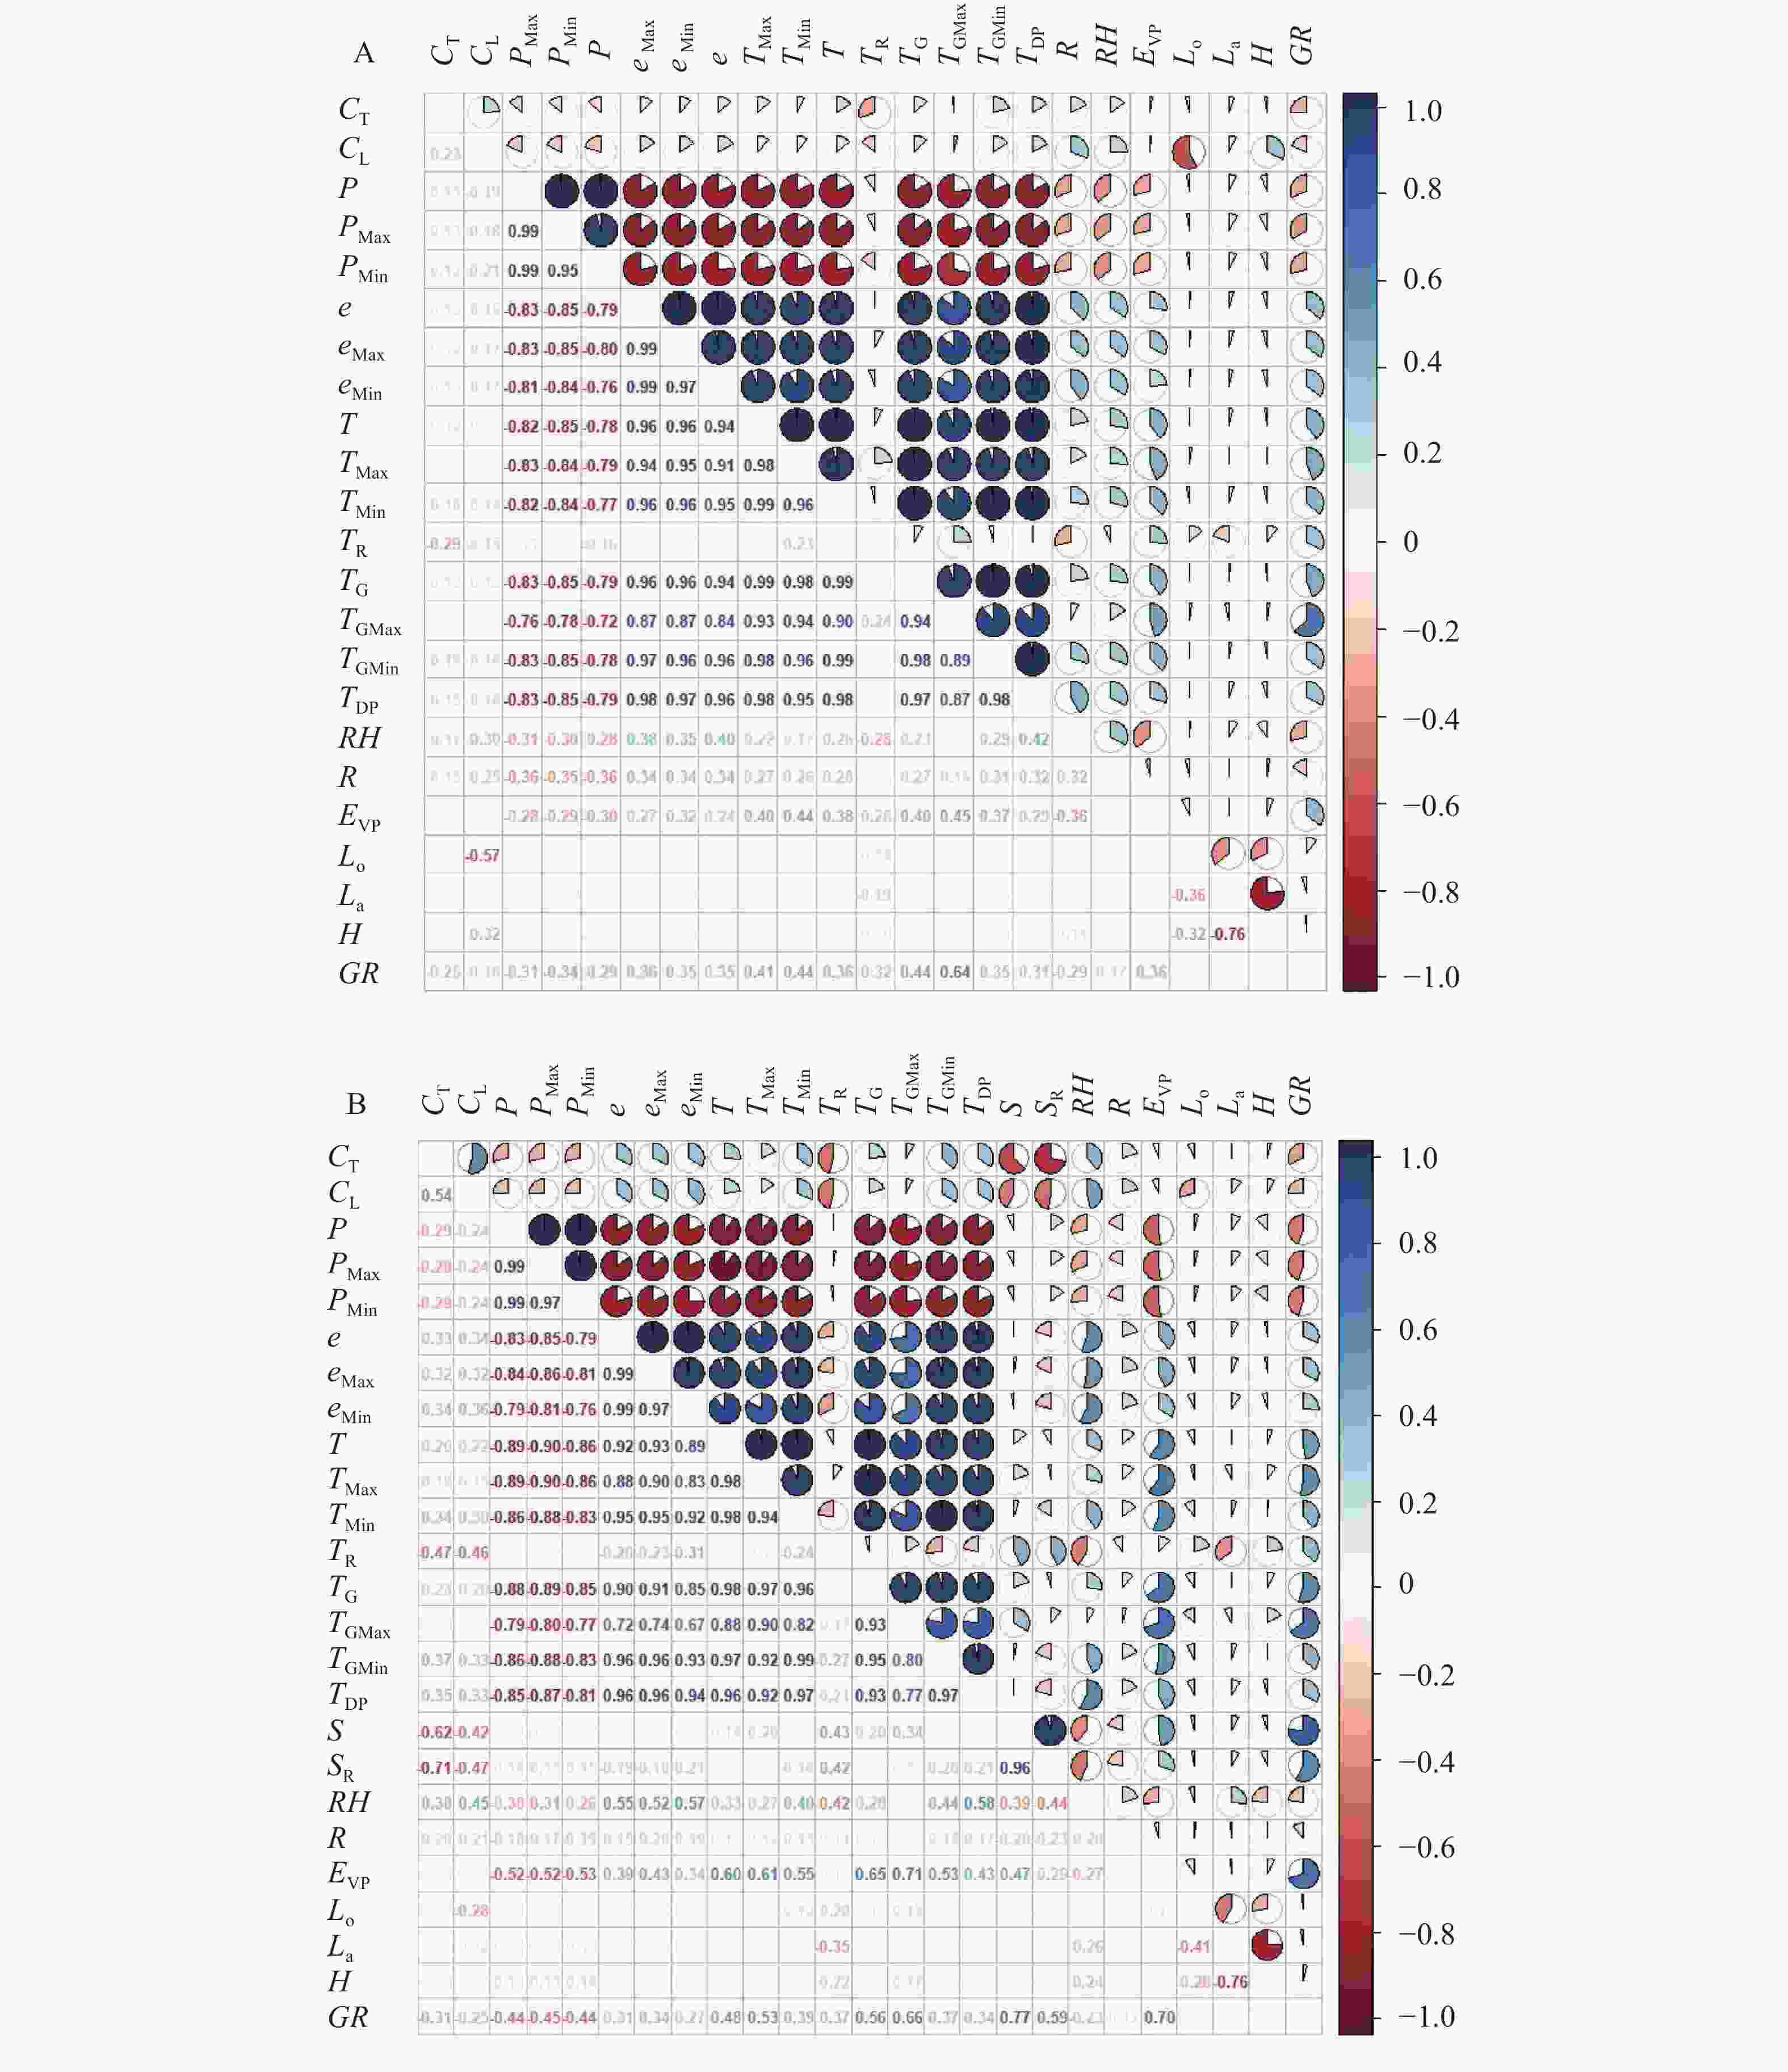
图 2 无日照(A, n=1515)和有日照(B, n=5050)天气情况下太阳日辐射与环境因子的相关性
CT: 逐日平均总云量; CL: 逐日平均低云量; P: 逐日平均气压; PMax: 逐日最高气压; PMin: 逐日最低气压; e: 逐日平均水汽压; eMax: 逐日最高水汽压; eMin: 逐日最低水汽压; T: 逐日平均气温; TMax: 逐日最高气温; TMin: 逐日最低气温; TR: 逐日气温日较差; TG: 逐日平均地表温度; TGMax: 逐日最高地表温度; TGMin: 逐日最低地表温度; TDP: 逐日露点温度; S: 逐日日照时数; SR: 逐日日照百分率; RH: 逐日相对湿度; R: 逐日降水量; Evp: 逐日蒸发量; Lo: 经度; La: 纬度; H: 海拔; GR: 逐日太阳日辐射。CT: daily total cloud cover; CL: daily low cloud cover; P: daily average atmospheric pressure; PMax: daily maximum atmospheric pressure; PMin: daily minimum atmospheric pressure; e: daily average vapour pressure; eMax: daily maximum vapour pressure; eMin: daily minimum vapour pressure; T: daily average temperature; TMax: daily maximum temperature; TMin: daily minimum temperature; TR: daily diurnal temperature range; TG: daily average surface temperature; TGMax: daily maximum ground temperature; TGMin: daily minimum ground temperature; TDP: daily dew point temperature; S: daily sunshine duration; SR: daily percentage of sunshine; RH: daily relative humidity; R: daily precipitation; Evp: daily evaporation; Lo: longitude; La: latitude; H: elevation; GR: daily global radiation.
Figure 2. Correlation between daily global radiation and environmental factors under without sunshine (A, n=1515) and sunshine (B, n=5050) conditions
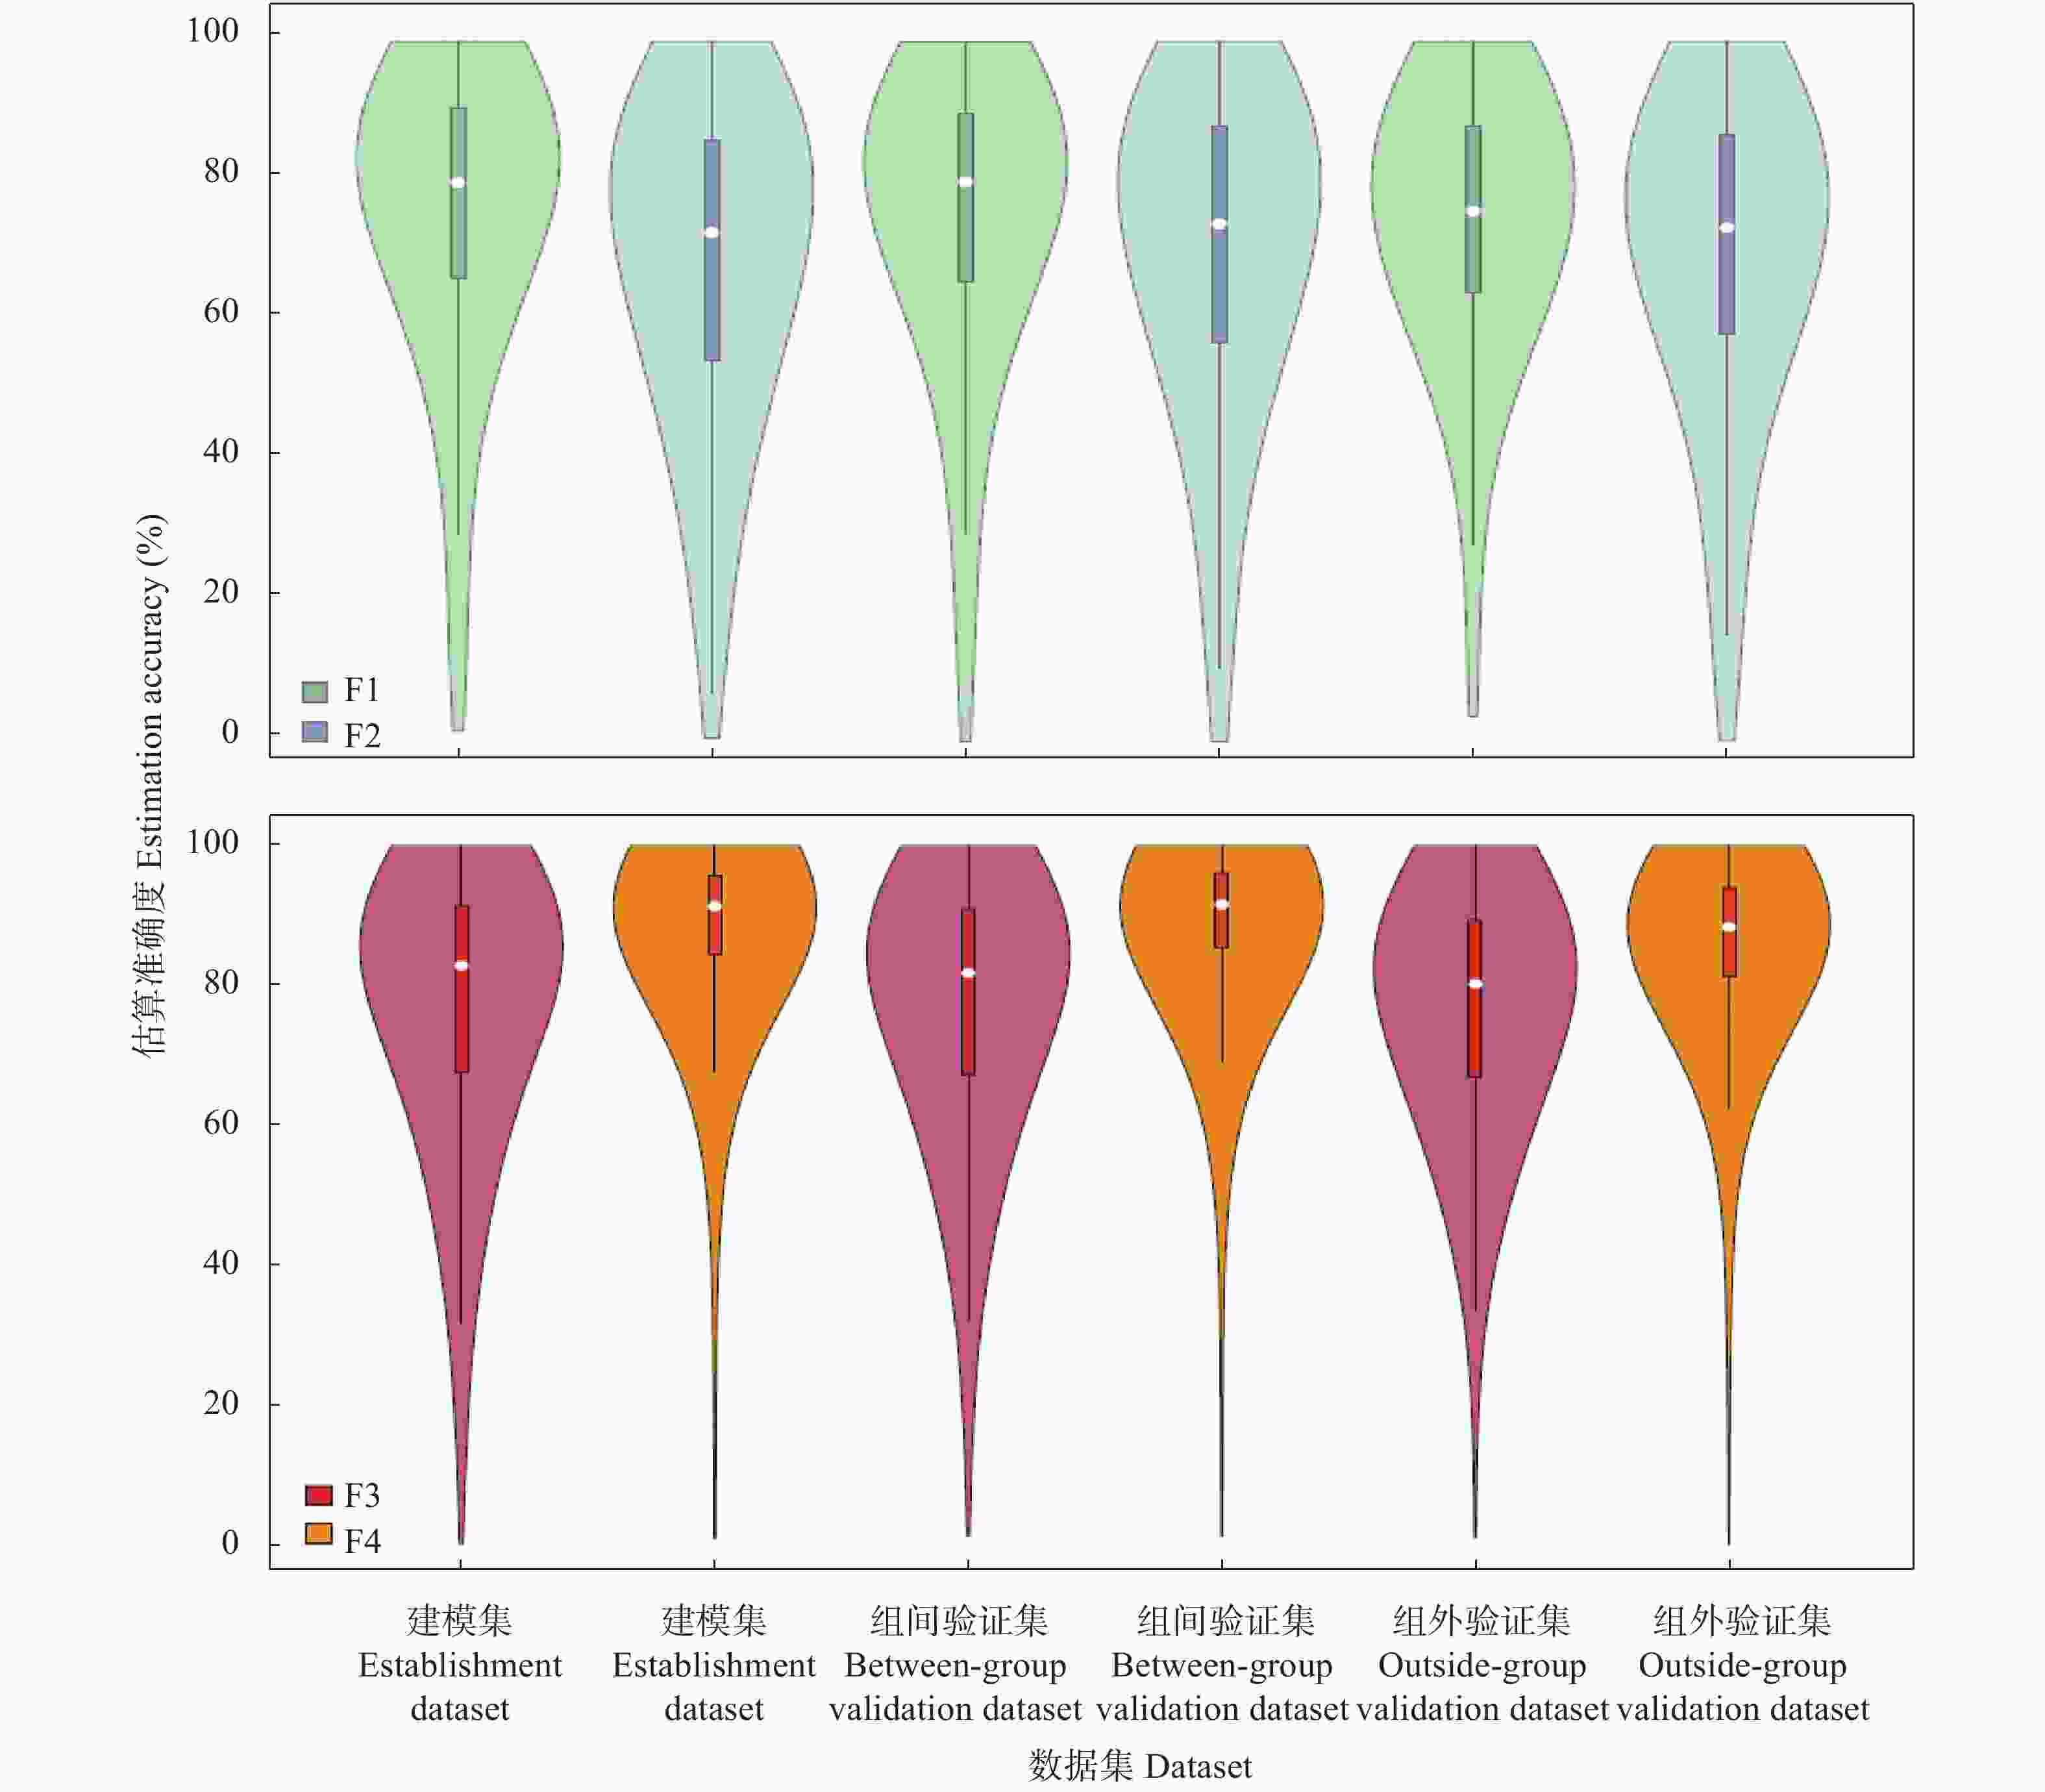
图 3 无日照(A, F1和F2模型)和有日照(B, F3和F4模型)天气情况下对建模集和验证集太阳日辐射的估算准确度
Figure 3. Estimation accuracies of models for daily global radiation estimation under without sunshine (A, model F1 and F2) and sunshine (B, F3 and F4 models) conditions based on establishment and validation datasets
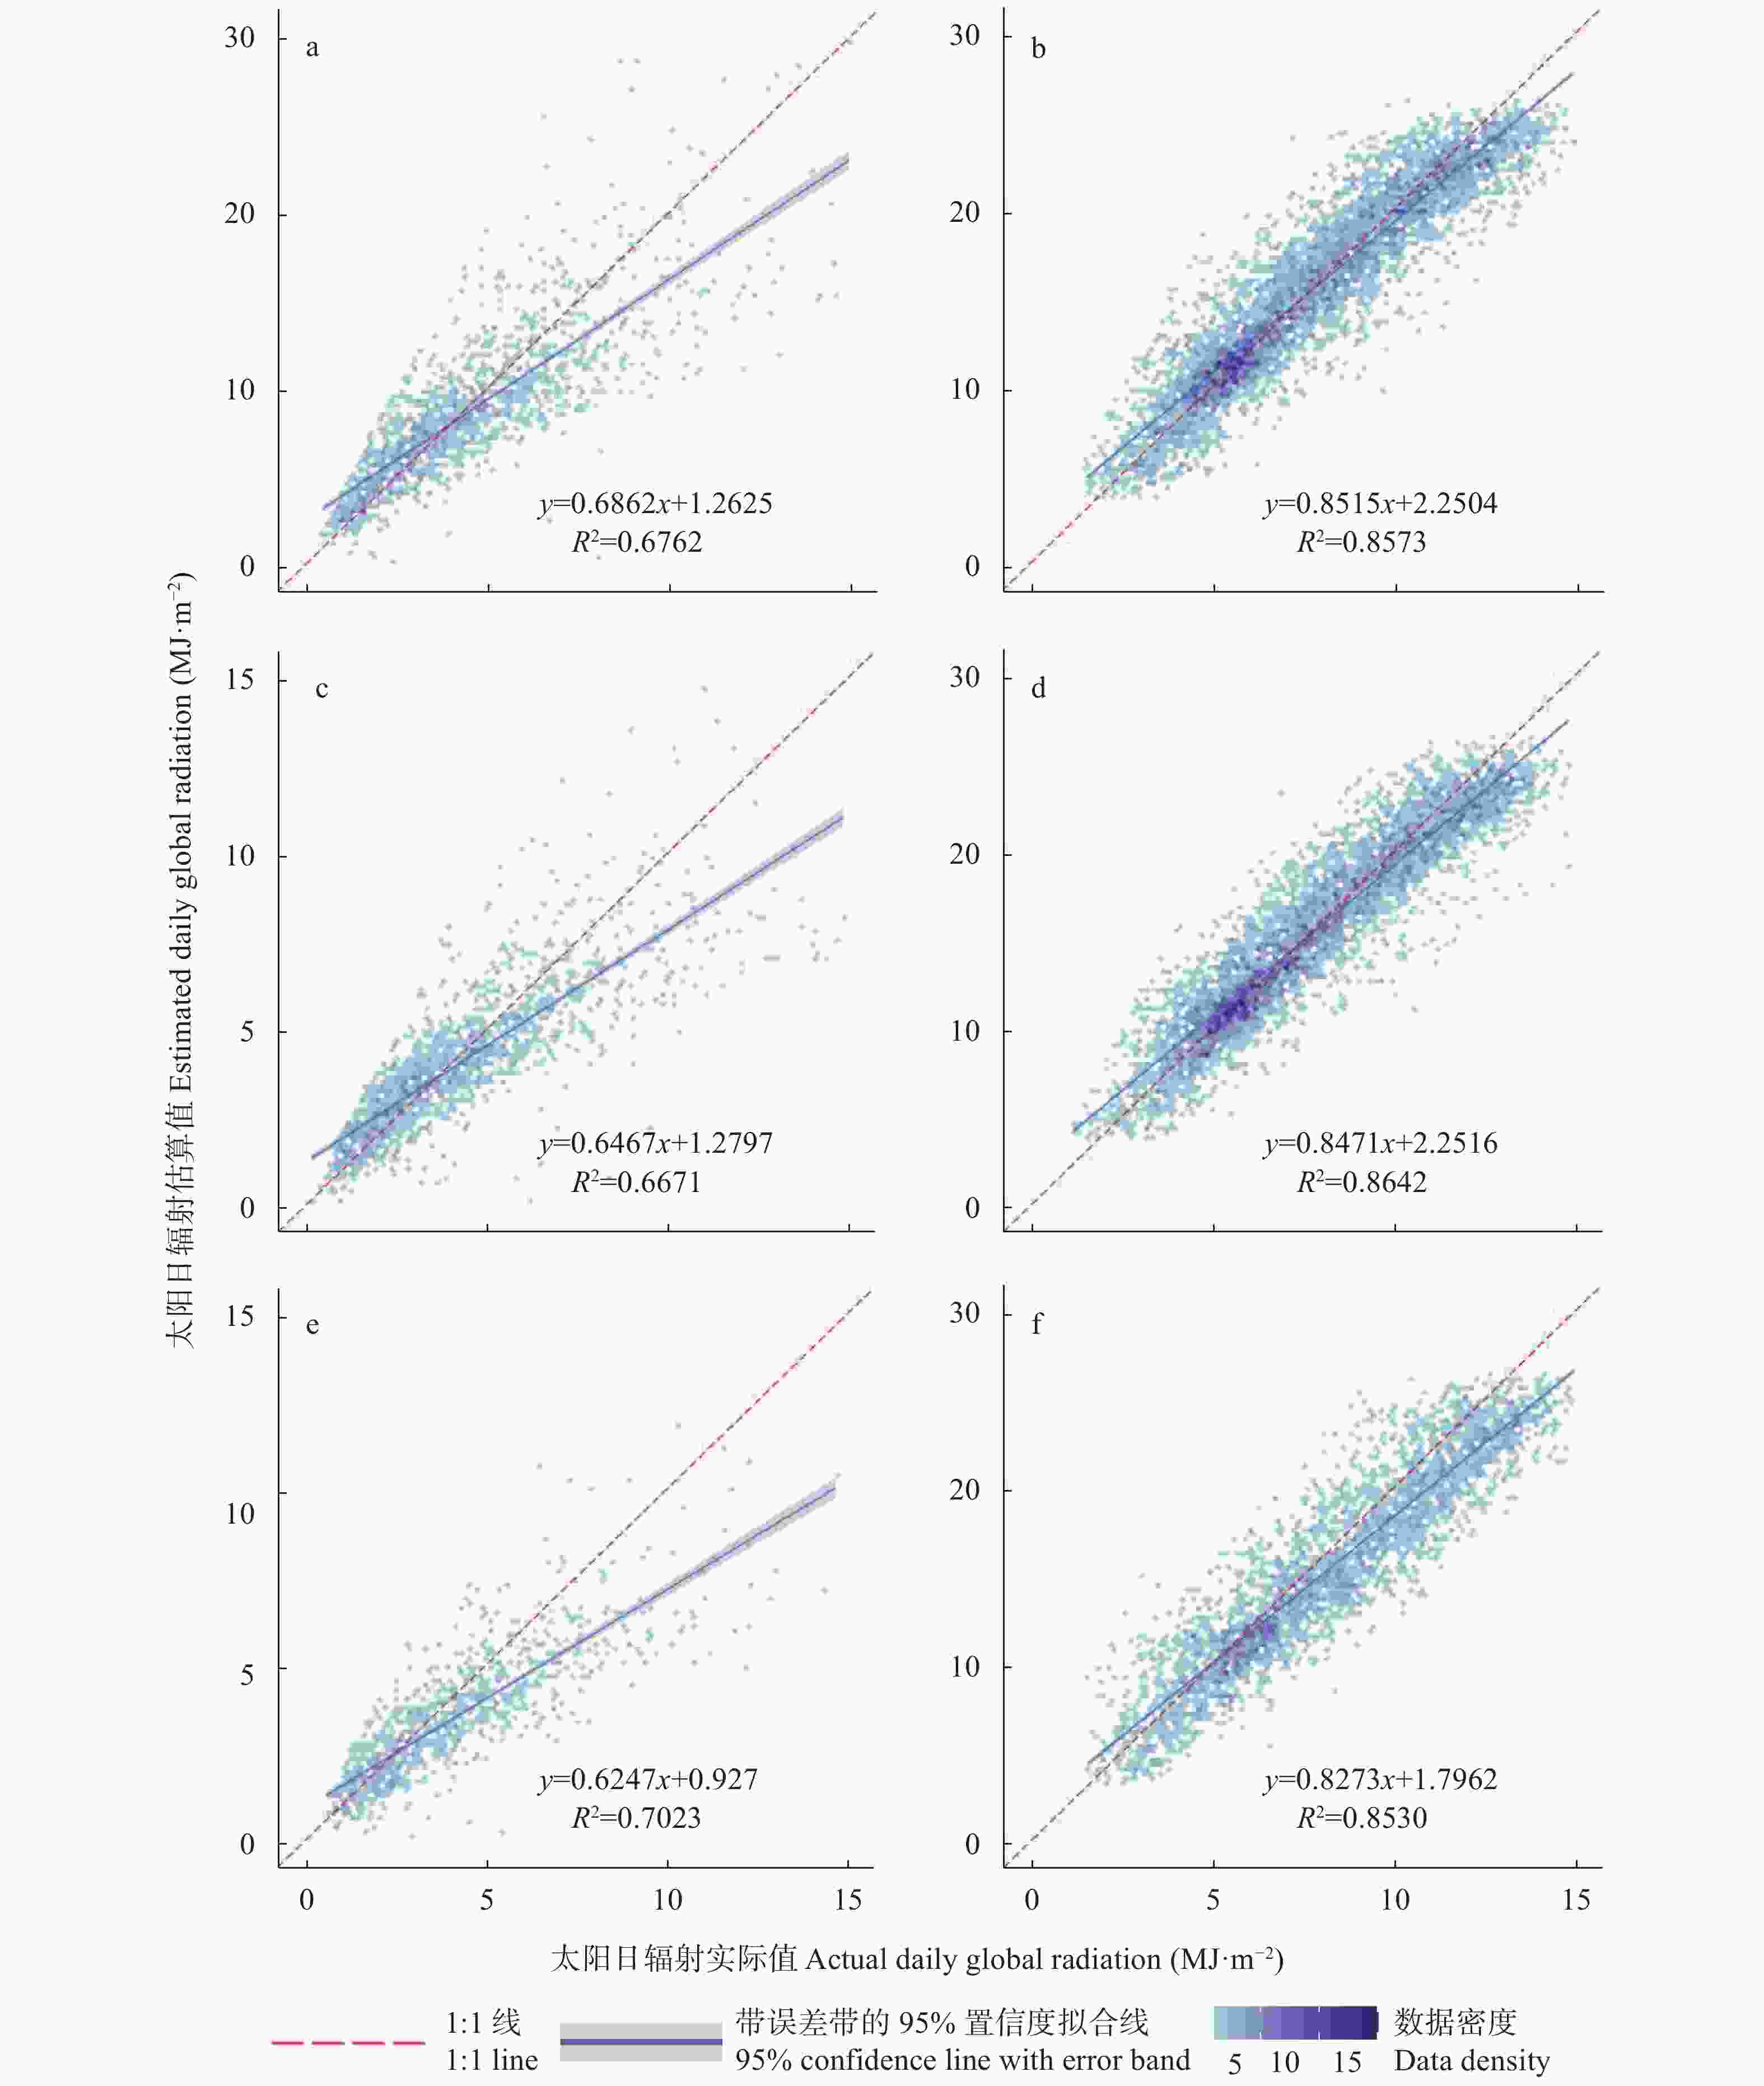
图 4 建模集和验证集基于模型F1和F4的太阳日辐射模拟值-实际值的散点分布图(a: 无日照建模集基于模型F1; b: 有日照建模集基于模型F4; c: 无日照组间验证集基于模型F1; d: 有日照组间验证集基于模型F4; e: 无日照组外验证集基于模型F1; f: 有日照组外验证集基于模型F4)
Figure 4. Scatter distribution diagrams of actual and simulated daily global radiation of models F1 and F4 based on establishment and validation datasets (a: model F1 based on establishment dataset under without sunshine condition; b: model F4 based on establishment dataset under sunshine condition; c: model F1 based on between-group validation dataset without sunshine condition; d: model F4 based on between-group validation dataset under sunshine condition; e: model F1 based on outside-group validation dataset without sunshine condition; f: model F4 based on outside-group validation dataset under sunshine condition)
表 1 有无日照天气情况下基于气象因子和天空辐射的太阳日辐射回归估算模型结构
Table 1. Structure of regression estimation models for daily global radiation under with and without sunshine conditions based on meteorological factors and radiation
模型
Model自变量
Independent variable因子数量
Number of factors因变量
Dependent variable无日照
Without sunshineF1 气象因子
Meteorological factors25 太阳日辐射
Daily global radiation (GR)F2 气象因子、天空辐射
Meteorological factors and sky radiation24 大气透明系数
Daily atmospheric transparency coefficient (GR/SR)有日照
Under sunshineF3 气象因子
Meteorological factors25 太阳日辐射
Daily global radiation (GR)F4 气象因子、天空辐射
Meteorological factors and sky radiation24 大气透明系数
Daily atmospheric transparency coefficient (GR/SR) 下载: 导出CSV
表 2 有无日照天气情况下基于气象因子和天空辐射的太阳日辐射回归估算模型
Table 2. Estimation models of daily global radiation under without sunshine and sunshine conditions based on meteorological factor and radiation
模型 Model 模型表达式 Model expression R2 F P 无日照
Without sunshineF1 GR=0.427TGMax−0.322 TDP−0.643 0.650 1405.750 0.000 F2 GR/SR=−0.030CT−0.003RH−0.001R+0.001TGMax+0.673 0.382 234.219 0.000 有日照
Under sunshineF3 GR=1.437S+5.401 0.592 7324.189 0.000 F4 GR/SR=1.281SR−0.067S+0.226 0.769 8405.086 0.000 GR为太阳日辐射, GR/SR为大气透明系数, TGMax为最高地表气温, TDP为露点温度, CT为总云量, RH为相对湿度, R为降水量, S为日照时数, SR为日照百分率。GR is the daily global radiation; GR/SR is the daily atmospheric transparency coefficient (ratio of global radiation to sky radiation); TGMax is the daily maximum ground temperature; TDP is the daily dew point temperature; CT is the daily total cloud cover; RH is the daily relative humidity; R is the daily precipitation; S is the daily sunshine duration; SR is the daily relative sunshine duration.
下载: 导出CSV
表 3 有无日照天气情况下不同太阳日辐射回归估算模型在不同数据集估算效果
Table 3. Estimation effects of models of daily global radiation under without sunshine and sunshine conditions in different datasets
% 模型
Models建模集
Establishment dataset组间验证集
Between-group validation dataset组外验证集
Outside-group validation dataset平均
Average异常点比例
Proportion of outliers估算准确度
Estimation accuracy异常点比例
Proportion of outliers估算准确度
Estimation accuracy异常点比例
Proportion of outliers估算准确度
Estimation accuracy异常点比例
Proportion of outliers估算准确度
Estimation accuracy无日照
Without sunshineF1 7.11 75.11 6.22 74.41 3.37 73.98 5.89 74.57 F2 11.59 68.29 11.68 69.51 6.64 69.28 10.51 69.00 有日照
Under sunshineF3 0.79 77.31 0.88 77.20 1.84 76.94 1.09 77.18 F4 0.83 87.93 0.66 88.44 1.28 85.87 0.88 87.60
下载: 导出CSV
-
[1] WU W, FAN L, LI M F, et al. Sensitivity analysis of crop growth models to multi-temporal scale solar radiation[J]. Transactions of the Chinese Society of Agricultural Engineering, 2012, 28(3): 123−128 [2] 王钧, 李广, 刘强. 基于LSTM神经网络模拟的陇中黄土高原沟壑区保护性耕作下土壤贮水量变化[J]. 中国生态农业学报(中英文), 2019, 27(8): 1226−1237WANG J, LI G, LIU Q. Soil water storage under conservation tillage based on LSTM neural network simulation in the Loess Plateau Gully Region of central Gansu[J]. Chinese Journal of Eco-Agriculture, 2019, 27(8): 1226−1237 [3] ROERINK G J, BOJANOWSKI J S, DE WIT A J W, et al. Evaluation of MSG-derived global radiation estimates for application in a regional crop model[J]. Agricultural and Forest Meteorology, 2012, 160: 36−47 doi: 10.1016/j.agrformet.2012.02.006 [4] WANG J, WANG E L, YIN H, et al. Differences between observed and calculated solar radiations and their impact on simulated crop yields[J]. Field Crops Research, 2015, 176: 1−10 doi: 10.1016/j.fcr.2015.02.014 [5] 岳伟, 陈金华, 阮新民, 等. 安徽省沿江地区双季稻光热资源利用效率变化特征及对气象产量的影响[J]. 中国生态农业学报(中英文), 2019, 27(6): 929−940YUE W, CHEN J H, RUAN X M, et al. Variation in characteristics of light and heat resource utilization efficiency of double-season rice and its impact on meteorological yield along the Yangtze River in Anhui Province[J]. Chinese Journal of Eco-Agriculture, 2019, 27(6): 929−940 [6] BESHARAT F, DEHGHAN A A, FAGHIH A R. Empirical models for estimating global solar radiation: a review and case study[J]. Renewable and Sustainable Energy Reviews, 2013, 21: 798−821 doi: 10.1016/j.rser.2012.12.043 [7] ANGSTROM A. Solar and terrestrial radiation[J]. Quarterly Journal of Royal Meteorological Society, 1924, 50(210): 121−125 doi: 10.1002/qj.49705021008 [8] SUMAN S, PULAK K P, SAON B, et al. Generation of common coefficients to estimate global solar radiation over different locations of India[J]. Theoretical and Applied Climatology, 2019, 136: 943−953 doi: 10.1007/s00704-018-2531-4 [9] BAHEL V, BAKHSH H, SRINIVASAN R. A correlation for estimation of global solar radiation[J]. Energy, 1987, 12(2): 131−135 doi: 10.1016/0360-5442(87)90117-4 [10] HARGREAVES G H, SAMANI Z A. Estimating potential evapotranspiration[J]. Journal of the Irrigation and Drainage Division, 1982, 108(3): 225−230 doi: 10.1061/JRCEA4.0001390 [11] BRISTOW K L, CAMPBELL G S. On the relationship between incoming solar radiation and daily maximum and minimum temperature[J]. Agricultural and Forest Meteorology, 1984, 31(2): 159−166 doi: 10.1016/0168-1923(84)90017-0 [12] RIVERO M, OROZCO S, SELLSCHOPP F S, et al. A new methodology to extend the validity of the Hargreaves-Samani model to estimate global solar radiation in different climates: Case study Mexico[J]. Renewable Energy, 2017, 114: 1340−1352 doi: 10.1016/j.renene.2017.08.003 [13] BAYRAKÇI H C, DEMIRCAN C, KEÇEBAŞ A. The development of empirical models for estimating global solar radiation on horizontal surface: a case study[J]. Renewable and Sustainable Energy Reviews, 2018, 81: 2771−2782 doi: 10.1016/j.rser.2017.06.082 [14] QUEJ V H, ALMOROX J, ARNALDO J A, et al. ANFIS, SVM and ANN soft-computing techniques to estimate daily global solar radiation in a warm sub-humid environment[J]. Journal of Atmospheric and Solar-Terrestrial Physics, 2017, 155: 62−70 doi: 10.1016/j.jastp.2017.02.002 [15] OZOEGWU C G. Artificial neural network forecast of monthly mean daily global solar radiation of selected locations based on time series and month number[J]. Journal of Cleaner Production, 2019, 216: 1−13 doi: 10.1016/j.jclepro.2019.01.096 [16] PEREIRA R M, SILVA SANTOS C, ROCHA A. Solar irradiance modelling using an offline coupling procedure for the Weather Research and Forecasting (WRF) model[J]. Solar Energy, 2019, 188: 339−352 doi: 10.1016/j.solener.2019.06.020 [17] SHAMIM M A, REMESAN R, BRAY M, et al. An improved technique for global solar radiation estimation using numerical weather prediction[J]. Journal of Atmospheric and Solar-Terrestrial Physics, 2015, 129: 13−22 doi: 10.1016/j.jastp.2015.03.011 [18] PIRI J, KISI O. Modelling solar radiation reached to the Earth using ANFIS, NN-ARX, and empirical models (case studies: Zahedan and Bojnurd stations)[J]. Journal of Atmospheric and Solar-Terrestrial Physics, 2015, 123: 39−47 doi: 10.1016/j.jastp.2014.12.006 [19] FENG Y, HAO W P, LI H R, et al. Machine learning models to quantify and map daily global solar radiation and photovoltaic power[J]. Renewable and Sustainable Energy Reviews, 2020, 118: 109393 doi: 10.1016/j.rser.2019.109393 [20] 李净, 冯姣姣, 王卫东, 等. 基于LM-BP神经网络的西北地区太阳辐射时空变化研究[J]. 地理科学, 2016, 36(5): 780−786LI J, FENG J J, WANG W D, et al. Spatial and temporal changes in solar radiation of Northwest China based LM-BP neural network[J]. Scientia Geographica Sinica, 2016, 36(5): 780−786 [21] 毛洋洋, 赵艳霞, 张祎, 等. 五个常见日太阳总辐射模型在华北地区的有效性验证及分析[J]. 中国农业气象, 2016, 37(5): 520−530 doi: 10.3969/j.issn.1000-6362.2016.05.004MAO Y Y, ZHAO Y X, ZHANG Y, et al. Validation and analysis of five general daily solar radiation estimation models used in Northern China[J]. Chinese Journal of Agrometeorology, 2016, 37(5): 520−530 doi: 10.3969/j.issn.1000-6362.2016.05.004 [22] 吴鹏, 杨文斌, 崔迎春, 等. 喀斯特区天峨槭 (Acer wangchii) 树干液流特征及其与环境因子的相关分析[J]. 生态学报, 2017, 37(22): 7552−7567WU P, YANG W B, CUI Y C, et al. Characteristics of sap flow and correlation analysis with environmental factors of Acer wangchii in the Karst area[J]. Acta Ecologica Sinica, 2017, 37(22): 7552−7567 [23] 冀健红, 刘新阳. 温室番茄植株蒸腾变化规律及主要影响因素研究[J]. 节水灌溉, 2020(8): 40–43JI J H, LIU X Y. A study on transpiration variation law and its main influencing factors of tomato grown in a solar greenhouse[J]. Water Saving Irrigation, 2020(8): 40–43 [24] 陈东旭, 黄萧霖, 陈留根, 等. 长江中下游地区稻田不同时间尺度土壤热通量特征分析[J]. 水土保持研究, 2021, 28(4): 151−158CHEN D X, HUANG X L, CHEN L G, et al. Analysis of soil heat flux characteristics at different time scales in paddy fields in the middle and lower reaches of the Yangtze River[J]. Research of Soil and Water Conservation, 2021, 28(4): 151−158 [25] 詹云军, 章文, 严岩, 等. 长江流域实际蒸散发演变趋势及影响因素分析[J]. 生态学报, 2021, 41(17): 1−12ZHAN Y J, ZHANG W, YAN Y, et al. Anaysis of actual evapotranspiration evolution and influencing factors in the Yangtze River Basin[J]. Acta Ecologica Sinica, 2021, 41(17): 1−12 [26] IQBAL M. An Introduction to Solar Adiation[M]. Toronto: Academic Press, 1983 [27] 张佩, 陈郑盟, 刘春伟, 等. 冬小麦产量结构要素预报方法[J]. 农业工程学报, 2020, 36(8): 78−87 doi: 10.11975/j.issn.1002-6819.2020.08.010ZHANG P, CHEN Z M, LIU C W, et al. Method for the prediction of wheat yield components[J]. Transactions of the Chinese Society of Agricultural Engineering, 2020, 36(8): 78−87 doi: 10.11975/j.issn.1002-6819.2020.08.010 [28] 张佩, 陈郑盟, 马顺登, 等. 用冠层叶色偏态分布模式RGB模型预测大豆产量[J]. 农业工程学报, 2021, 37(9): 120−126 doi: 10.11975/j.issn.1002-6819.2021.09.014ZHANG P, CHEN Z M, MA S D, et al. Prediction of soybean yield by using RGB model with skew distribution pattern of canopy leaf color[J]. Transactions of the Chinese Society of Agricultural Engineering, 2021, 37(9): 120−126 doi: 10.11975/j.issn.1002-6819.2021.09.014 [29] 江铭诺, 刘朝顺, 高炜. 华北平原夏玉米潜在产量时空演变及其对气候变化的响应[J]. 中国生态农业学报, 2018, 26(6): 865−876JIANG M N, LIU C S, GAO W. Analysis of spatial and temporal variation in potential summer maize yield and its response to climate change in the North China Plain[J]. Chinese Journal of Eco-Agriculture, 2018, 26(6): 865−876 [30] YILDIRIM H B, ÇELIK Ö, TEKE A, et al. Estimating daily global solar radiation with graphical user interface in Eastern Mediterranean region of Turkey[J]. Renewable and Sustainable Energy Reviews, 2018, 82: 1528−1537 doi: 10.1016/j.rser.2017.06.030 [31] DENG J M, ZHANG Y L, QIN B Q, et al. Long-term changes in surface solar radiation and their effects on air temperature in the Shanghai region[J]. International Journal of Climatology, 2015, 35(12): 3385−3396 doi: 10.1002/joc.4212 [32] SIVA KRISHNA RAO K D V, PREMALATHA M, NAVEEN C. Models for forecasting monthly mean daily global solar radiation from in situ measurements: Application in tropical climate, India[J]. Urban Climate, 2018, 24: 921−939 doi: 10.1016/j.uclim.2017.11.004 [33] HASSAN G E, YOUSSEF M E, MOHAMED Z E, et al. New temperature-based models for predicting global solar radiation[J]. Applied Energy, 2016, 179: 437−450 doi: 10.1016/j.apenergy.2016.07.006 [34] 袁振, 吴相利, 臧淑英, 等. 基于TM影像的哈尔滨市主城区绿地降温作用研究[J]. 地理科学, 2017, 37(10): 1600−1608YUAN Z, WU X L, ZANG S Y, et al. Cooling effect of green patche based on TM image in Harbin downtown city[J]. Scientia Geographica Sinica, 2017, 37(10): 1600−1608 -

 下载:
下载:


 点击查看大图

计量
- 文章访问数: 281
- HTML全文浏览量: 74
- PDF下载量: 43
- 被引次数: 0
