

Water-nitrogen coupling influence on rhizosphere environment and root morphology of rice under wheat straw return
-
摘要: 通过大田试验, 研究不同水分管理、秸秆还田和氮素处理与水稻根系形态建成的关系, 为成都平原秸秆还田下适宜水稻生长的水氮耦合模式的建立提供理论和实践依据。以杂交稻‘F优498’为材料, 设置不同水分[干湿交替灌溉(W1)、淹水灌溉(W2)]、氮肥运筹[总氮150 kg(N)∙hm−2, 基肥∶蘖肥∶穗肥分别为3∶3∶4 (N1)、7∶3∶0 (N2)、不施氮(N0)]和秸秆还田[秸秆全量翻埋还田(S1)、秸秆不还田(S0)]处理, 研究在秸秆还田下不同水氮耦合对麦茬杂交籼稻根际环境及根系发育的影响。结果表明, 与W2相比, W1促进了拔节期前的秸秆腐解, 提高了拔节期后的根际土壤有机酸总量(1.38%~8.49%)和成熟期前的根际土壤微生物量碳含量(0.25%~12.93%), 提高了整个生育期根系活力(1.77%~149.91%)和除移栽后10 d与成熟期的群体根系形态指标(群体根长18.53%~75.83%、群体根数10.57%~101.33%、群体根体积2.49%~88.24%、群体根表面积8.91%~68.08%); W2提高了拔节期的有机酸总量(3.34%)和成熟期的微生物碳含量(2.69%~6.23%), 并促进了拔节期后的秸秆腐解和单茎根系发育(单茎根长12.03%~27.21%、单茎根数9.05%~51.44%)。秸秆还田(S1)与秸秆不还田(S0)相对比,S1会抑制根系形态发育并降低根系活力(2.47%~45.83%), 但能显著提高根际土壤有机酸总量(8.02%~22.74%)和微生物量碳、氮含量(1.58%~31.22%), 且在W1处理下提升效果更显著。施用氮肥能促进秸秆腐解, 并进一步增加根际土壤有机酸总量与微生物量碳、氮含量, 促进根系发育并提高根系活力。优化施氮模式(N1)与传统施氮模式(N2)相对比,N1可以促进单茎根系发育(单茎根长8.27%~38.09%、单茎根数2.96%~36.66%)与生育中后期的根系活力(2.26%~156.35%), N2则提高了群体根系指标(群体根体积12.68%~44.32%、群体根表面积4.91%~55.82%)和生育前期的根系活力(22.01%~29.31%)。干湿交替灌溉耦合优化施氮模式促进了各时期秸秆腐解, 显著加快了根系的生长发育, 并提高了根际土壤有机酸总量、微生物量碳、氮含量和根系活力, 延缓了根系衰老。综合来看, 在秸秆还田条件下, 干湿交替灌溉耦合优化施氮模式为最适水氮耦合模式。Abstract: To provide a theoretical and practical basis for establishing a water-nitrogen coupling model suitable for rice growth under straw return in the Chengdu Plain, the relationship between water management, straw return, N application, and rice root morphogenesis was studied through field experiments. The effects of water-nitrogen coupling on the rhizosphere environment and root development of hybrid indica rice (Oryza sativa) ‘F You 498’ under wheat straw return conditions were investigated with the application of two water treatments, three N treatments, and two straw return treatments. The two water treatments were alternate dry-wet irrigation (W1) and submerged irrigation (W2); the straw return treatments were full-burying and return of wheat straw (S1) and no straw return (S0); and the N treatments involved the application of 150 kg∙hm−2 of N applied at ratios of basal∶tillering∶panicle fertilizers of 3∶3∶4 (N1), 7∶3∶0 (N2), and 0 (N0). The results showed that compared with W2, W1 promoted straw decomposition before the jointing stage, increased the total organic acid content of rhizosphere soil after the jointing period (1.38%–8.49%) and microbial biomass C content of rhizosphere soil before maturity (0.25%–12.93%), increased root activity during the entire growth period, and increased root morphological indices of the rice population, except at 10 days after transplanting and at the mature stage (18.53%–75.83% of root length, 10.57%–101.33% of root number, 2.49%–88.24% of root volume, and 8.91%−68.08% of root surface area). Compared with W1, W2 increase the total organic acids (3.34%) and microbial biomass C content (2.69%–6.23%) at the mature stage, and the decomposition of straw and the root morphological indices of single stems (12.03%–27.21% of root length and 9.05%–51.44% of root number). Compared with S0, S1 treatment inhibited root morphology development and reduced root activity (2.47%–45.83%), but increased the total organic acid content (8.02%–22.74%) and microbial biomass C and N levels of rhizosphere soil (1.58–31.22%), and the effect of improvement was highly noticeable under W1. The application of N fertilizer promoted the decomposition of straw, increased the total organic acids and microbial biomass C and N contents of rhizosphere soil, promoted root development, and increased root activity. Compared with N0, the optimal N application mode (N1) promoted the root development of single stems (8.27%–38.09% of root length and 2.96%–36.66% of root number) and promoted and maintained the root activity (2.26%–156.35%) in the middle and late growth stages; whereas the conventional N application mode (N2) increased the population root index (12.68%–44.32% of root volume and 4.91%–55.82% of root surface area) and root activity only in the early growth stage (22.01%–29.31%). W1 irrigation coupled with optimized N application promoted straw decomposition, significantly accelerated root growth and development, increased total organic acid content, microbial biomass C and N contents, and root activity in rhizosphere soil, and delayed root senescence. Therefore, under the condition of straw return, the optimized N application mode with W1 is the most suitable agriculture model.
-
Key words:
- Indica hybrid rice /
- Water-nitrogen coupling /
- Straw return /
- Rhizosphere environment /
- Root morphology
-

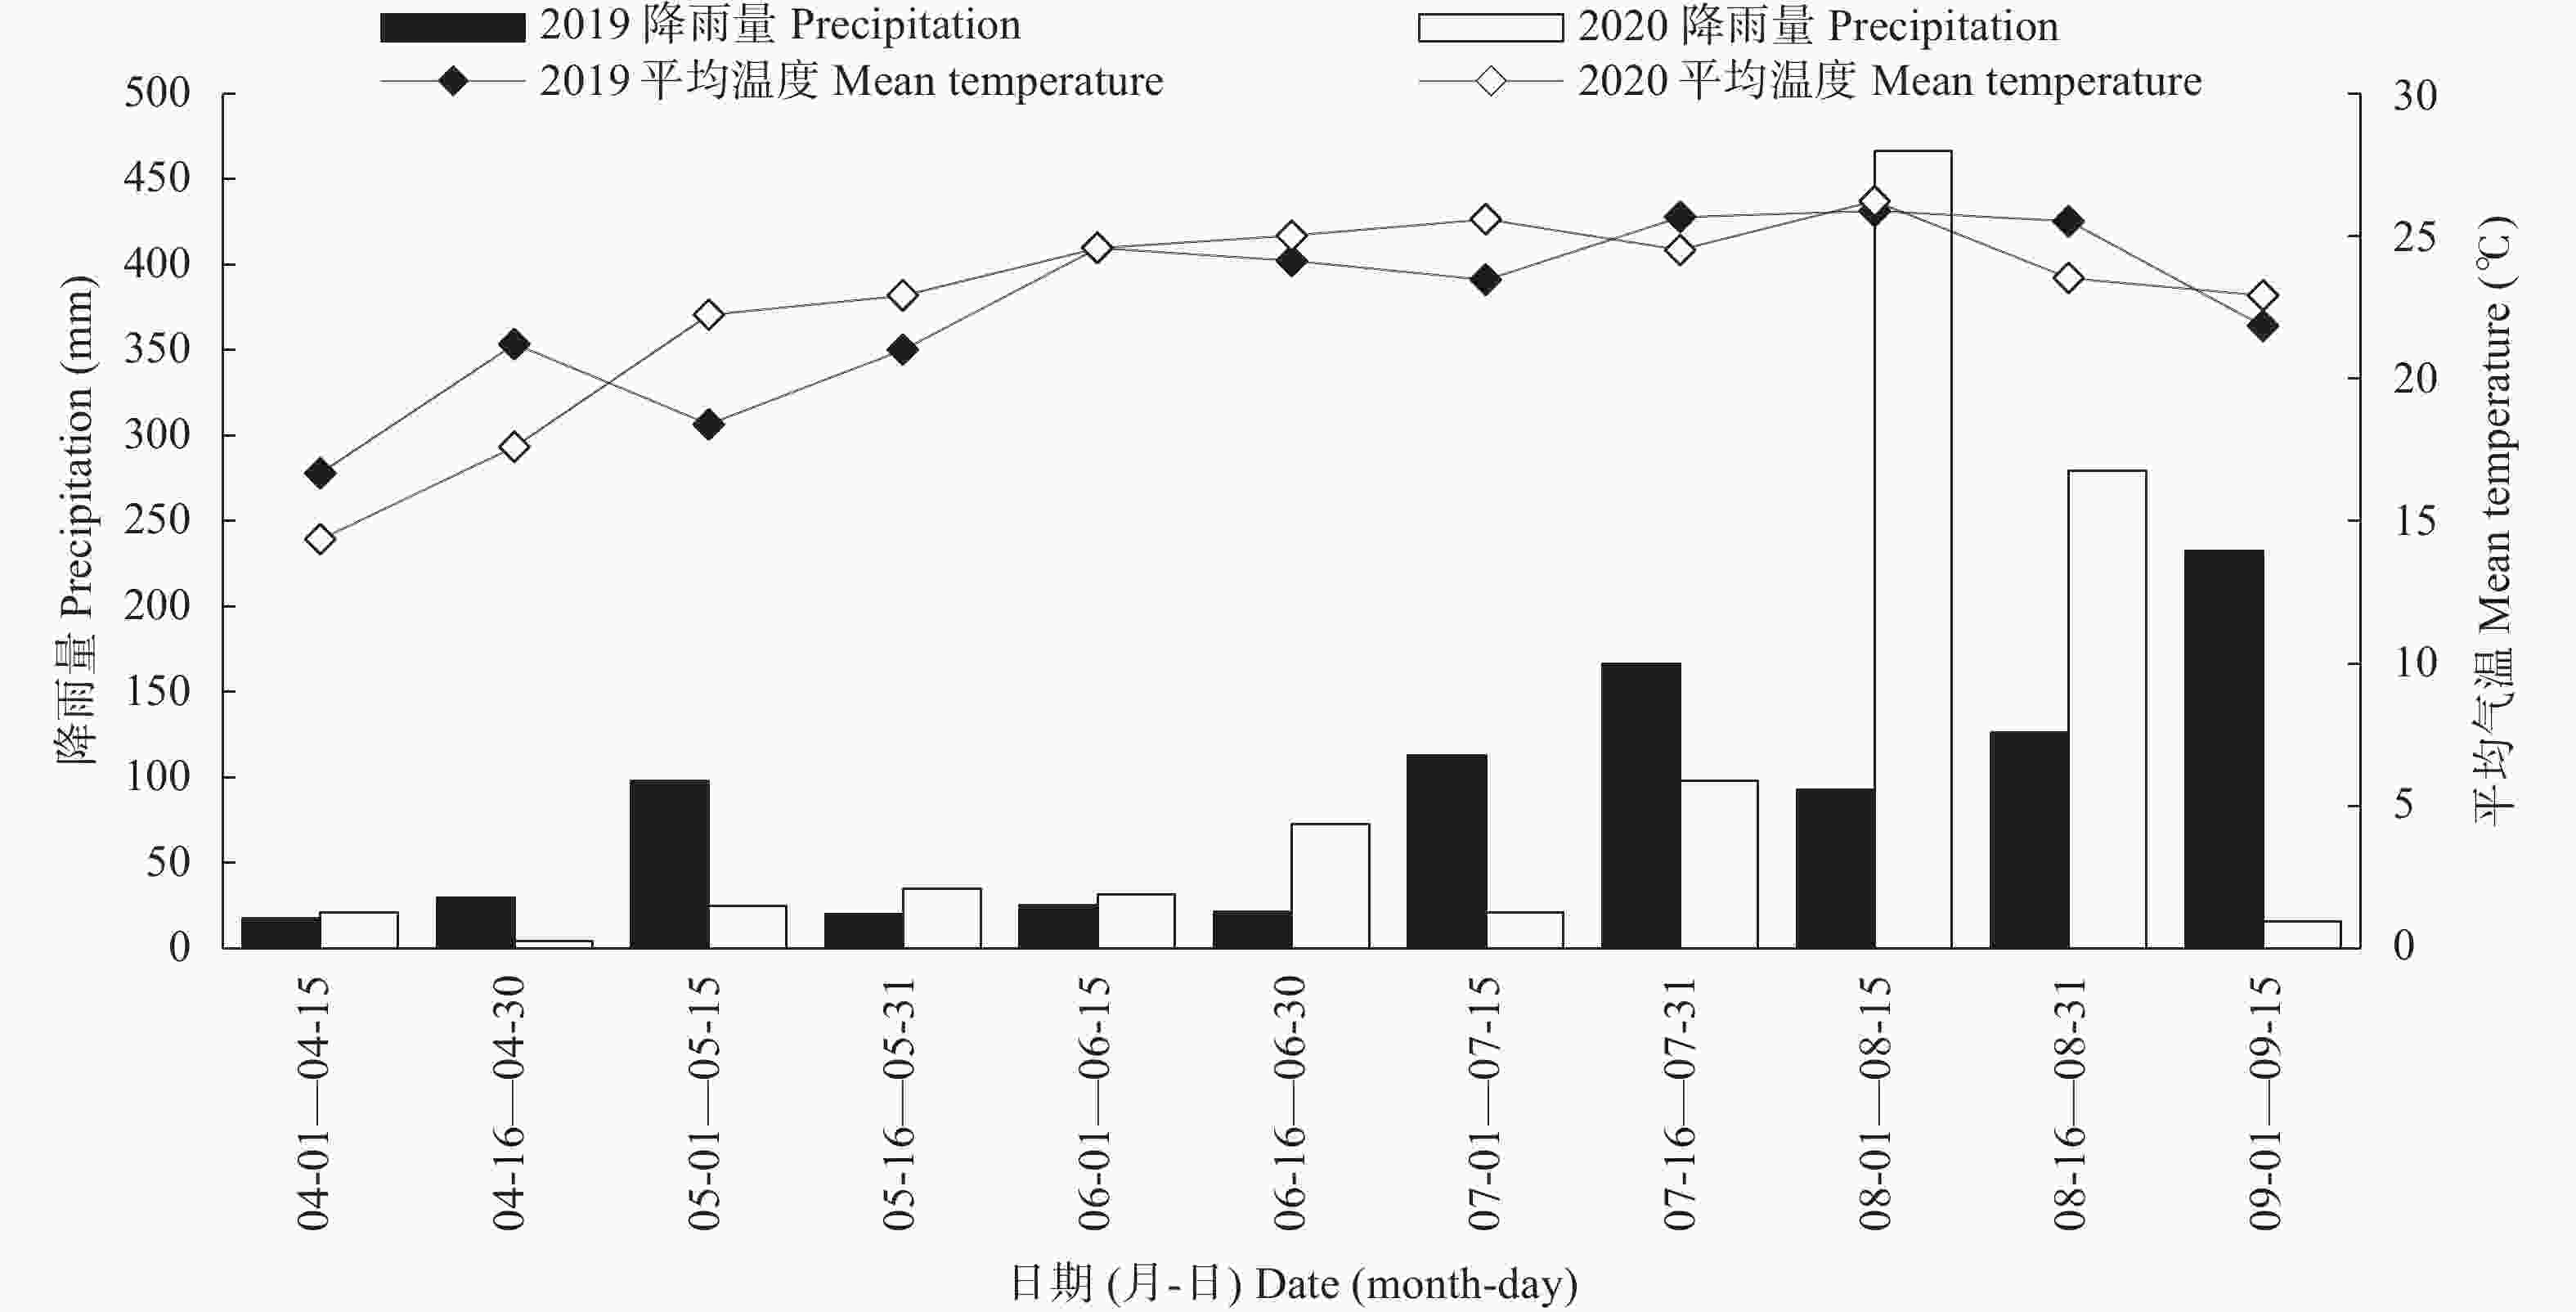
图 1 2019—2020年水稻生长季平均气温和降雨量
Figure 1. Mean temperature and precipitation during the growth seasons of rice in 2019 and 2020
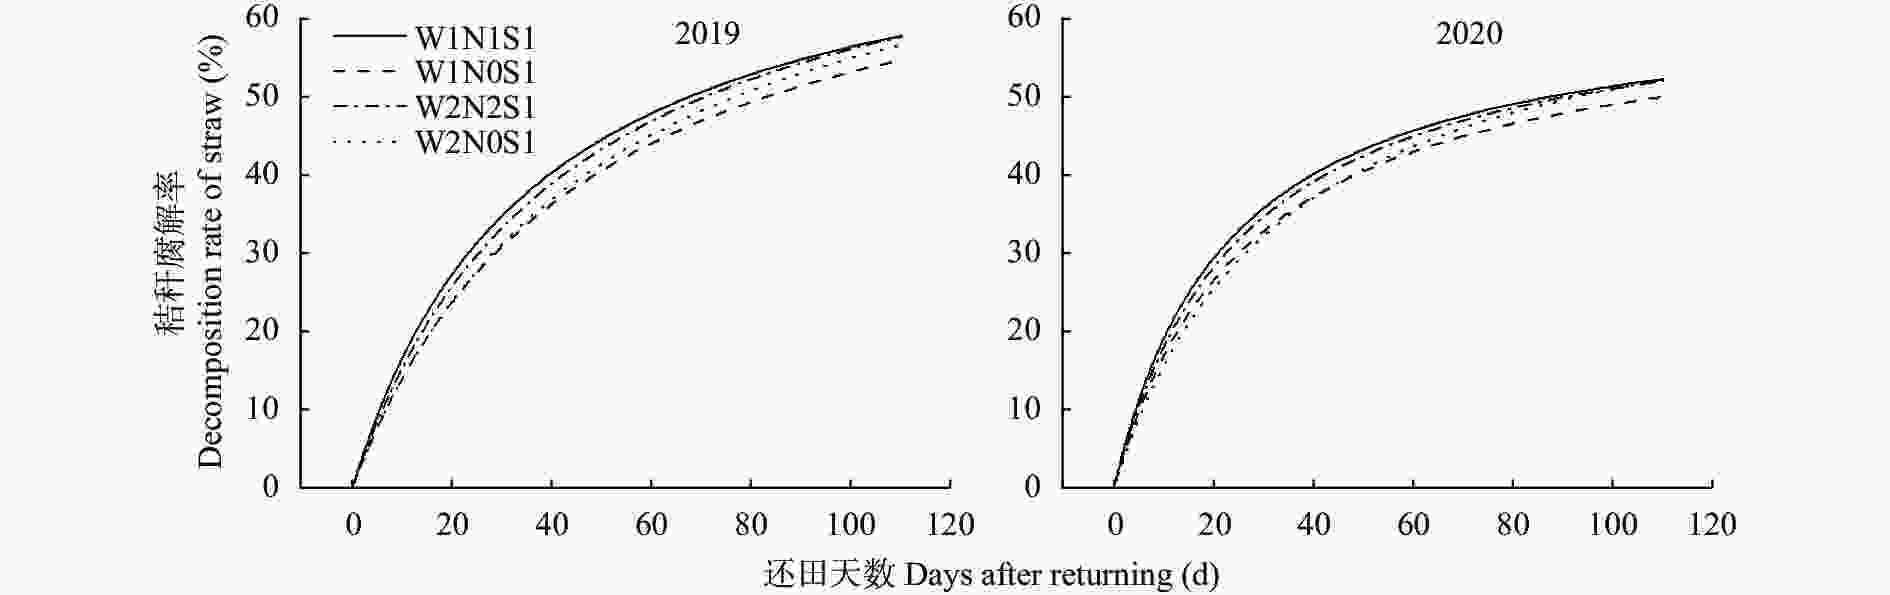
图 2 不同水氮耦合处理下水稻季秸秆腐解率随还田天数的变化
各处理具体描述见表1。
Figure 2. Changes of straw decomposition rate with returning days in rice season under different treatments of water management and nitrogen application
The detail information of each treatment is shown in Table 1.
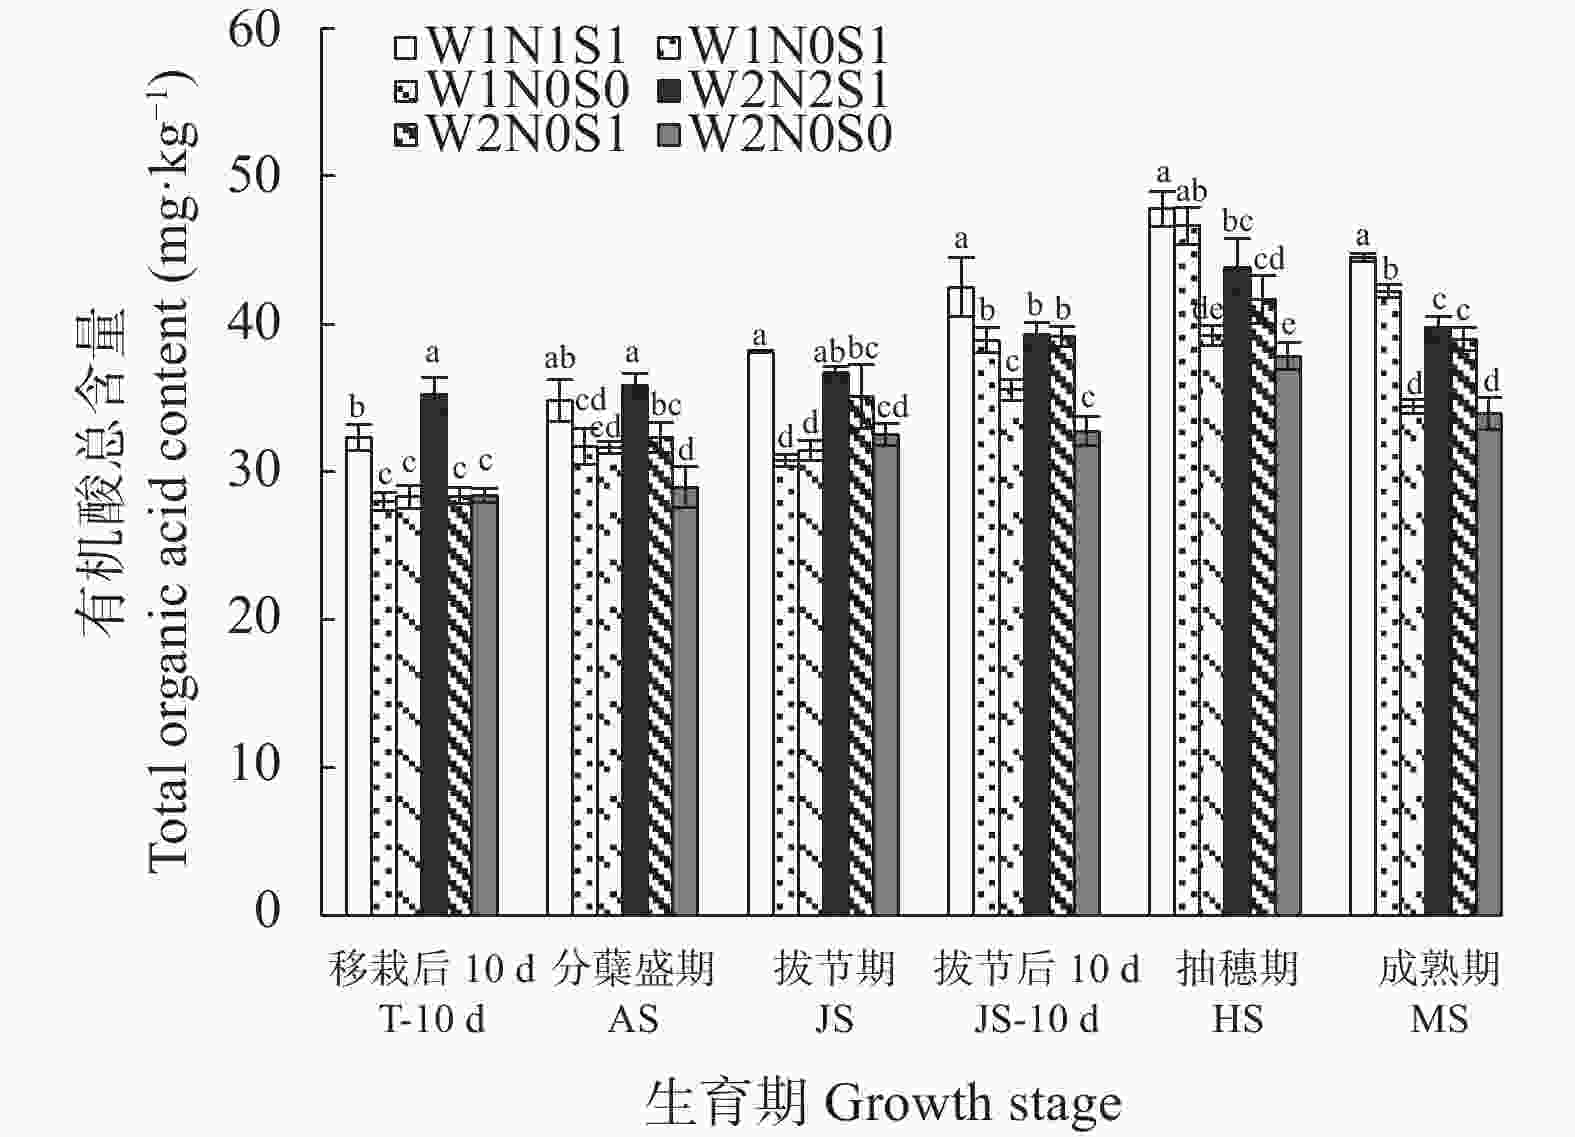
图 3 2020年秸秆还田下不同水氮耦合处理的水稻各生育期根际土壤有机酸总量
各处理具体描述见表1。不同小写字母表示同一生育期不同处理间差异显著(P<0.05)。
Figure 3. Changes of total organic acids contetns in rice rhizosphere soil at different growth stages under different treatments of water-nitrogen coupling and straw returning in 2020
The detail information of each treatment is shown in Table 1. T-10 d: 10 days after transplanting; AS: active tillering stage; JS: jointing stage; JS-10 d: 10 days after jointing; HS: heading stage; MS: maturity stage. Different lowercase letters mean significant differences among treatments at the same growth stage.
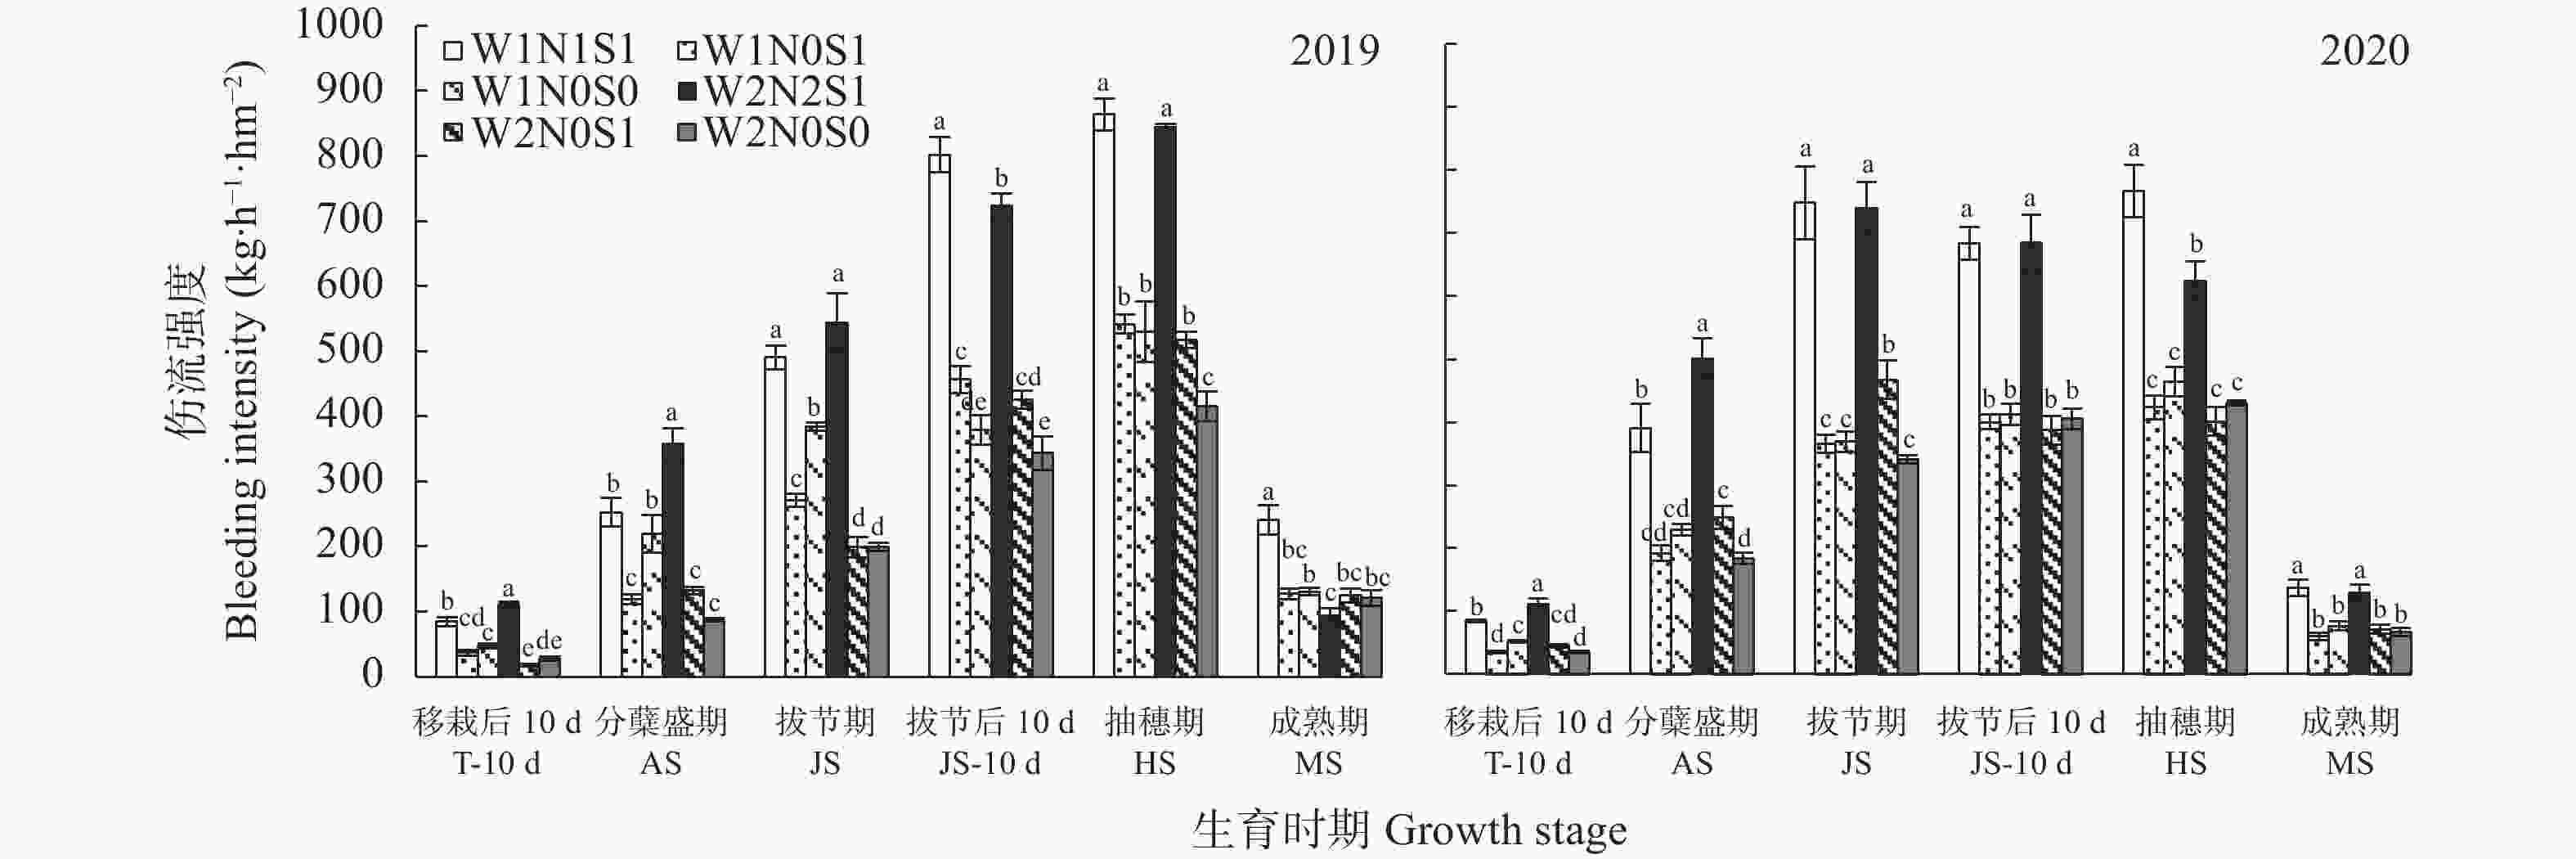
图 4 2019年和2020年秸秆还田下不同水氮耦合处理的水稻各生育期群体根系伤流强度
各处理具体描述见表1。不同小写字母表示同一生育期不同处理间差异显著(P<0.05)。
Figure 4. Changes of root bleeding intensities of rice population at different growth stages under different treatments of water-nitrogen coupling and straw returning in 2019 and 2020
The detail information of each treatment is shown in Table 1. T-10 d: 10 days after transplanting; AS: active tillering stage; JS: jointing stage; JS-10 d: 10 days after jointing; HS: heading stage; MS: maturity stage. Different lowercase letters mean significant differences among treatments at the same growth stage.
表 1 不同处理的水氮耦合模式及其秸秆还田方式
Table 1. Coupling modes of water-nitrogen and straw returning modes of different treatments
处理
Treatment水分管理模式
Water management氮肥施用模式
Nitrogen fertilizer (N)秸秆还田方式
Straw returning (S)W1N1S1 干湿交替灌溉
Alternative dry-wet irrigation (W1)优化施氮模式
Optimal nitrogen application (N1)全量翻埋还田
Full-burying and returning (S1)W1N0S1 干湿交替灌溉
Alternative dry-wet irrigation (W1)不施氮
No nitrogen fertilizer (N0)全量翻埋还田
Full-burying and returning (S1)W1N0S0 干湿交替灌溉
Alternative dry-wet irrigation (W1)不施氮
No nitrogen fertilizer (N0)不还田
No returning (S0)W2N2S1 淹水灌溉
Submerged irrigation (W2)传统施氮模式
Conventional nitrogen application (N2)全量翻埋还田
Full-burying and returning (S1)W2N0S1 淹水灌溉
Submerged irrigation (W2)不施氮
No nitrogen fertilizer (N0)全量翻埋还田
Full-burying and returning (S1)W2N0S0 淹水灌溉
Submerged irrigation (W2)不施氮
No nitrogen fertilizer (N0)不还田
No returning (S0) 下载: 导出CSV
表 2 不同水氮耦合处理下水稻季秸秆腐解率(y)随还田天数(x)变化的米氏方程拟合
Table 2. Michaelis-Menten equation fitting of straw decomposition rate (y) with returning days (x) in rice season under different treatments of water management and nitrogen application
年份
Year处理
Treatment米氏方程
Michaelis-Menten equationR2 Km (d) 2019 W1N1S1 y=76.899x/(36.214+x) 0.989 36.214 W1N0S1 y=77.063x/(44.812+x) 0.978 44.812 W2N2S1 y=79.589x/(41.701+x) 0.996 41.701 W2N0S1 y=81.574x/(48.302+x) 0.979 48.302 2020 W1N1S1 y=63.063x/(23.005+x) 0.989 23.005 W1N0S1 y=62.018x/(26.769+x) 0.992 26.769 W2N2S1 y=63.888x/(25.399+x) 0.979 25.399 W2N0S1 y=67.834x/(33.355+x) 0.992 33.355 各处理具体描述见表1。Km: 达到最大秸秆腐解率一半时所需天数。The detail information of each treatment is shown in Table 1. Km: days when half of the maximum straw decomposition rate is reached.
下载: 导出CSV
表 3 2019年和2020年秸秆还田下不同水氮耦合处理的水稻各生育期根际土壤微生物量碳、氮含量
Table 3. Changes of soil microbial biomass carbon and nitrogen contents in rice rhizosphere at different growth stages under different treatments of water-nitrogen coupling and straw returning in 2019 and 2020
年份
Year项目
Index处理
Treatment生长时期 Growth stage 移栽后10 d10 days after
transplanting分蘖盛期
Active tillering拔节期
Jointing拔节后10 d10 days after
jointing抽穗期
Heading成熟期
Maturitymg∙kg−1 2019 微生物量碳Microbial biomass
carbon contentW1N1S1 507.75±16.70a 458.17±26.19a 590.21±79.78a 664.49±51.96a 671.14±55.37a 569.03±22.84a W1N0S1 502.48±6.80a 443.38±6.20a 492.78±43.23ab 625.79±81.12ab 639.20±44.16a 562.55±10.86a W1N0S0 423.37±5.11b 429.75±25.87a 468.47±36.36ab 582.57±37.43ab 614.88±55.92a 553.78±16.54a W2N2S1 463.01±16.84ab 466.77±15.72a 552.83±30.07a 611.15±8.33ab 642.50±20.32a 561.14±67.74a W2N0S1 428.20±12.33b 439.49±57.04a 422.58±37.53b 605.44±12.18ab 590.46±43.95a 586.76±67.10a W2N0S0 422.30±46.97b 408.44±49.45a 418.73±27.44b 515.88±72.32b 544.53±62.99a 568.65±38.08a 微生物量氮Microbial biomass
nitrogen contentW1N1S1 19.70±2.30a 19.61±0.31ab 19.52±2.26ab 27.00±2.97a 24.67±0.29a 18.11±0.73a W1N0S1 15.74±1.69a 18.53±1.06ab 16.20±2.94b 17.86±1.67b 18.82±1.35b 17.15±0.03a W1N0S0 15.13±2.47a 15.16±2.40b 16.35±1.19b 15.67±2.96b 15.71±3.52b 16.32±0.88a W2N2S1 22.34±4.33a 22.76±2.09a 19.99±1.34ab 19.82±3.29ab 17.97±1.57b 16.71±1.20a W2N0S1 18.66±2.70a 20.83±3.15ab 19.08±1.77a 16.98±3.88b 15.78±0.28b 16.92±1.08a W2N0S0 16.18±2.83a 16.63±4.34ab 14.54±1.28b 12.80±2.03b 15.96±2.33b 13.78±0.07b 2020 微生物量碳Microbial biomass
carbon contentW1N1S1 1022.64±25.37a 1068.60±13.84a 1055.08±14.68a 919.01±35.99a 1017.27±43.20a 939.25±38.24a W1N0S1 879.67±28.21bc 987.08±40.90ab 914.29±38.26b 838.02±18.93abc 865.70±7.90b 730.86±8.04c W1N0S0 833.21±18.90c 877.55±29.96c 871.88±38.52bc 814.13±20.87bc 795.96±33.23bc 711.89±22.95c W2N2S1 937.14±25.33b 1013.50±19.45a 932.65±23.91b 879.28±42.33ab 856.33±25.53b 848.63±26.41b W2N0S1 820.45±35.56c 900.96±52.63bc 909.63±31.94bc 836.46±48.24abc 790.79±30.56bc 830.50±25.80b W2N0S0 742.78±24.24d 903.35±25.26bc 832.10±20.51c 772.39±21.87c 742.20±20.12c 756.27±29.23c 微生物量氮Microbial biomass
nitrogen contentW1N1S1 19.93±1.37a 22.37±1.18a 19.23±0.37a 20.78±0.59bc 21.65±0.84a 18.48±0.57a W1N0S1 19.36±1.04a 16.61±1.21b 17.78±0.62ab 22.56±0.78ab 17.72±0.34b 15.76±0.96b W1N0S0 19.73±0.38a 14.28±0.46c 16.52±0.36b 22.97±1.14a 18.14±0.43b 11.76±0.43c W2N2S1 19.05±0.48a 18.21±0.54b 18.77±0.08a 24.17±0.78a 21.30±0.36a 19.22±0.86a W2N0S1 15.61±0.51b 18.31±0.55b 14.27±0.83c 19.68±0.33c 18.01±0.73b 17.67±0.57a W2N0S0 14.50±0.45b 17.44±0.49b 14.72±0.92c 17.42±0.32d 15.71±0.80c 13.53±0.53c 各处理具体描述见表1。数值后不同小写字母代表同一年份同一项目不同处理间差异达P<0.05显著水平。The detail information of each treatment is shown in Table 1. Different lowercase letters after values in the same column for the same index in the same year mean significant differences among treatments at P<0.05 level.
下载: 导出CSV
表 4 2019年和2020年秸秆还田下不同水氮耦合处理的水稻各生育期单茎根长
Table 4. Changes of rice roots length per stem at different growth stages under different treatments of water-nitrogen coupling and straw returning in 2019 and 2020
年份
Year处理
Treatment生长时期 Growth stage 移栽后10 d 10 days after
transplanting分蘖盛期
Active tillering拔节期
Jointing拔节后10 d 10 days after
jointing抽穗期
Heading成熟期
Maturitym 2019 W1N1S1 0.62±0.04b 1.10±0.09c 2.85±0.17b 3.58±0.25ab 7.51±0.35ab 6.29±0.21b W1N0S1 0.68±0.03ab 1.56±0.03b 2.76±0.19bc 2.85±0.11c 6.78±0.25bc 5.76±0.41b W1N0S0 0.61±0.05b 1.77±0.06a 3.02±0.20b 3.05±0.31bc 7.10±0.55ab 6.57±0.45b W2N2S1 0.45±0.02c 1.10±0.04c 3.00±0.11b 3.60±0.33ab 5.81±0.39c 5.74±0.20b W2N0S1 0.67±0.03b 1.63±0.08ab 2.42±0.06c 3.01±0.02bc 7.06±0.31ab 6.54±0.50b W2N0S0 0.80±0.08a 1.79±0.09a 3.64±0.04a 3.88±0.19a 8.02±0.40a 7.82±0.40a 2020 W1N1S1 0.58±0.04cd 1.32±0.07c 4.06±0.17ab 6.13±0.26a 7.20±0.20b 6.26±0.37ab W1N0S1 0.68±0.03bc 1.52±0.05bc 3.61±0.13c 4.20±0.13cd 7.18±0.11b 6.24±0.35ab W1N0S0 0.57±0.04d 1.88±0.06a 4.18±0.10a 5.63±0.33ab 7.49±0.41b 6.32±0.09ab W2N2S1 0.42±0.01e 0.96±0.07d 2.35±0.09d 5.28±0.07b 6.65±0.34b 5.66±0.51b W2N0S1 0.72±0.05b 1.54±0.13b 2.33±0.12d 3.78±0.28d 7.11±0.21b 6.36±0.40ab W2N0S0 0.86±0.05a 1.61±0.07b 3.77±0.17bc 4.40±0.19c 8.63±0.71a 7.08±0.42a 各处理具体描述见表1。数值后不同小写字母代表同一年份同一项目不同处理间差异达P<0.05显著水平。The detail information of each treatment is shown in Table 1. Different lowercase letters after values in the same column for the same index in the same year mean significant differences among treatments at P<0.05 level.
下载: 导出CSV
表 5 2019年和2020年秸秆还田下不同水氮耦合处理的水稻各生育期单茎根数
Table 5. Changes of rice roots number per stem at different growth stages under different treatments of water-nitrogen coupling and straw returning in 2019 and 2020
年份
Year处理
Treatment生长时期 Growth stage 移栽后10 d 10 days after
transplanting分蘖盛期
Active tillering拔节期
Jointing拔节后10 d 10 days after
jointing抽穗期
Heading成熟期
Maturity2019 W1N1S1 10.12±0.32b 15.40±1.02b 20.16±1.14ab 29.19±1.67a 55.08±2.38a 40.63±1.61a W1N0S1 10.61±0.32b 21.78±1.27a 17.01±0.82c 24.42±1.07c 50.36±1.83a 36.17±2.02ab W1N0S0 10.80±0.50b 24.23±1.85a 23.02±2.00a 22.62±1.62c 48.95±1.34a 37.48±1.60ab W2N2S1 8.59±0.21c 14.44±0.87b 18.29±1.13bc 28.35±2.03ab 50.82±1.79a 34.53±2.34b W2N0S1 14.03±0.58a 23.94±0.94a 18.58±0.67bc 25.08±1.03bc 53.71±2.68a 37.19±1.76ab W2N0S0 14.65±0.81a 24.77±2.43a 21.18±0.37ab 30.81±0.65a 53.38±3.65a 41.19±2.78a 2020 W1N1S1 9.75±0.42bc 19.82±1.08bc 25.91±0.59a 43.81±2.18a 60.87±2.55a 42.84±0.28a W1N0S1 11.17±0.45b 23.03±1.91ab 25.16±1.31a 25.05±1.27c 48.51±3.16b 39.40±2.18abc W1N0S0 11.19±0.53b 25.48±1.01a 25.17±1.37a 27.04±1.09c 51.56±3.33b 35.35±1.63c W2N2S1 8.58±0.08c 17.02±1.03c 18.96±1.11c 34.82±1.96b 51.48±2.09b 39.10±1.42abc W2N0S1 13.87±1.58a 26.72±1.62a 21.97±0.53b 28.50±1.52c 46.46±4.41b 36.38±2.40bc W2N0S0 13.72±0.65a 25.61±2.64a 24.42±0.91ab 40.95±2.93a 49.35±2.7b 41.19±3.39ab 各处理具体描述见表1。数值后不同小写字母代表同一年份同一项目不同处理间差异达P<0.05显著水平。The detail information of each treatment is shown in Table 1. Different lowercase letters after values in the same column for the same index in the same year mean significant differences among treatments at P<0.05 level.
下载: 导出CSV
表 6 2019年和2020年秸秆还田下不同水氮耦合处理的水稻各生育期群体根长
Table 6. Changes of roots length of population of rice at different growth stages under different treatments of water-nitrogen coupling and straw returning in 2019 and 2020
年份
Year处理
Treatment生长时期 Growth stage 移栽后10 d 10 days after
transplanting分蘖盛期
Active tillering拔节期
Jointing拔节后10 d 10 days after
jointing抽穗期
Heading成熟期
Maturity×106 m∙hm−2 2019 W1N1S1 0.46±0.02a 1.85±0.21a 5.94±0.35b 6.65±0.61b 12.14±0.89a 11.04±0.89a W1N0S1 0.36±0.01c 1.27±0.04b 3.57±0.26c 3.31±0.21d 7.93±0.42c 7.22±0.23cd W1N0S0 0.21±0.01d 2.11±0.12a 5.34±0.38b 4.66±0.24c 9.64±0.56b 8.07±0.51bc W2N2S1 0.40±0.01b 2.09±0.04a 6.99±0.37a 7.94±0.38a 11.85±0.38a 9.72±0.65ab W2N0S1 0.19±0.02d 1.33±0.06b 2.47±0.16d 4.15±0.11cd 8.76±0.28bc 8.11±0.49bc W2N0S0 0.22±0.01d 1.20±0.02b 3.50±0.22c 4.45±0.33c 8.11±0.26c 6.28±0.64d 2020 W1N1S1 0.41±0.02a 3.01±0.10a 7.13±0.30b 11.86±0.28b 14.17±1.46a 10.97±1.05a W1N0S1 0.27±0.02b 2.23±0.12b 5.57±0.22c 6.58±0.71cd 10.36±0.47c 8.44±0.89b W1N0S0 0.28±0.01b 2.45±0.13b 6.59±0.42b 7.67±0.55c 11.92±0.64bc 8.93±0.66b W2N2S1 0.27±0.02b 2.38±0.12b 11.76±0.38a 15.46±0.47a 12.83±0.48ab 11.75±0.67a W2N0S1 0.31±0.02b 2.16±0.12bc 4.81±0.25c 6.06±0.39d 10.52±0.32c 9.96±0.72ab W2N0S0 0.30±0.03b 1.86±0.16c 5.56±0.05c 6.23±0.19d 12.08±0.58bc 10.08±0.15ab 各处理具体描述见表1。数值后不同小写字母代表同一年份同一项目不同处理间差异达P<0.05显著水平。The detail information of each treatment is shown in Table 1. Different lowercase letters after values in the same column for the same index in the same year mean significant differences among treatments at P<0.05 level.
下载: 导出CSV
表 7 2019年和2020年秸秆还田下不同水氮耦合处理的水稻各生育时期群体根数
Table 7. Changes of roots number of population of rice at different growth stages under different treatments of water-nitrogen coupling and straw returning in 2019 and 2020
年份
Year处理
Treatment生长时期 Growth stage 移栽后10 d 10 days after
transplanting分蘖盛期
Active tillering拔节期
Jointing拔节后10 d 10 days after
jointing抽穗期
Heading成熟期
Maturity×106 roots∙hm−2 2019 W1N1S1 7.51±0.36a 25.82±3.12a 41.83±2.28a 54.31±2.91b 88.92±7.21b 71.08±5.69a W1N0S1 5.63±0.09b 17.71±0.64b 21.95±1.68b 28.25±1.96d 59.12±3.11d 45.41±1.47c W1N0S0 3.74±0.09d 28.86±1.64a 40.81±2.67a 34.43±1.81c 66.76±3.77c 45.89±2.88c W2N2S1 7.61±0.21a 27.33±0.65a 42.64±2.39a 62.47±2.03a 103.93±2.97a 58.69±3.87b W2N0S1 3.98±0.28c 19.58±0.90b 18.96±1.20b 34.49±0.84c 66.48±1.99c 46.08±2.84c W2N0S0 4.04±0.20c 16.54±0.31c 20.27±1.27b 35.38±2.48c 53.91±1.69d 32.99±3.75d 2020 W1N1S1 6.89±0.27a 45.41±1.46a 45.65±1.92b 84.85±1.91b 100.75±2.22a 75.15±7.06a W1N0S1 4.45±0.37c 33.82±1.95c 38.89±1.55c 39.37±4.70d 70.17±3.67c 53.12±5.88b W1N0S0 5.49±0.19bc 33.33±1.94c 39.87±3.55c 36.97±4.25d 81.94±4.57b 50.02±3.59b W2N2S1 5.53±0.34bc 42.27±2.14ab 74.61±2.52a 102.09±1.9a 105.41±3.85a 81.18±4.45a W2N0S1 5.95±0.49ab 37.44±2.19b 45.36±2.49b 45.55±3.13d 68.72±2.09c 56.85±3.95b W2N0S0 4.78±0.54c 29.63±2.55c 36.06±0.38c 58.23±1.92c 69.24±3.55c 58.36±0.84b 各处理具体描述见表1。数值后不同小写字母代表同一年份同一项目不同处理间差异达P<0.05显著水平。The detail information of each treatment is shown in Table 1. Different lowercase letters after values in the same column for the same index in the same year mean significant differences among treatments at P<0.05 level.
下载: 导出CSV
表 8 2019年和2020年秸秆还田下不同水氮耦合处理的水稻各生育时期群体根体积
Table 8. Changes of roots volume of population of rice at different growth stages under different treatments of water-nitrogen coupling and straw returning in 2019 and 2020
年份
Year处理
Treatment生长时期 Growth stage 移栽后10 d 10 days after
transplanting分蘖盛期
Active tillering拔节期
Jointing拔节后10 d 10 days after
jointing抽穗期
Heading成熟期
Maturitym3∙hm−2 2019 W1N1S1 0.10±0a 0.81±0.09a 5.97±0.36b 8.58±0.45b 7.56±0.24b 7.57±0.61a W1N0S1 0.04±0c 0.40±0.01c 3.61±0.26c 5.92±0.15d 7.35±0.28b 5.99±0.19b W1N0S0 0.03±0d 0.64±0.04b 5.38±0.39b 6.02±0.21cd 7.43±0.43b 5.85±0.37b W2N2S1 0.08±0b 0.60±0.01b 7.95±0.42a 10.22±0.3a 9.17±0.68a 8.53±0.57a W2N0S1 0.03±0d 0.38±0.02c 3.82±0.25c 6.30±0.08cd 7.28±0.23b 6.16±0.37b W2N0S0 0.03±0d 0.34±0.01c 4.12±0.25c 6.73±0.28c 7.10±0.23b 5.06±0.52b 2020 W1N1S1 0.09±0a 0.78±0.03a 6.95±0.29b 10.06±0.24b 9.43±0.39ab 7.53±0.72bc W1N0S1 0.04±0cd 0.60±0.03b 4.90±0.19c 6.24±0.68d 7.28±0.33c 7.00±0.74bc W1N0S0 0.03±0d 0.59±0.03b 5.39±0.34c 6.75±0.48d 8.21±0.44bc 6.48±0.48c W2N2S1 0.06±0b 0.54±0.03bc 10.03±0.32a 12.02±0.36a 10.69±1.11a 10.31±0.59a W2N0S1 0.05±0bc 0.50±0.03cd 3.32±0.17d 7.13±0.45cd 8.30±0.25bc 7.57±0.55bc W2N0S0 0.04±0cd 0.44±0.04d 4.96±0.05c 8.08±0.24c 8.01±0.38bc 8.12±0.12b 各处理具体描述见表1。数值后不同小写字母代表同一年份同一项目不同处理间差异达 P<0.05显著水平。The detail information of each treatment is shown in Table 1. Different lowercase letters after values in the same column for the same index in the same year mean significant differences among treatments at P<0.05 level.
下载: 导出CSV
表 9 2019年和2020年秸秆还田下不同水氮耦合处理的水稻各生育期群体根表面积
Table 9. Changes of roots surface area of population of rice at different growth stages under different treatments of water-nitrogen coupling and straw returning in 2019 and 2020
年份
Year处理
Treatment生长时期 Growth stage 移栽后10 d 10 days after
transplanting分蘖盛期
Active tillering拔节期
Jointing拔节后10 d 10 days after
jointing抽穗期
Heading成熟期
Maturitym2∙hm−2 2019 W1N1S1 6.64±0.31a 41.64±4.79a 144.55±8.60b 190.05±17.35b 311.32±10.00ab 293.35±23.54a W1N0S1 2.15±0.07d 23.84±0.80b 78.91±5.77e 94.27±6.04d 214.52±11.35d 215.00±6.87b W1N0S0 2.28±0.06d 38.91±2.26a 109.34±7.86c 145.37±7.54c 278.77±16.21bc 221.91±14.06b W2N2S1 5.14±0.15b 41.85±0.89a 215.06±11.27a 233.91±11.23a 347.36±25.59a 292.58±19.63a W2N0S1 2.27±0.19d 22.70±1.03b 86.62±5.70de 124.87±3.20c 265.82±8.45c 227.55±13.74b W2N0S0 2.86±0.14c 23.15±0.41b 100.40±6.17cd 136.93±10.11c 251.09±8.19cd 181.75±18.62b 2020 W1N1S1 6.34±0.25a 51.97±1.69a 233.86±9.87b 376.14±9.00b 386.35±15.80a 291.67±27.83b W1N0S1 3.58±0.28bc 38.53±2.15c 174.51±6.74d 213.95±15.31de 281.59±12.75b 251.37±26.55b W1N0S0 3.35±0.12c 40.67±2.20c 200.29±12.74c 218.89±23.67cd 303.90±16.33b 245.64±18.03b W2N2S1 4.11±0.25bc 46.99±1.91b 364.40±11.78a 452.74±13.66a 405.29±41.89a 353.82±20.19a W2N0S1 4.20±0.34b 30.68±2.70c 133.66±7.02e 174.01±5.25e 292.35±8.81b 279.40±20.14b W2N0S0 3.63±0.40bc 36.53±2.09bc 177.39±1.73cd 257.25±16.40c 274.41±13.06b 291.84±4.38b 各处理具体描述见表1。数值后不同小写字母代表同一年份同一项目不同处理间差异达P<0.05显著水平。The detail information of each treatment is shown in Table 1. Different lowercase letters after values in the same column for the same index in the same year mean significant differences among treatments at P<0.05 level.
下载: 导出CSV
表 10 2019年和2020年秸秆还田下不同水氮耦合处理的水稻群体根系伤流强度(y)随生长天数(x)变化的函数拟合
Table 10. Function fitting of root bleeding intensity of rice population (y) with growth days (x) under different treatments of water-nitrogen coupling and straw returning in 2019 and 2020
年份
Year处理
Treatment函数拟合
Function fitting决定系数
R2对称轴
AOS顶点值
V2019 W1N1S1 y=−0.2767x2+35.530x−304.41 0.954 x=64.2 y=836.16 W1N0S1 y=−0.1725x2+22.290x−222.12 0.937 x=64.6 y=497.94 W1N0S0 y=−0.1595x2+20.039x−135.51 0.959 x=62.8 y=493.90 W2N2S1 y=−0.2818x2+34.078x−226.76 0.976 x=60.5 y=803.50 W2N0S1 y=−0.1585x2+20.703x−216.18 0.893 x=65.3 y=459.87 W2N0S0 y=−0.1260x2+16.588x−166.75 0.931 x=65.8 y=379.21 2020 W1N1S1 y=−0.2762x2+33.177x−179.61 0.961 x=60.1 y=816.69 W1N0S1 y=−0.1585x2+19.148x−131.15 0.995 x=60.4 y=447.16 W1N0S0 y=−0.1599x2+19.335x−114.24 0.994 x=60.5 y=470.25 W2N2S1 y=−0.2366x2+27.266x−34.41 0.898 x=57.6 y=751.13 W2N0S1 y=−0.1544x2+18.197x−75.30 0.904 x=58.9 y=460.86 W2N0S0 y=−0.1572x2+19.159x−138.55 0.999 x=60.9 y=445.21 各处理具体描述见表1。AOS: 函数图像对称轴对应的x值; V: 函数图像顶点对应的y值。The detail information of each treatment is shown in Table 1. AOS: axis of symmetry; V: vertex.
下载: 导出CSV
-
[1] 陈达刚, 周新桥, 李丽君, 等. 华南主栽高产籼稻根系形态特征及其与产量构成的关系[J]. 作物学报, 2013, 39(10): 1899−1908 doi: 10.3724/SP.J.1006.2013.01899CHEN D G, ZHOU X Q, LI L J, et al. Relationship between root morphological characteristics and yield components of major commercial indica rice in South China[J]. Acta Agronomica Sinica, 2013, 39(10): 1899−1908 doi: 10.3724/SP.J.1006.2013.01899 [2] 严奉君, 孙永健, 马均, 等. 秸秆覆盖与氮肥运筹对杂交稻根系生长及氮素利用的影响[J]. 植物营养与肥料学报, 2015, 21(1): 23−35YAN F J, SUN Y J, MA J, et al. Effects of straw mulch and nitrogen management on root growth and nitrogen utilization characteristics of hybrid rice[J]. Journal of Plant Nutrition and Fertilizers, 2015, 21(1): 23−35 [3] LIN X Q, ZHOU W J, ZHU D F, et al. Nitrogen accumulation, remobilization and partitioning in rice (Oryza sativa L.) under an improved irrigation practice[J]. Field Crops Research, 2006, 96(2/3): 448−454 [4] 徐国伟, 王贺正, 翟志华, 等. 不同水氮耦合对水稻根系形态生理、产量与氮素利用的影响[J]. 农业工程学报, 2015, 31(10): 132−141 doi: 10.11975/j.issn.1002-6819.2015.10.018XU G W, WANG H Z, ZHAI Z H, et al. Effect of water and nitrogen coupling on root morphology and physiology, yield and nutrition utilization for rice[J]. Transactions of the Chinese Society of Agricultural Engineering, 2015, 31(10): 132−141 doi: 10.11975/j.issn.1002-6819.2015.10.018 [5] 戢林, 李廷轩, 张锡洲, 等. 氮高效利用基因型水稻根系形态和活力特征[J]. 中国农业科学, 2012, 45(23): 4770−4781 doi: 10.3864/j.issn.0578-1752.2012.23.003JI L, LI T X, ZHANG X Z, et al. Root morphological and activity characteristics of rice genotype with high nitrogen utilization efficiency[J]. Scientia Agricultura Sinica, 2012, 45(23): 4770−4781 doi: 10.3864/j.issn.0578-1752.2012.23.003 [6] WANG H, SIOPONGCO J, WADE L J, et al. Fractal analysis on root systems of rice plants in response to drought stress[J]. Environmental and Experimental Botany, 2009, 65(2/3): 338−344 [7] TURMEL M S, SPERATTI A, BAUDRON F, et al. Crop residue management and soil health: a systems analysis[J]. Agricultural Systems, 2015, 134: 6−16 doi: 10.1016/j.agsy.2014.05.009 [8] 潘剑玲, 代万安, 尚占环, 等. 秸秆还田对土壤有机质和氮素有效性影响及机制研究进展[J]. 中国生态农业学报, 2013, 21(5): 526−535 doi: 10.3724/SP.J.1011.2013.00526PAN J L, DAI W A, SHANG Z H, et al. Review of research progress on the influence and mechanism of field straw residue incorporation on soil organic matter and nitrogen availability[J]. Chinese Journal of Eco-Agriculture, 2013, 21(5): 526−535 doi: 10.3724/SP.J.1011.2013.00526 [9] XU Y Z, NIE L X, BURESH R J, et al. Agronomic performance of late-season rice under different tillage, straw, and nitrogen management[J]. Field Crops Research, 2010, 115(1): 79−84 doi: 10.1016/j.fcr.2009.10.005 [10] 曾莉, 张鑫, 张水清, 等. 不同施氮量下潮土中小麦秸秆腐解特性及其养分释放和结构变化特征[J]. 植物营养与肥料学报, 2020, 26(9): 1565−1577 doi: 10.11674/zwyf.20181ZENG L, ZHANG X, ZHANG S Q, et al. Characteristics of decomposition, nutrient release and structure change of wheat straw in a fluvo-aquic soil under different nitrogen application rates[J]. Journal of Plant Nutrition and Fertilizers, 2020, 26(9): 1565−1577 doi: 10.11674/zwyf.20181 [11] POWELL J R, LEVY-BOOTH D J, GULDEN R H, et al. Effects of genetically modified, herbicide-tolerant crops and their management on soil food web properties and crop litter decomposition[J]. Journal of Applied Ecology, 2009, 46(2): 388−396 doi: 10.1111/j.1365-2664.2009.01617.x [12] 黄晶, 段转宁, 马鹏, 等. 油菜·小麦秸秆在稻田土壤中腐解及养分释放特征[J]. 安徽农业科学, 2016, 44(18): 139−141 doi: 10.3969/j.issn.0517-6611.2016.18.045HUANG J, DUAN Z N, MA P, et al. Decomposition and nutrient release characteristics of rapeseed and wheat straws incorporated into paddy soil[J]. Journal of Anhui Agricultural Sciences, 2016, 44(18): 139−141 doi: 10.3969/j.issn.0517-6611.2016.18.045 [13] 黄菲, 刘言, 李继福, 等. 水旱轮作条件下还田秸秆腐解和养分释放特征研究[J]. 长江大学学报: 自科版, 2017, 14(18): 54−60, 5HUANG F, LIU Y, LI J F, et al. Characteristics of decomposing and nutrients releasing of crop straw under paddy-upland rotation[J]. Journal of Yangtze University: Natural Science Edition, 2017, 14(18): 54−60, 5 [14] CHRISTOPHER S F, LAL R. Nitrogen management affects carbon sequestration in North American cropland soils[J]. Critical Reviews in Plant Sciences, 2007, 26(1): 45−64 doi: 10.1080/07352680601174830 [15] 王红妮, 王学春, 赵长坤, 等. 油菜秸秆还田对水稻根系、分蘖和产量的影响[J]. 应用生态学报, 2019, 30(4): 1243−1252WANG H N, WANG X C, ZHAO C K, et al. Effects of oilseed rape straw incorporation on root, tiller and grain yield of rice[J]. Chinese Journal of Applied Ecology, 2019, 30(4): 1243−1252 [16] 吴林坤, 林向民, 林文雄. 根系分泌物介导下植物-土壤-微生物互作关系研究进展与展望[J]. 植物生态学报, 2014, 38(3): 298−310 doi: 10.3724/SP.J.1258.2014.00027WU L K, LIN X M, LIN W X. Advances and perspective in research on plant-soil-microbe interactions mediated by root exudates[J]. Chinese Journal of Plant Ecology, 2014, 38(3): 298−310 doi: 10.3724/SP.J.1258.2014.00027 [17] 单玉华, 蔡祖聪, 韩勇, 等. 淹水土壤有机酸积累与秸秆碳氮比及氮供应的关系[J]. 土壤学报, 2006, 43(6): 941−947 doi: 10.3321/j.issn:0564-3929.2006.06.009SHAN Y H, CAI Z C, HAN Y, et al. Accumulation of organic acids in relation to C∶N ratios of straws and N application in flooded soil[J]. Acta Pedologica Sinica, 2006, 43(6): 941−947 doi: 10.3321/j.issn:0564-3929.2006.06.009 [18] 贾伟, 周怀平, 解文艳, 等. 长期有机无机肥配施对褐土微生物生物量碳、氮及酶活性的影响[J]. 植物营养与肥料学报, 2008, 14(4): 700−705 doi: 10.11674/zwyf.2008.0413JIA W, ZHOU H P, XIE W Y, et al. Effects of long-term inorganic fertilizer combined with organic manure on microbial biomass C, N and enzyme activity in cinnamon soil[J]. Plant Nutrition and Fertilizer Science, 2008, 14(4): 700−705 doi: 10.11674/zwyf.2008.0413 [19] 刘建国, 卞新民, 李彦斌, 等. 长期连作和秸秆还田对棉田土壤生物活性的影响[J]. 应用生态学报, 2008, 19(5): 1027−1032LIU J G, BIAN X M, LI Y B, et al. Effects of long-term continuous cropping of cotton and returning cotton stalk into field on soil biological activities[J]. Chinese Journal of Applied Ecology, 2008, 19(5): 1027−1032 [20] 杨菲, 谢小立. 稻田干湿交替过程生理生态效应研究综述[J]. 杂交水稻, 2010, 25(5): 1−4, 8 doi: 10.3969/j.issn.1005-3956.2010.05.001YANG F, XIE X L. Research advances of ecological and physiological effects of alternate wetting and drying in paddy field[J]. Hybrid Rice, 2010, 25(5): 1−4, 8 doi: 10.3969/j.issn.1005-3956.2010.05.001 [21] DENEF K, SIX J, PAUSTIAN K, et al. Importance of macroaggregate dynamics in controlling soil carbon stabilization: short-term effects of physical disturbance induced by dry-wet cycles[J]. Soil Biology and Biochemistry, 2001, 33(15): 2145−2153 doi: 10.1016/S0038-0717(01)00153-5 [22] XU G W, LU D K, WANG H Z, et al. Morphological and physiological traits of rice roots and their relationships to yield and nitrogen utilization as influenced by irrigation regime and nitrogen rate[J]. Agricultural Water Management, 2018, 203: 385−394 doi: 10.1016/j.agwat.2018.02.033 [23] 徐国伟, 陆大克, 王贺正, 等. 施氮和干湿灌溉对水稻抽穗期根系分泌有机酸的影响[J]. 中国生态农业学报, 2018, 26(4): 516−525XU G W, LU D K, WANG H Z, et al. Coupling effect of alternate wetting and drying irrigation and nitrogen rate on organic acid in rice root secretion at heading stage[J]. Chinese Journal of Eco-Agriculture, 2018, 26(4): 516−525 [24] 常二华, 张慎凤, 王志琴, 等. 结实期氮磷营养水平对水稻根系和籽粒氨基酸含量的影响[J]. 作物学报, 2008, 34(4): 612−618 doi: 10.3321/j.issn:0496-3490.2008.04.012CHANG E H, ZHANG S F, WANG Z Q, et al. Effect of nitrogen and phosphorus on the amino acids in root exudates and grains of rice during grain filling[J]. Acta Agronomica Sinica, 2008, 34(4): 612−618 doi: 10.3321/j.issn:0496-3490.2008.04.012 -


 下载:
下载:


 点击查看大图

计量
- 文章访问数: 199
- HTML全文浏览量: 90
- PDF下载量: 50
- 被引次数: 0
