

Mapping soil available phosphorus of cultivated land in hilly region of southern China based on sparse samples
-
摘要: 绘制耕地表层土壤有效磷空间分布图对精准农业管理和土壤环境评估具有重要意义。目前土壤磷数字制图研究大多面向充足土壤样点的平坦地区, 基于稀疏样点的南方丘陵地区耕地土壤有效磷制图效果尚不清楚。本文以典型南方丘陵地区福建省建瓯市为研究对象, 基于96个稀疏土壤实测样点, 利用空间分辨率为10 m的Sentinel-2遥感影像获取的遥感变量, 联合气象变量和地形变量建立随机森林(Random Forest, RF)模型预测建瓯市耕地表层土壤(0~20 cm)有效磷含量, 并对比5种不同环境变量组合下的RF模型精度。结果表明, 加入遥感变量后, 地形、气象和pH组合的RF模型预测有效磷含量的精度显著提升[决定系数(R2)从0.36提升至0.59], 联合全部变量(遥感、地形、气象和土壤pH)的RF模型预测精度最佳。遥感变量、气象变量、地形变量和土壤pH分别可以解释土壤有效磷含量的22.87%、30.64%、30.38%和16.11%, 其中年均温、pH、地形湿度指数和高程是影响南方丘陵地区耕地土壤有效磷空间分布的主导因素。因此, 利用遥感、气象、地形和土壤pH组合的RF模型是样点数量有限情况下预测南方丘陵地区县市域耕地土壤有效磷含量的有效方法。Abstract: Spatial distribution mapping of topsoil available phosphorus content of cultivated land is essential for precise agricultural management and soil environmental assessment. Most research has focused on sufficient soil samples to map topsoil phosphorus content of cultivated land in flat areas. However, there are few studies on soil available phosphorus mapping based on sparse samples in the hilly areas of southern China. Jian’ou City was selected as the study area, which is a hilly area in southern China and has the largest cultivated land area among all county-level cities in Fujian Province. A total of 96 soil measurements, Sentinel-2 remote sensing data with a spatial resolution of 10 m, and climate and topographical variables were used to predict topsoil (0–20 cm) available phosphorus content. Random forest models with five combinations of environmental variables were constructed and their performance was compared for model prediction. Three assessment criteria, namely the coefficient of determination (R2), mean absolute error (MAE), and root mean square error (RMSE) were used to evaluate the performance of random forest models for five combinations of environmental variables. The results showed that the prediction accuracy of the random forest model using climate variables, topographic variables, and soil pH values significantly improved after adding remote sensing variables, with an R2 increase from 0.36 to 0.59 and an RMSE decrease of 20.34%. In addition, the random forest model using all variables (remote sensing, topography, climate, and soil pH) obtained the optimal performance (R2 = 0.59, MAE = 19.04 mg∙kg−1, RMSE = 25.26 mg∙kg−1) among five combinations of environmental variables. Therefore, remote sensing variables are of great value for the mapping of soil available phosphorus based on sparse samples, and we suggested that the use of remote sensing variables should be increased in future studies to improve prediction accuracy. Remote sensing variables, climate variables, topographic variables, and soil pH could explain 22.87%, 30.64%, 30.38%, and 16.11% of the topsoil available phosphorus content, respectively. Furthermore, the spatial distribution of soil available phosphorus content in the study area was found to be mainly affected by the mean annual temperature, soil pH, soil moisture index, and elevation. The spatial distribution maps of soil available phosphorus content by the five random forest models were similar. High values of topsoil available phosphorus content were distributed in the central and western regions, whereas low values were distributed in the eastern and southern regions. The spatial variation of the soil available phosphorus in the distribution map produced by the optimal random forest model with total environmental variables was the most precise. Therefore, a random forest model that uses all variables (i.e., soil pH, topographic, remote sensing, and climate) can be used as a robust method to resolve soil available phosphorus content mapping with sparse soil samples in the hilly regions of southern China. Thus, this research can provide some guidance for other researchers interested in mapping the soil available phosphorus content in the hilly regions of China.
-

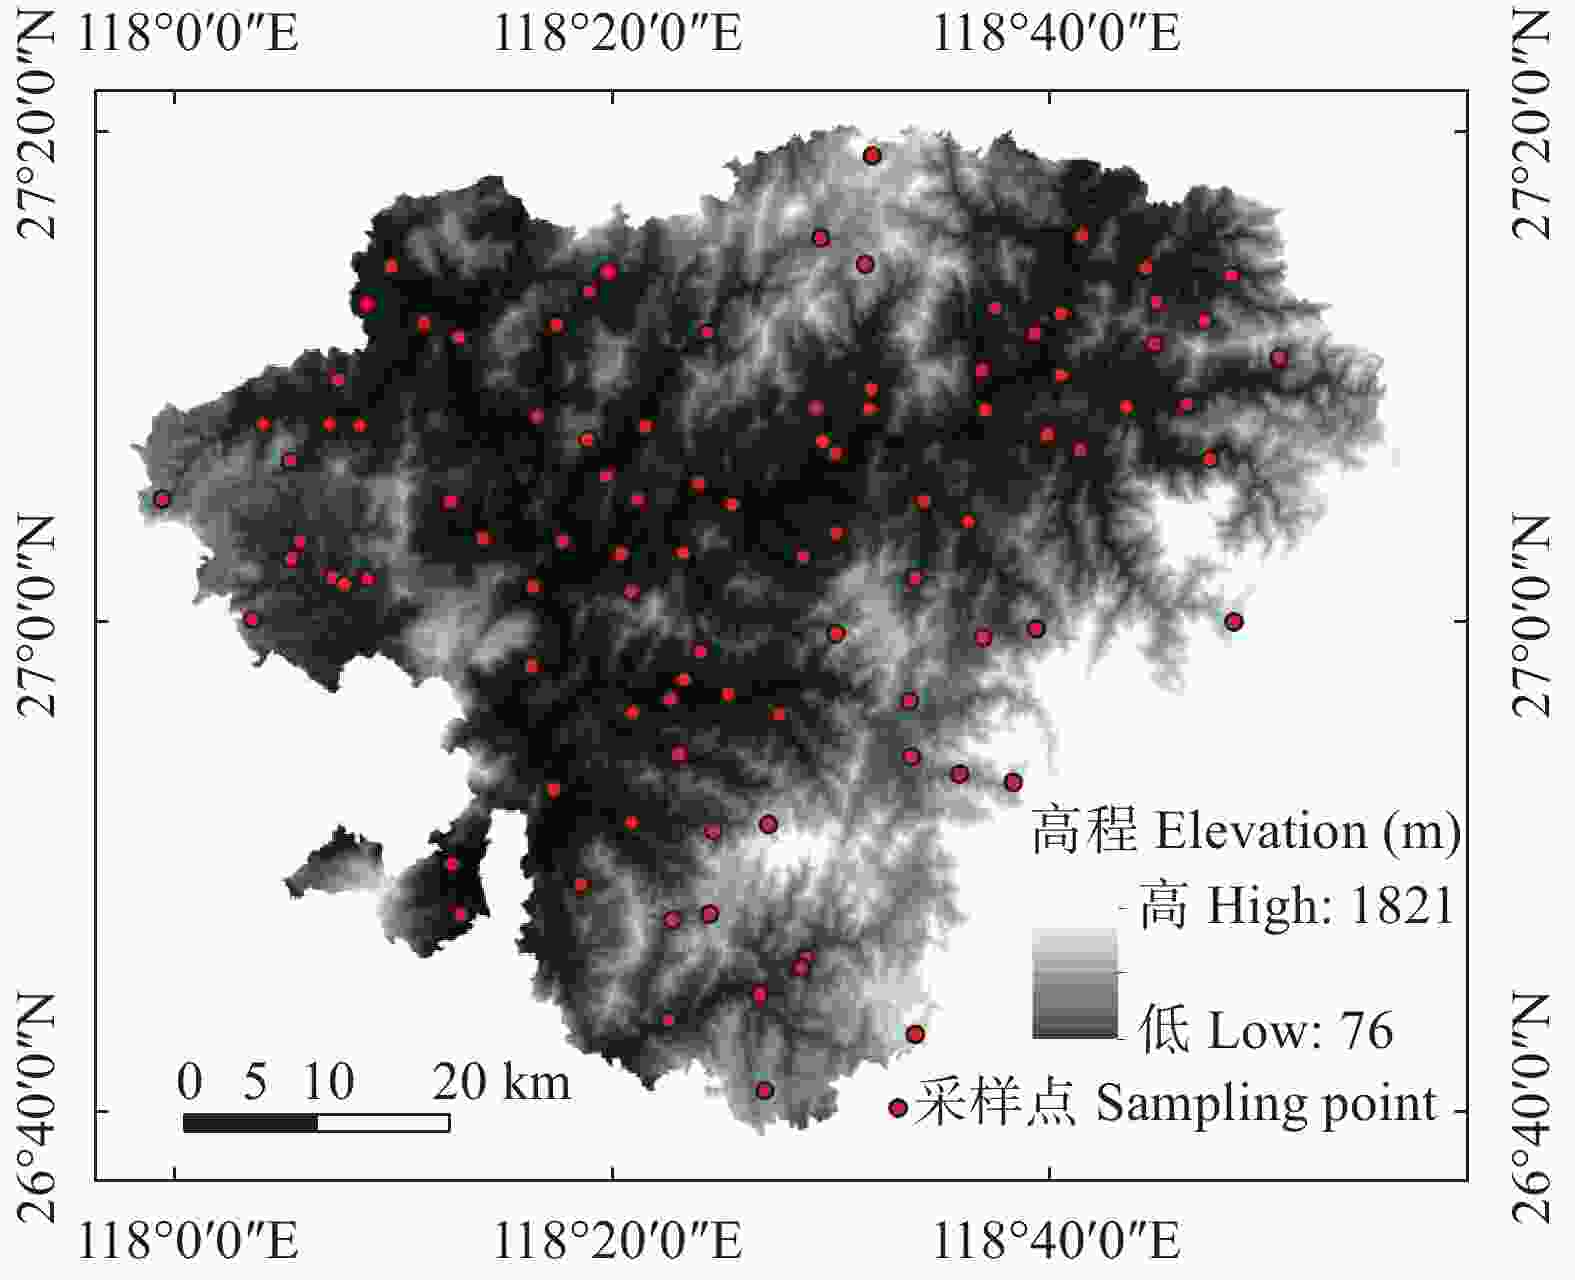
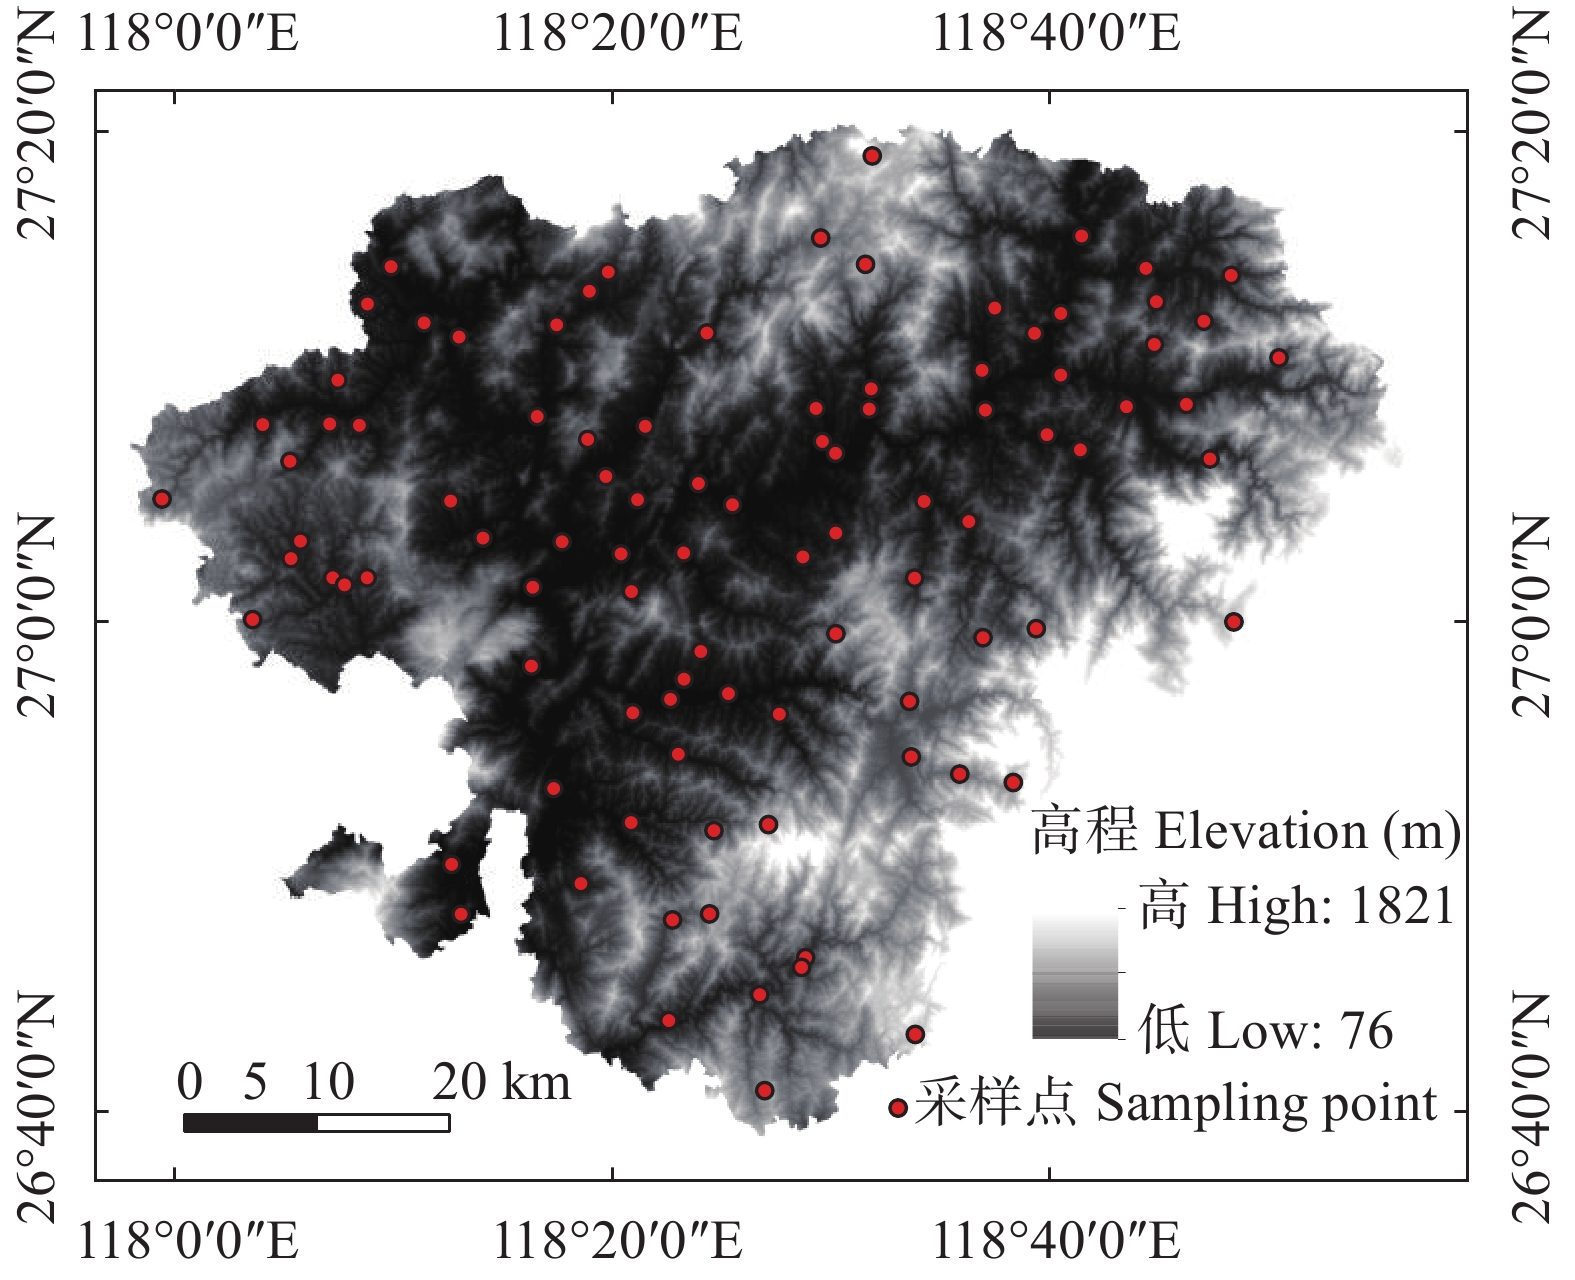
图 1 研究区范围及土壤采样点分布图
Figure 1. Map of the study area and soil sampling points distribution in the study area

图 2 建瓯市行政区划及耕地管理单元
Figure 2. Administrative division and cultivated land management unit of Jian’ou City, Fujian Province, China
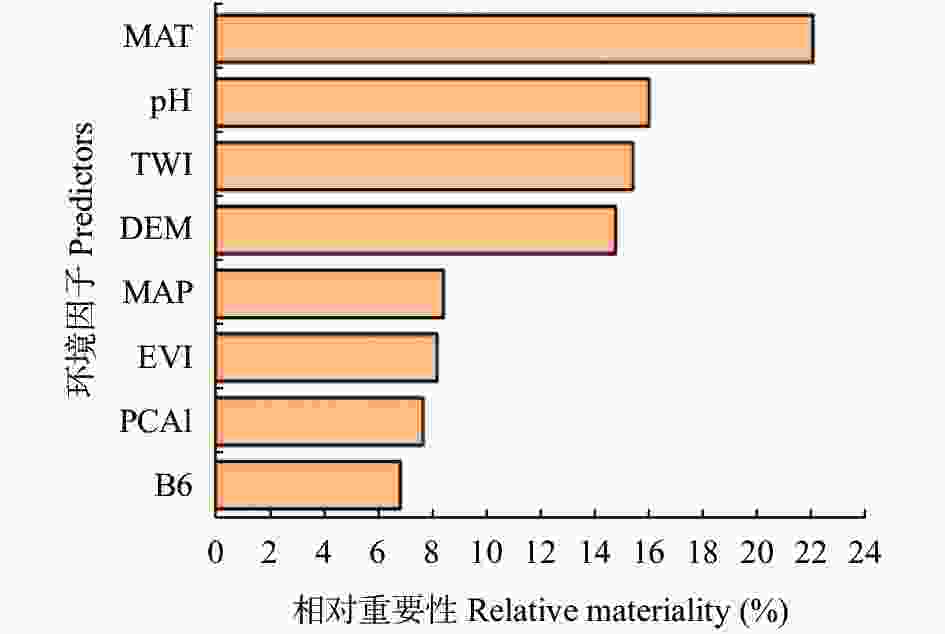
图 3 全部环境变量下环境因子对预测土壤有效磷空间分布的相对重要性
图中MAT为年平均气温, TWI为地形湿度指数, DEM为高程, MAP为年平均降水量, EVI为增强植被指数, PCA1为第一主成分, B6为红边波段(第6波段)。In the figure, MAT is mean annual temperature; TWI is topographic wetness index; DEM is digital elevation model; MAP is mean annual precipitation; EVI is enhanced vegetation index; PCA1 is first principal component; B6 is red edge (Band 6).
Figure 3. Relative importance of environmental factors for estimation of spatial distribution of soil available phosphorus content under total environmental variables
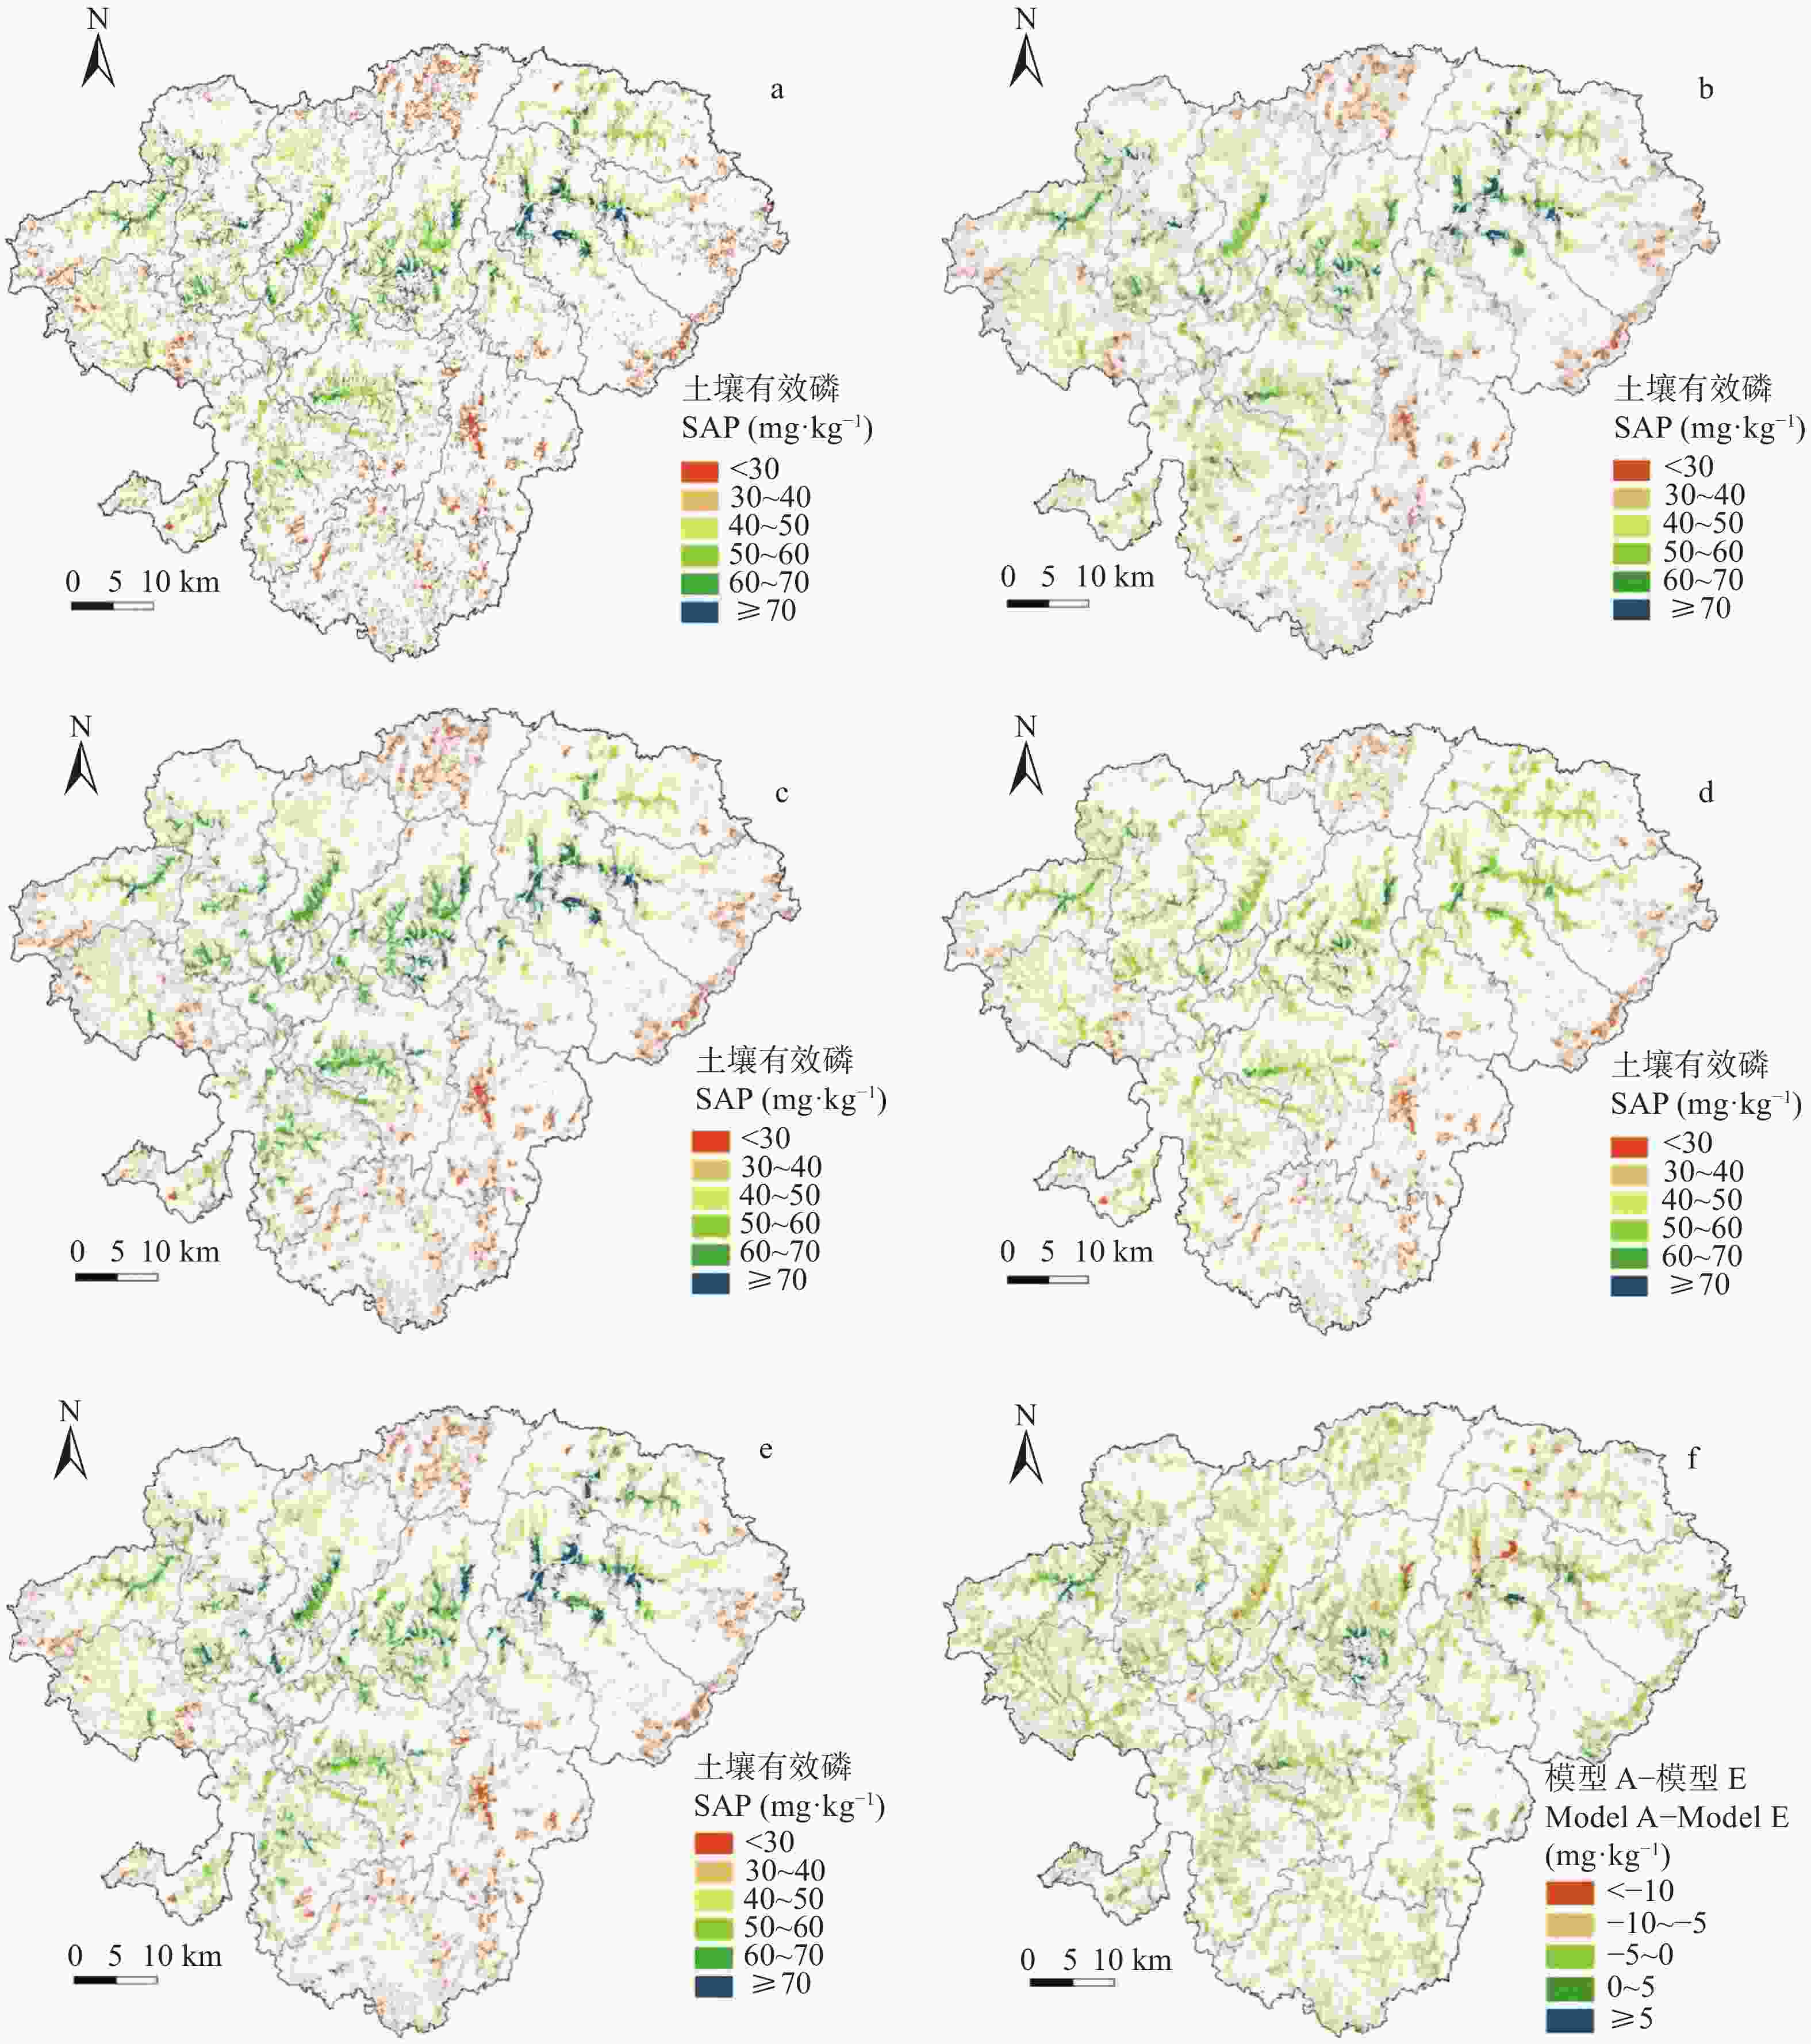
图 4 建瓯市耕地土壤有效磷含量空间分布预测图
图a、b、c、d和e分别为模型A、B、C、D和E的空间预测结果, 图f为模型A与模型E预测结果的差值。Fig. a, b, c, d and e are the prediction results of model A, model B, model C, model D and model E, respectively. Fig. f is the difference between the prediction results of model A and model E.
Figure 4. Prediction resultes of spatial distribution of soil available phosphorus (SAP) content of surface soil (0−20 cm) of cultivated land in Jian’ou City, Fujian Province, China
表 1 土壤有效磷建模辅助变量
Table 1. Auxiliary variables of soil available phosphorus modeling
变量类别
Category of variable指标
Index土壤属性
Soil attribute (P)pH 气象变量
Climate variables (C)年平均降水量
Mean annual precipitation (MAP)年平均气温
Mean annual temperature (MAT)地形变量
Topographical variables (T)数字高程模型
Digital elevation model (DEM)地形湿度指数
Topographic wetness index (TWI)遥感变量
Remote sensing variables (S)红边波段
Red edge (B6)增强植被指数
Enhanced vegetation index (EVI)第一主成分
First principal component (PCA1) 下载: 导出CSV
表 2 建瓯市耕地表层土壤(0~20 cm)有效磷含量统计分析
Table 2. Statistical analysis of available phosphorus content in surface soil (0−20 cm) of cultivated land in Jian’ou City, Fujian Province, China
样本组
Sample group样本数目
Number of samples最小值
Minimum (mg∙kg−1)最大值
Maximum (mg∙kg−1)平均值
Mean (mg∙kg−1)中间值
Median (mg∙kg−1)标准偏差
SD (mg∙kg−1)偏度
Skewness峰度
Kurtosis变异系数
CV (%)总样本
Total samples96 4.42 211.94 54.04 39.49 44.53 1.03 0.62 82.39 训练集
Calibration samples86 4.42 211.94 53.93 44.11 45.07 1.01 0.67 83.57 验证集
Validation samples10 23.98 134.72 55.06 36.72 41.80 1.48 0.68 75.92
下载: 导出CSV
表 3 建瓯市耕地表层土壤(0~20 cm)有效磷含量与环境因子的相关性分析
Table 3. Correlation analysis of available phosphorus content and environmental factors in surface soil (0−20 cm) of cultivated land in Jian’ou City, Fujian Province, China
变量
Variable土壤有效磷
Soil available phosphoruspH 高程
Digital elevation model (DEM)红边波段
Red edge (B6)增强植被指数
Enhanced vegetation index (EVI)地形湿度指数
Topographic wetness index (TWI)年均降水量
Mean annual precipitation (MAP)年均温
Mean annual temperature (MAT)第一主成分
First principal component (PCA1)土壤有效磷
Soil available phosphorus1.000 pH −0.268** 1.000 高程
Digital elevation model (DEM)−0.336** 0.043 1.000 红边波段
Red edge (B6)0.292** −0.149 −0.239* 1.000 增强植被指数
Enhanced vegetation index (EVI)0.252* −0.130 −0.148 0.785** 1.000 地形湿度指数
Topographic wetness index (TWI)−0.216* 0.056 −0.002 −0.064 −0.128 1.000 年均降水量
Mean annual precipitation (MAP)−0.366** 0.028 0.835** −0.174 −0.060 0.002 1.000 年均温
Mean annual temperature (MAT)0.357** −0.066 −0.945** 0.240* 0.135 0.002 −0.871** 1.000 第一主成分
First principal component (PCA1)0.278** −0.041 −0.634** 0.325** −0.024 0.113 −0.612** 0.639** 1.000 *和**分别表示相关性达P<0.05和P<0.01显著水平。* and ** indicate significant relationship at P<0.05 and P<0.01 levels, respectively.
下载: 导出CSV
表 4 5种环境变量组合下表层土壤(0~20 cm)有效磷的随机森林预测结果
Table 4. Performance of random forest under five combinations of environmental variables for estimation of topsoil (0−20 cm) available phosphorus content
预测模型
Prediction model训练集 Calibration dataset 验证集 Validation dataset R2 MAE (mg∙kg−1) RMSE (mg∙kg−1) R2 MAE (mg∙kg−1) RMSE (mg∙kg−1) 模型A Model A 0.63 23.05 27.39 0.59 19.04 25.26 模型B Model B 0.56 24.39 29.64 0.51 23.06 27.63 模型C Model C 0.45 27.53 33.30 0.36 22.66 31.71 模型D Model D 0.43 28.23 33.89 0.48 22.27 28.57 模型E Model E 0.54 25.28 30.48 0.53 21.71 27.20 R2为决定系数; MAE为平均绝对误差; RMSE为均方根误差。模型A为土壤pH+地形变量+遥感变量+气象变量; 模型B为土壤pH+遥感变量+气象变量; 模型C为土壤pH+地形变量+气象变量; 模型D为土壤pH+地形变量+遥感变量; 模型E为地形变量+遥感变量+气象变量。R2 is the coefficient of determination; MAE is the mean absolute error; RMSE is the root mean square error. Model A is with soil pH, topographic variables, remote sensing variables, and climate variables as auxiliary variables; Model B is with soil pH, remote sensing variables and climate variables as auxiliary variables; Model C is with soil pH, topographic variables, and climate variables as auxiliary variables; Model D is with soil pH, topographic variables and remote sensing variables as auxiliary variables; Model E is with topographic variables, remote sensing variables and climate variables as auxiliary variables.
下载: 导出CSV
表 5 建瓯市耕地土壤有效磷含量空间分布面积及其比例统计
Table 5. Statistics of spatial distribution area and proportion of soil available phosphorus content of cultivated land in Jian’ou City, Fujian Province, China
土壤有效磷含量
Soil available phosphorus content (mg∙kg−1)耕地面积
Cultivated land area (hm2)面积比例
Area proportion (%)<30 10 978.8 27.13 30~40 5743.5 14.19 40~50 6168.8 15.24 50~60 7182.4 17.75 60~70 6702.2 16.56 ≥70 3695.0 9.13
下载: 导出CSV
表 6 按照建瓯市土壤有效磷含量的气象和地形变量统计
Table 6. Descriptive characteristics of topography and climate conditions described by soil available phosphorus content in Jian’ou City, Fujian Province, China
土壤有效磷含量
Soil available phosphorus content (mg∙kg−1)平均高程
Mean elevation (m)年均降水量
Mean annual precipitation (mm)年均温
Mean annual temperature (℃)<30 588 146 16.9 30~40 393 142 17.9 40~50 291 140 18.2 50~60 226 138 18.9 60~70 209 137 18.9 ≥70 210 137 18.9
下载: 导出CSV
-
[1] 詹秋丽, 张黎明, 周碧青, 等. 福建耕地土壤磷素富集空间差异及其影响因素[J]. 中国生态农业学报, 2018, 26(2): 274−283ZHAN Q L, ZHANG L M, ZHOU B Q, et al. Spatial variation in phosphorus accumulation and the driving factors in cultivated lands in Fujian Province[J]. Chinese Journal of Eco-Agriculture, 2018, 26(2): 274−283 [2] 王永壮, 陈欣, 史奕. 农田土壤中磷素有效性及影响因素[J]. 应用生态学报, 2013, 24(1): 260−268WANG Y Z, CHEN X, SHI Y. Phosphorus availability in cropland soils of China and related affecting factors[J]. Chinese Journal of Applied Ecology, 2013, 24(1): 260−268 [3] 王燕, 瞿明凯, 陈剑, 等. 基于GWRK的土壤有效磷空间预测及其超标风险评估[J]. 中国环境科学, 2019, 39(1): 249−256 doi: 10.3969/j.issn.1000-6923.2019.01.029WANG Y, QU M K, CHEN J, et al. Spatial prediction and standard-exceeding risk assessment of soil available phosphorus based on geographically weighted regression kriging[J]. China Environmental Science, 2019, 39(1): 249−256 doi: 10.3969/j.issn.1000-6923.2019.01.029 [4] FORKUOR G, HOUNKPATIN O K L, WELP G, et al. High resolution mapping of soil properties using remote sensing variables in south-western Burkina Faso: a comparison of machine learning and multiple linear regression models[J]. PLoS One, 2017, 12(1): e0170478 doi: 10.1371/journal.pone.0170478 [5] HENGL T, LEENAARS J G B, SHEPHERD K D, et al. Soil nutrient maps of Sub-Saharan Africa: assessment of soil nutrient content at 250 m spatial resolution using machine learning[J]. Nutrient Cycling in Agroecosystems, 2017, 109(1): 77−102 doi: 10.1007/s10705-017-9870-x [6] MCBRATNEY A B, MENDONÇA SANTOS M L, MINASNY B. On digital soil mapping[J]. Geoderma, 2003, 117(1/2): 3−52 [7] CAMBULE A H, ROSSITER D G, STOORVOGEL J J, et al. Soil organic carbon stocks in the Limpopo National Park, Mozambique: Amount, spatial distribution and uncertainty[J]. Geoderma, 2014, 213: 46−56 doi: 10.1016/j.geoderma.2013.07.015 [8] 庞龙辉, 刘峰, 赵霞, 等. 青海省表层土壤属性数字制图[J]. 土壤通报, 2019, 50(3): 505−513PANG L H, LIU F, ZHAO X, et al. Digital mapping of topsoil attributes in Qinghai Province[J]. Chinese Journal of Soil Science, 2019, 50(3): 505−513 [9] HENDERSON B L, BUI E N, MORAN C J, et al. Australia-wide predictions of soil properties using decision trees[J]. Geoderma, 2005, 124(3/4): 383−398 [10] 王茵茵, 齐雁冰, 陈洋, 等. 基于多分辨率遥感数据与随机森林算法的土壤有机质预测研究[J]. 土壤学报, 2016, 53(2): 342−354WANG Y Y, QI Y B, CHEN Y, et al. Prediction of soil organic matter based on multi-resolution remote sensing data and random forest algorithm[J]. Acta Pedologica Sinica, 2016, 53(2): 342−354 [11] XU Y M, SMITH S E, GRUNWALD S, et al. Estimating soil total nitrogen in smallholder farm settings using remote sensing spectral indices and regression kriging[J]. CATENA, 2018, 163: 111−122 doi: 10.1016/j.catena.2017.12.011 [12] 刘焕军, 张美薇, 杨昊轩, 等. 多光谱遥感结合随机森林算法反演耕作土壤有机质含量[J]. 农业工程学报, 2020, 36(10): 134−140 doi: 10.11975/j.issn.1002-6819.2020.10.016LIU H J, ZHANG M W, YANG H X, et al. Invertion of cultivated soil organic matter content combining multi-spectral remote sensing and random forest algorithm[J]. Transactions of the Chinese Society of Agricultural Engineering, 2020, 36(10): 134−140 doi: 10.11975/j.issn.1002-6819.2020.10.016 [13] 袁玉琦, 陈瀚阅, 张黎明, 等. 基于多变量与RF算法的耕地土壤有机碳空间预测研究−以福建亚热带复杂地貌区为例[J]. 土壤学报, 2021, 58(4): 887−899 doi: 10.11766/trxb202001140623YUAN Y Q, CHEN H Y, ZHANG L M, et al. Prediction of spatial distribution of soil organic carbon in farmland based on multi-variables and random forest algorithm — A case study of a subtropical complex geomorphic region in Fujian as an example[J]. Acta Pedologica Sinica, 2021, 58(4): 887−899 doi: 10.11766/trxb202001140623 [14] WANG S, GAO J H, ZHUANG Q L, et al. Multispectral remote sensing data are effective and robust in mapping regional forest soil organic carbon stocks in a northeast forest region in China[J]. Remote Sensing, 2020, 12(3): 393 doi: 10.3390/rs12030393 [15] 郭澎涛, 李茂芬, 罗微, 等. 基于多源环境变量和随机森林的橡胶园土壤全氮含量预测[J]. 农业工程学报, 2015, 31(5): 194−202 doi: 10.3969/j.issn.1002-6819.2015.05.028GUO P T, LI M F, LUO W, et al. Prediction of soil total nitrogen for rubber plantation at regional scale based on environmental variables and random forest approach[J]. Transactions of the Chinese Society of Agricultural Engineering, 2015, 31(5): 194−202 doi: 10.3969/j.issn.1002-6819.2015.05.028 [16] 张国平, 郭澎涛, 王正银, 等. 紫色土丘陵地区农田土壤养分空间分布预测[J]. 农业工程学报, 2013, 29(6): 113−120, 294ZHANG G P, GUO P T, WANG Z Y, et al. Prediction of spatial distribution of hilly farmland with purple soil nutrient[J]. Transactions of the Chinese Society of Agricultural Engineering, 2013, 29(6): 113−120, 294 [17] KESKIN H, GRUNWALD S, HARRIS W G. Digital mapping of soil carbon fractions with machine learning[J]. Geoderma, 2019, 339: 40−58 doi: 10.1016/j.geoderma.2018.12.037 [18] MOHAMED E S, BAROUDY A A E, EL-BESHBESHY T, et al. Vis-NIR spectroscopy and satellite Landsat-8 OLI data to map soil nutrients in arid conditions: a case study of the northwest coast of Egypt[J]. Remote Sensing, 2020, 12(22): 3716 doi: 10.3390/rs12223716 [19] SHEN Q S, WANG Y, WANG X R, et al. Comparing interpolation methods to predict soil total phosphorus in the Mollisol area of Northeast China[J]. CATENA, 2019, 174: 59−72 doi: 10.1016/j.catena.2018.10.052 [20] 朱阿兴, 杨琳, 樊乃卿, 等. 数字土壤制图研究综述与展望[J]. 地理科学进展, 2018, 37(1): 66−78 doi: 10.18306/dlkxjz.2018.01.008ZHU A X, YANG L, FAN N Q, et al. The review and outlook of digital soil mapping[J]. Progress in Geography, 2018, 37(1): 66−78 doi: 10.18306/dlkxjz.2018.01.008 [21] 刘明杰, 徐卓揆, 郜允兵, 等. 基于机器学习的稀疏样本下的土壤有机质估算方法[J]. 地球信息科学学报, 2020, 22(9): 1799−1813 doi: 10.12082/dqxxkx.2020.190441LIU M J, XU Z K, GAO Y B, et al. Estimating soil organic matter based on machine learning under sparse sample[J]. Journal of Geo-Information Science, 2020, 22(9): 1799−1813 doi: 10.12082/dqxxkx.2020.190441 [22] 杨其坡, 武伟, 刘洪斌. 基于地形因子和随机森林的丘陵区农田土壤有效铁空间分布预测[J]. 中国生态农业学报, 2018, 26(3): 422−431YANG Q P, WU W, LIU H B. Prediction of spatial distribution of soil available iron in a typical hilly farmland using terrain attributes and random forest model[J]. Chinese Journal of Eco-Agriculture, 2018, 26(3): 422−431 [23] 姜赛平, 张怀志, 张认连, 等. 基于三种空间预测模型的海南岛土壤有机质空间分布研究[J]. 土壤学报, 2018, 55(4): 1007−1017 doi: 10.11766/trxb201710240410JIANG S P, ZHANG H Z, ZHANG R L, et al. Research on spatial distribution of soil organic matter in Hainan Island based on three spatial prediction models[J]. Acta Pedologica Sinica, 2018, 55(4): 1007−1017 doi: 10.11766/trxb201710240410 [24] 福建省第二次全国农业普查领导小组办公室. 福建省第二次全国农业普查资料汇编——农业卷[M]. 北京: 中国统计出版社, 2010Fujian Second National Agricultural Census Leading Group Office of Fujian Province. Data Compilation of the Second National Agricultural Census in Fujian Province — Agricultural Volume[M]. Beijing: China Statistical Publishing House, 2010 [25] 建瓯市地方志编纂委员会. 建瓯年鉴—2018[M]. 福州: 福建省地图出版社, 2018Jian’ou City Local Chronicles Compilation Committee. Jian’ou Yearbook 2018[M]. Fuzhou: Fujian Province Cartographic Publishing House, 2018 [26] 王雪珊, 沈庆松, 高凤杰, 等. 黑土区小流域土壤速效磷空间分布模拟方法[J]. 水土保持研究, 2021, 28(2): 33−40WANG X S, SHEN Q S, GAO F J, et al. Comparing interpolation methods to predict the spatial distribution of soil available phosphorus in the mollisol watershed of northeast China[J]. Research of Soil and Water Conservation, 2021, 28(2): 33−40 [27] 张素梅, 王宗明, 张柏, 等. 利用地形和遥感数据预测土壤养分空间分布[J]. 农业工程学报, 2010, 26(5): 188−194ZHANG S M, WANG Z M, ZHANG B, et al. Prediction of spatial distribution of soil nutrients using terrain attributes and remote sensing data[J]. Transactions of the Chinese Society of Agricultural Engineering, 2010, 26(5): 188−194 [28] ZHANG Y, SUI B, SHEN H O, et al. Mapping stocks of soil total nitrogen using remote sensing data: a comparison of random forest models with different predictors[J]. Computers and Electronics in Agriculture, 2019, 160: 23−30 doi: 10.1016/j.compag.2019.03.015 [29] WANG C, CUI Y, MA Z W, et al. Simulating spatial variation of soil carbon content in the Yellow River Delta: comparative analysis of two artificial neural network models[J]. Wetlands, 2020, 40(2): 223−233 doi: 10.1007/s13157-019-01170-x [30] SONG Y Q, ZHAO X, SU H Y, et al. Predicting spatial variations in soil nutrients with hyperspectral remote sensing at regional scale[J]. Sensors, 2018, 18(9): 3086 doi: 10.3390/s18093086 [31] 冯文兰, 郑杰. 基于MODIS和NOAA数据尺度转换的若尔盖植被变化研究[J]. 水土保持研究, 2016, 23(3): 297−303FENG W L, ZHENG J. Analysis on vegetation change in zoige region by the scale transformation method based on MODIS and NOAA DATA[J]. Research of Soil and Water Conservation, 2016, 23(3): 297−303 [32] BREIMAN L. Random forests[J]. Machine Learning, 2001, 45(1): 5−32 doi: 10.1023/A:1010933404324 [33] 方匡南, 吴见彬, 朱建平, 等. 随机森林方法研究综述[J]. 统计与信息论坛, 2011, 26(3): 32−38 doi: 10.3969/j.issn.1007-3116.2011.03.006FANG K N, WU J B, ZHU J P, et al. A review of technologies on random forests[J]. Statistics & Information Forum, 2011, 26(3): 32−38 doi: 10.3969/j.issn.1007-3116.2011.03.006 [34] WANG S, JIN X X, ADHIKARI K, et al. Mapping total soil nitrogen from a site in northeastern China[J]. CATENA, 2018, 166: 134−146 doi: 10.1016/j.catena.2018.03.023 [35] 鲁如坤. 土壤磷素水平和水体环境保护[J]. 磷肥与复肥, 2003, 18(1): 4−8 doi: 10.3969/j.issn.1007-6220.2003.01.002LU R K. The phosphorus level of soil and environmental protection of water body[J]. Phosphate & Compound Fertilizer, 2003, 18(1): 4−8 doi: 10.3969/j.issn.1007-6220.2003.01.002 [36] GHOLIZADEH A, ŽIŽALA D, SABERIOON M, et al. Soil organic carbon and texture retrieving and mapping using proximal, airborne and Sentinel-2 spectral imaging[J]. Remote Sensing of Environment, 2018, 218: 89−103 doi: 10.1016/j.rse.2018.09.015 [37] 徐剑波, 宋立生, 夏振, 等. 基于GARBF神经网络的耕地土壤有效磷空间变异分析[J]. 农业工程学报, 2012, 28(16): 158−165 doi: 10.3969/j.issn.1002-6819.2012.16.025XU J B, SONG L S, XIA Z, et al. Spatial variability of available phosphorus for cultivated soil based on GARBF neural network[J]. Transactions of the Chinese Society of Agricultural Engineering, 2012, 28(16): 158−165 doi: 10.3969/j.issn.1002-6819.2012.16.025 [38] ZHOU T, GENG Y J, JI C, et al. Prediction of soil organic carbon and the C: N ratio on a national scale using machine learning and satellite data: a comparison between Sentinel-2, Sentinel-3 and Landsat-8 images[J]. Science of the Total Environment, 2021, 755: 142661 doi: 10.1016/j.scitotenv.2020.142661 [39] DE CARVALHO W Jr, CHAGAS C D S, LAGACHERIE P, et al. Evaluation of statistical and geostatistical models of digital soil properties mapping in tropical mountain regions[J]. Revista Brasileira De Ciência Do Solo, 2014, 38(3): 706−717 [40] MULDER V L, DE BRUIN S, SCHAEPMAN M E, et al. The use of remote sensing in soil and terrain mapping—A review[J]. Geoderma, 2011, 162(1/2): 1−19 [41] 杨之江, 陈效民, 景峰, 等. 基于GIS和地统计学的稻田土壤养分与重金属空间变异[J]. 应用生态学报, 2018, 29(6): 1893−1901YANG Z J, CHEN X M, JING F, et al. Spatial variability of nutrients and heavy metals in paddy field soils based on GIS and Geostatistics[J]. Chinese Journal of Applied Ecology, 2018, 29(6): 1893−1901 [42] 汪涛, 杨元合, 马文红. 中国土壤磷库的大小、分布及其影响因素[J]. 北京大学学报: 自然科学版, 2008, 44(6): 945−952WANG T, YANG Y H, MA W H. Storage, patterns and environmental controls of soil phosphorus in China[J]. Acta Scientiarum Naturalium Universitatis Pekinensis, 2008, 44(6): 945−952 [43] 杨秀清, 史婵, 王旭刚, 等. 关帝山云杉次生林土壤的空间异质性及其与地形相关性[J]. 中国水土保持科学, 2017, 15(4): 16−24YANG X Q, SHI C, WANG X G, et al. Spatial heterogeneity of soil in the secondary Picea forest of Guandi Mountain and its correlation with topography[J]. Science of Soil and Water Conservation, 2017, 15(4): 16−24 [44] KUMAR S, SINGH R P. Spatial distribution of soil nutrients in a watershed of Himalayan landscape using terrain attributes and geostatistical methods[J]. Environmental Earth Sciences, 2016, 75(6): 1−11 [45] 杨文, 周脚根, 焦军霞, 等. 亚热带丘陵小流域土壤有效磷空间变异与淋失风险研究[J]. 环境科学学报, 2015, 35(2): 541−549YANG W, ZHOU J G, JIAO J X, et al. Spatial variation and leaching risk of soil phosphorus in a small hilly watershed of the subtropical China[J]. Acta Scientiae Circumstantiae, 2015, 35(2): 541−549 -

 下载:
下载:


 点击查看大图

计量
- 文章访问数: 245
- HTML全文浏览量: 96
- PDF下载量: 40
- 被引次数: 0
