

Effect analysis of road structure on multidimensional fragmentation of cultivated land: A case study in the international metropolis of Shanghai City
-
摘要: 耕地细碎化是制约农业规模生产和农业现代化发展的重要因素, 现有研究表明耕地细碎化是一个多维问题, 系统研究区域耕地细碎化的空间分布和驱动因子对保护城郊优质农田和抑制城市扩张具有十分重要的意义。本文以国际大都市上海为例, 通过典型相关分析计算城市边缘区、乡村边缘区、乡村腹地道路结构对耕地多维细碎化的影响效应。结果表明: 1)上海市耕地多维细碎化程度呈现空间分异性, 耕地面积细碎化和分布细碎化主要发生在主城区附近, 而耕地形状细碎化主要发生在东南沿海地区。2)道路密度并不总与耕地细碎化程度呈正相关关系, 自城市边缘区到乡村边缘区再到城市郊区, 随着道路密度不断减少, 耕地面积和形状细碎化程度呈下降趋势, 但乡村边缘区耕地的分布细碎化程度较高。3)道路结构对耕地细碎化的影响强弱在城郊不同区域内存在差异: 在城市边缘区, 四级道路密度越大的区域, 耕地面积细碎化的程度越低; 在乡村边缘区, 三级道路密度越大的地方, 耕地分布细碎化程度越高; 在乡村腹地, 高速公路、一级道路和二级道路密度较小, 而三级道路和四级道路密度较大的区域, 耕地面积细碎化的程度越低, 形状细碎化的程度越高, 而在二级道路和三级道路密度越大, 四级道路密度越小的区域, 耕地分布细碎化的程度越高。这启示我们在规划道路的过程中, 需明晰区域耕地保护的重点, 结合区域特征考虑道路建设对不同维度耕地细碎化的潜在风险, 以减轻耕地保护的压力, 实现土地可持续利用。Abstract: Cultivated land fragmentation (CLF) is an important factor restricting agricultural scale production and modernization development. Recent studies have revealed that CLF is a multidimensional problem. A systematic study of the spatial distribution and driving factors of multidimensional cultivated land fragmentation (MCLF) has practical meaning for preserving high-quality farmland in suburbs and restraining urban land expansion. Taking the suburbs of the international metropolis of Shanghai City as an example, this article used canonical correlation analysis to calculate the effects of road structure on the MCLF in urban fringe, rural fringe and rural areas. The results showed that there was spatial heterogeneity in the degree of MCLF in the Shanghai suburbs in 2015. The size and distribution characteristics of CLF mainly occurred near the center of the main city, while the shape characteristics of CLF mainly occurred on the southeast coast. In addition, there was no positive correlation between road density and the degree of MCLF. Without the highest road density, the rural fringe had the highest level of distribution characteristics of CLF. Furthermore, the MCLF was affected by the road structure in heterogeneous zones. The higher density of the fourth-class road density represented a lower degree of the size characteristics of CLF in the urban fringe, and a higher density of the third-class road represented a higher degree of the distribution characteristics of CLF in the rural fringe. In rural areas, the area with a lower density of higher roads and a higher density of lower roads showed a lower CLF in terms of size characteristics and a higher CLF in terms of shape characteristics, while the area with a higher density of higher roads and a lower density of lower roads showed a higher CLF in terms of distribution characteristics. These discoveries enlightened us that to relieve the stress of cultivated land protection and achieve the goal of sustainable land use, we need to be explicit about the main challenges of regional cultivated land protection and consider the potential risks of road construction to the MCLF in the process of road planning and design.
-

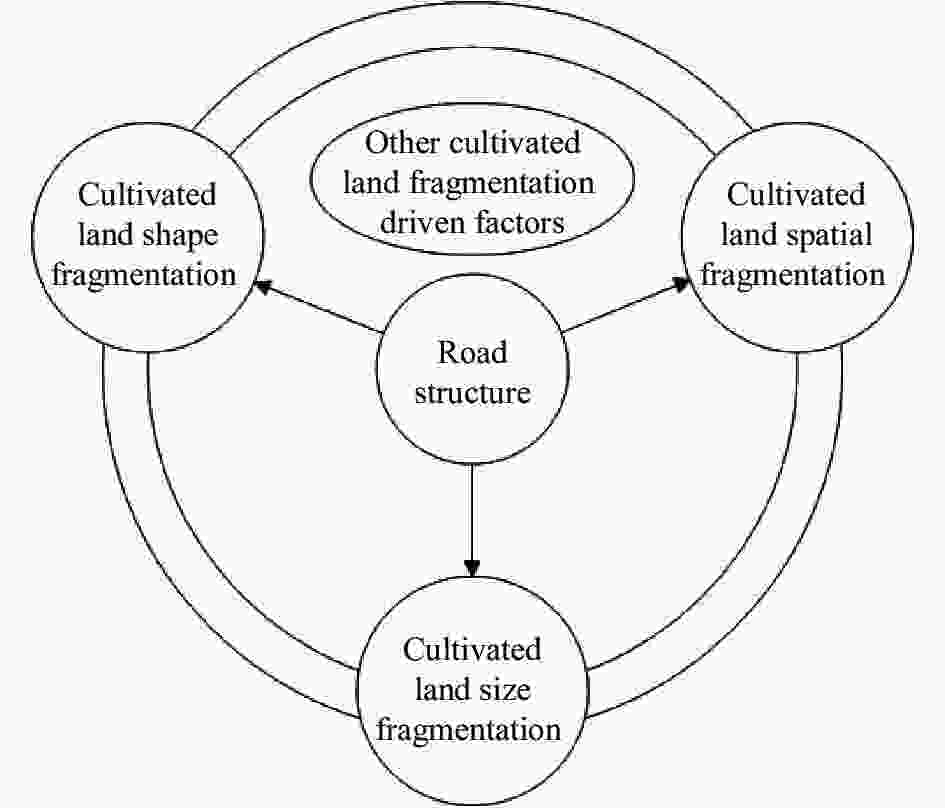
Figure 1. Analysis framework of the impact of road structure on multidimensional cultivated land fragmentation (MCLF)
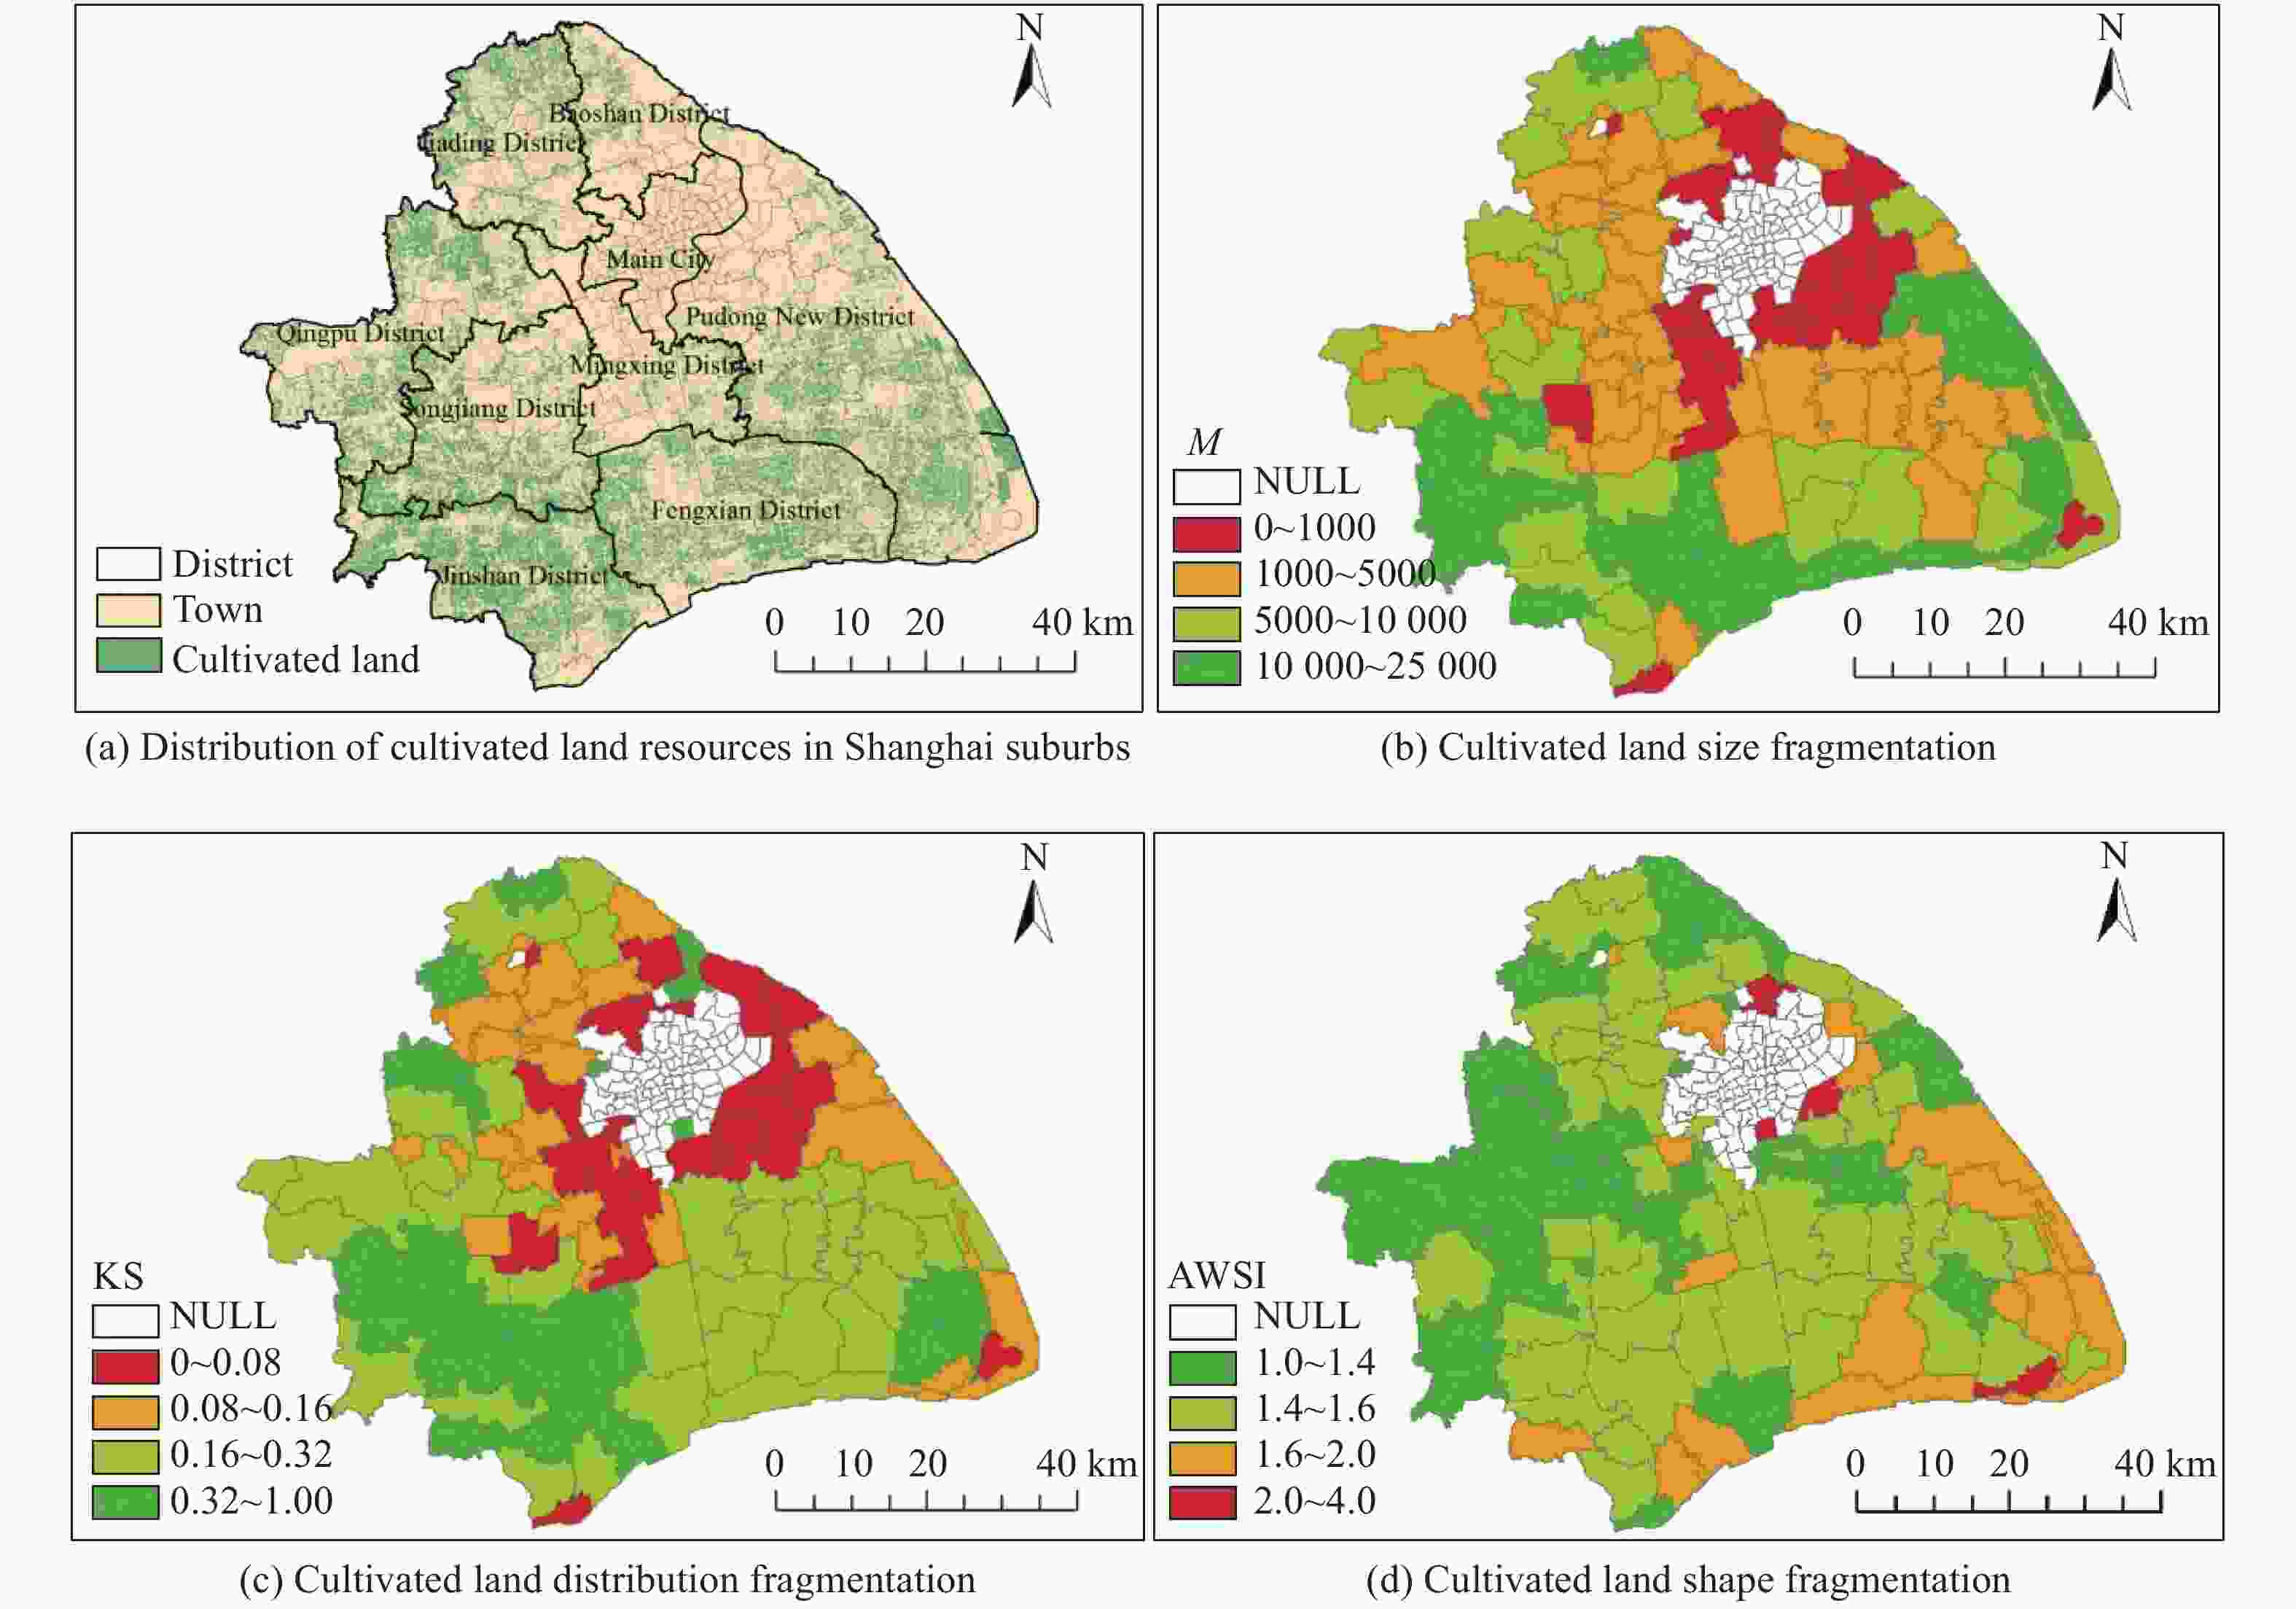
Figure 2. Cultivated land resources and distribution of multidimensional cultivated land fragmentation (MCLF) in the Shanghai suburbs
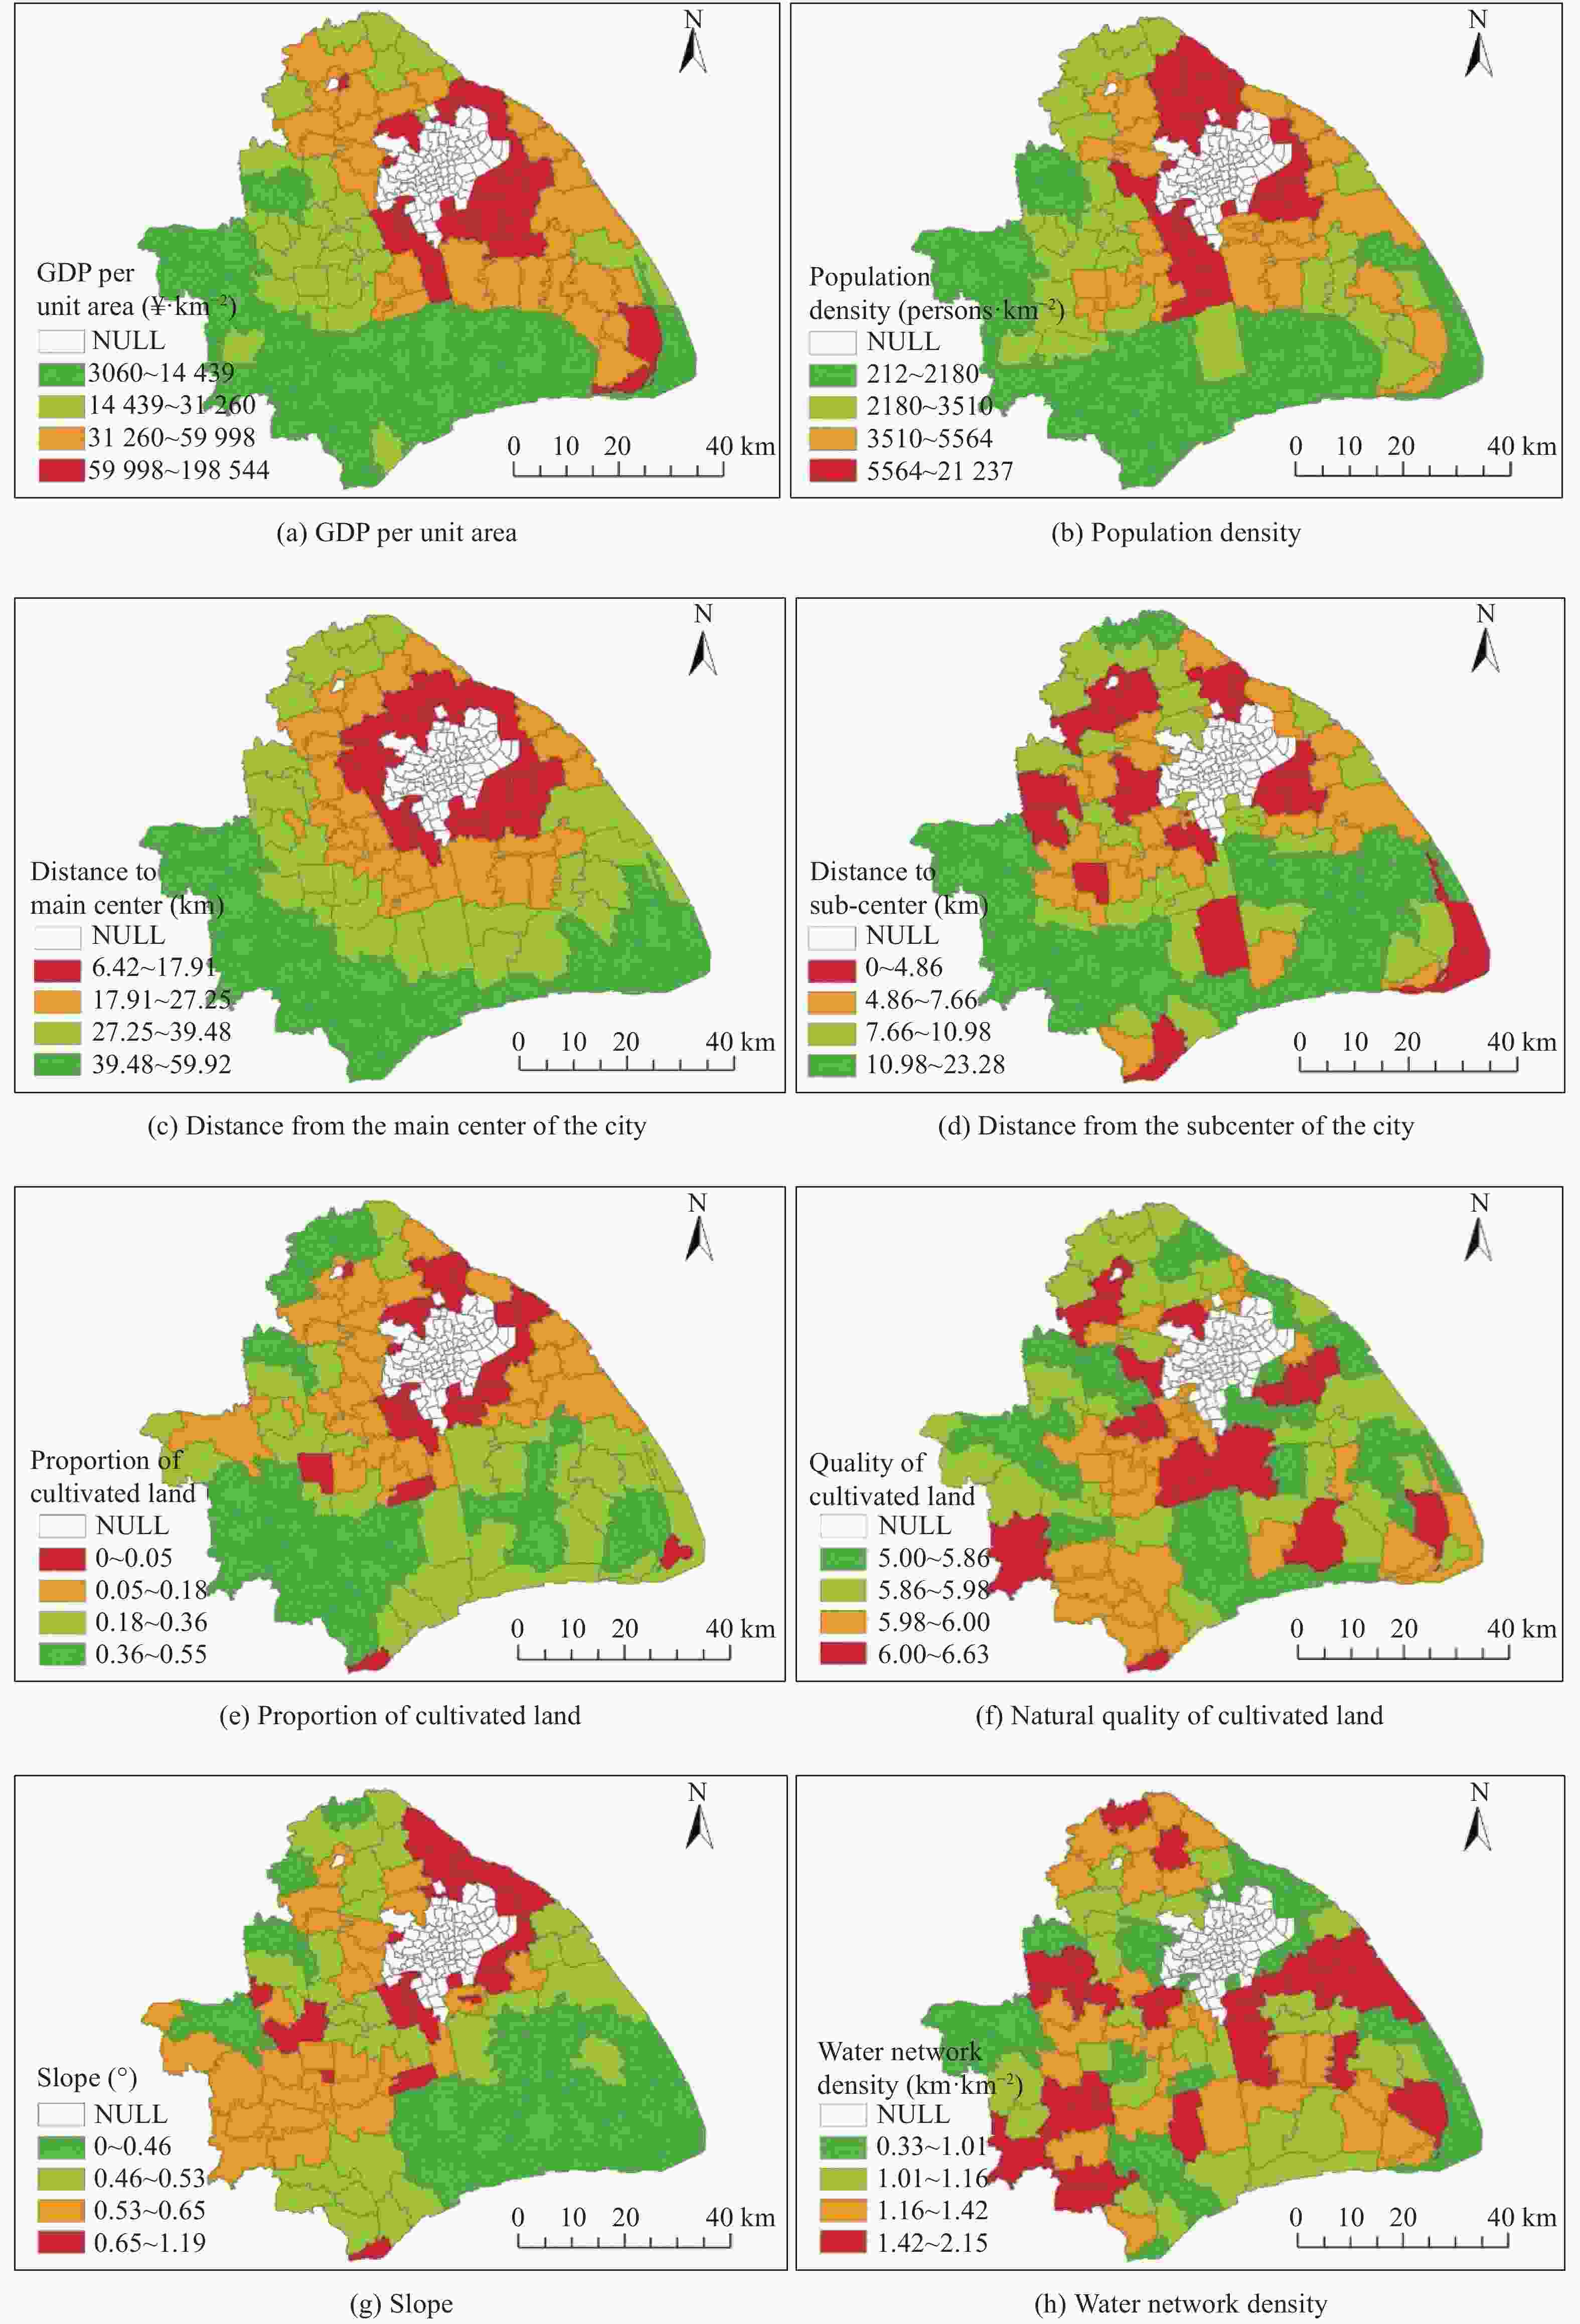
Figure 3. Calculation results of the main influencing factors of cultivated land fragmentation (CLF) in the Shanghai suburbs
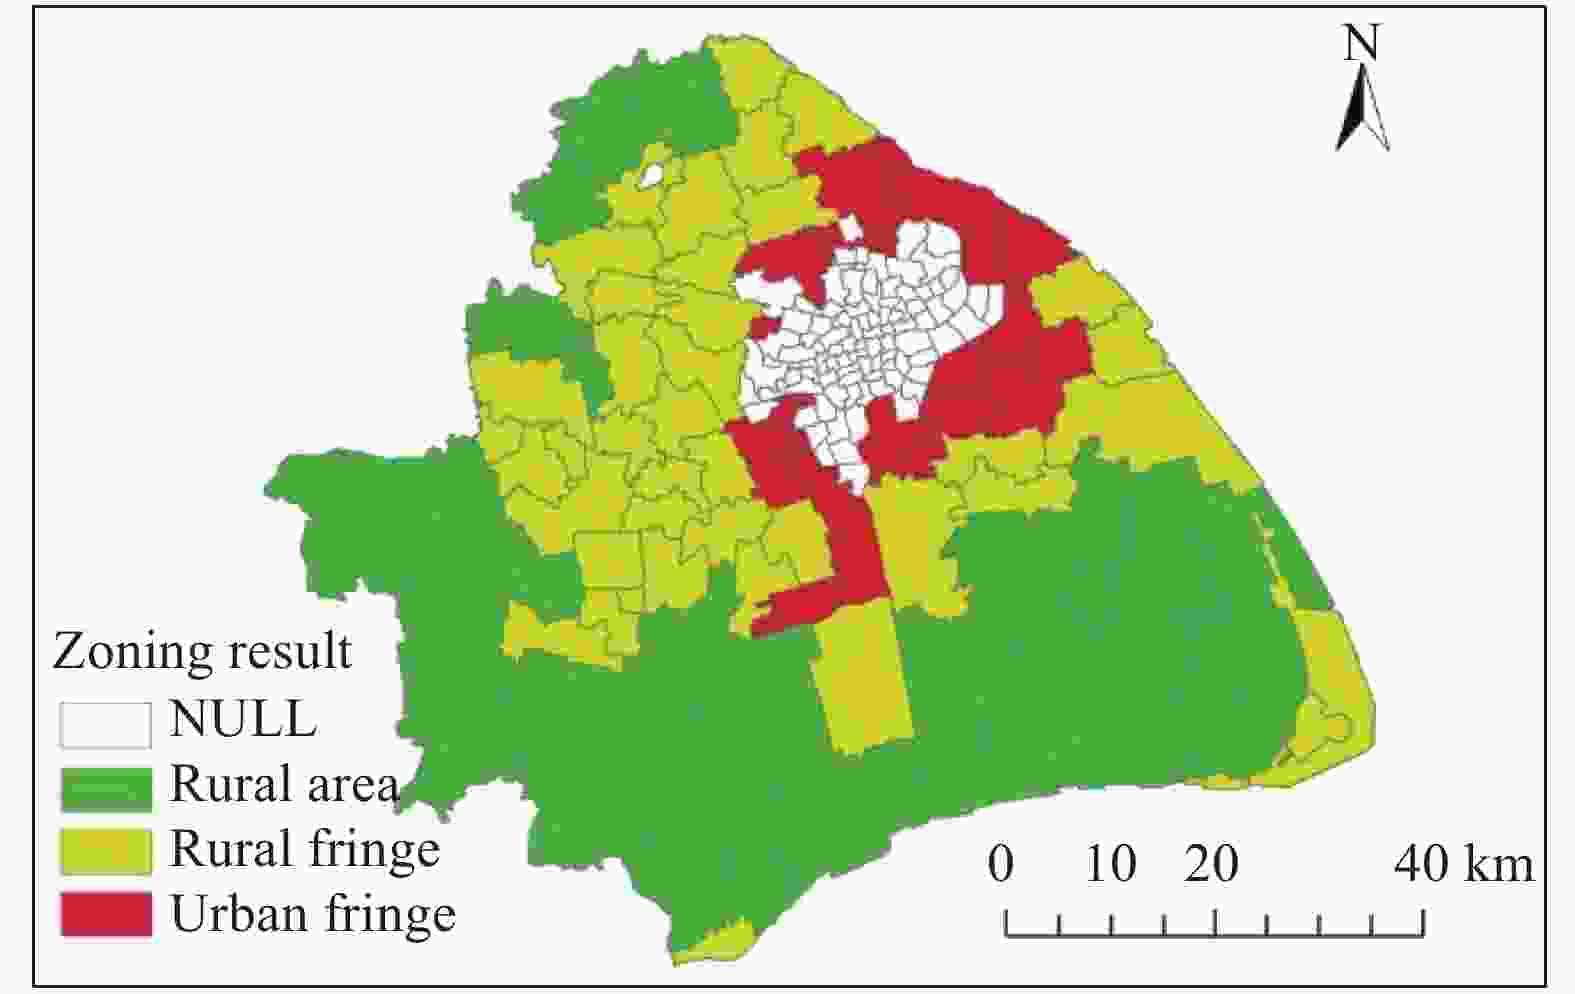
Figure 4. Zoning result of cultivated land fragmentation (CLF) in the Shanghai suburbs according to the main influencing factors
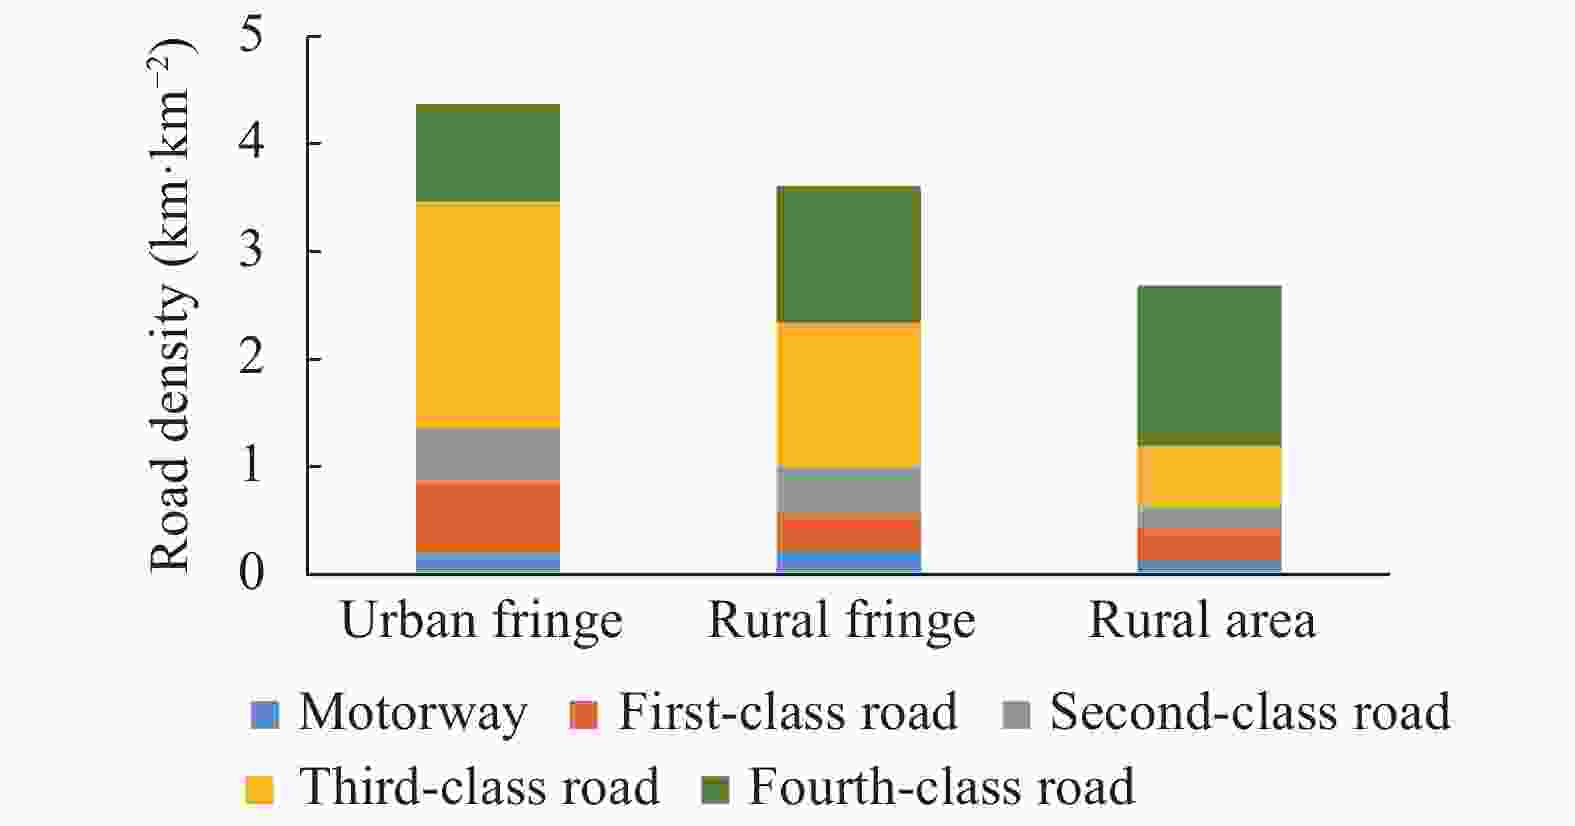
Figure 5. Road structure in different zones of cultivated land fragmentation (CLF) in the Shanghai suburbs
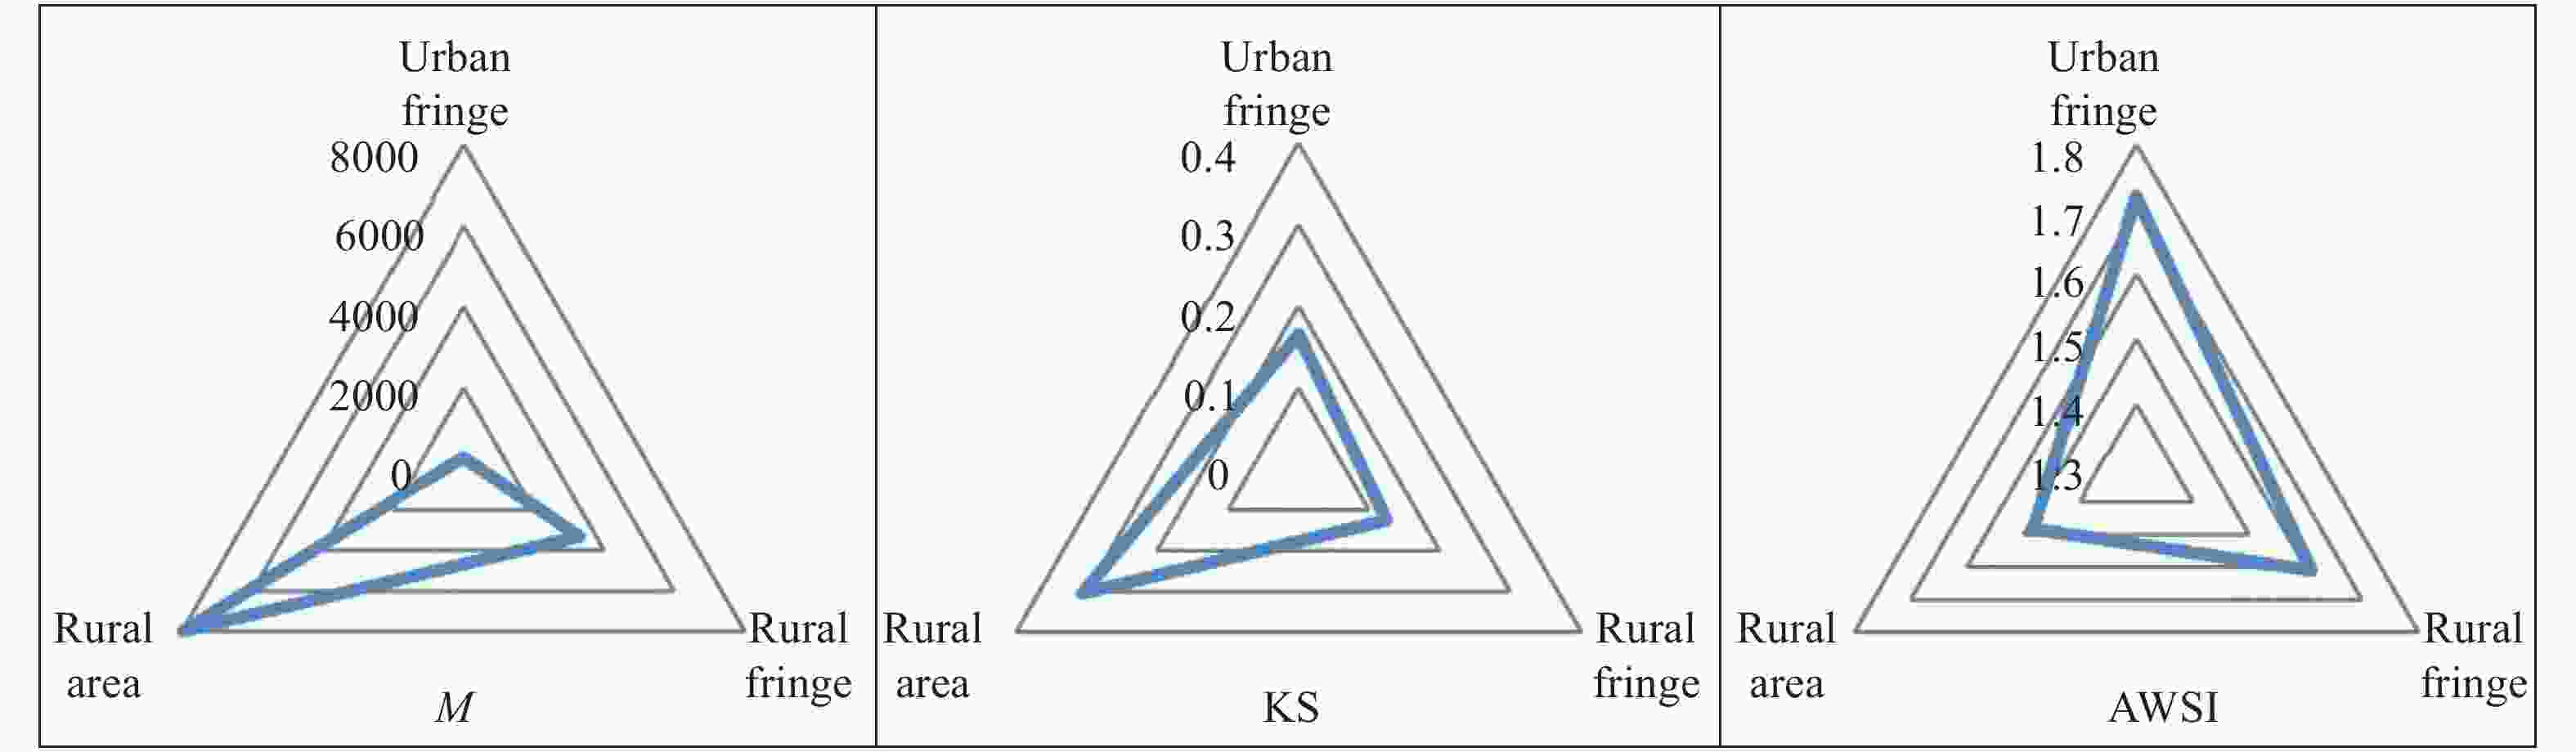
Figure 6. Indicators in different zones of cultivated land fragmentation (CLF) in the Shanghai suburbs
Table 1. Data sources and descriptions
Data name Data source Time series Resolution Land use/land cover data, road data Land use change survey database of Shanghai City 2015 1∶2000 Cultivated land quality data National survey of cultivated land quality database 2015 1∶10 000 DEM Geospatial data cloud 2015 30 m×30 m Socioeconomic data National platform for common geospatial information services 2015 1 km×1 km  下载: 导出CSV
Table 2. Indicators for assessing multidimensional cultivated land fragmentation (MCLF)
Characteristics of MCLF Indicator Qualification method Indicator description Size Effective mesh size (m2) $ {M}_{i}=\dfrac{\displaystyle\sum _{j=1}^{{n}_{i}}{A}_{ij}^{2}}{{A}_{i}} $ Describe average area of cultivated land in the perspective of probability Distribution Schmook index ${{\rm{KS}}}_{i}=\dfrac{\displaystyle\sum _{j=1}^{ {n}_{i} }{A}_{ij} }{ {A{\rm{c} } }_{i} }$ Calculate the dispersion through the ratio of the total area of parcels to the area of the convex hull circumscribing all parcels. Shape Area-weighted mean shape index ${ {\rm{AWSI} } }_{i}=\displaystyle\sum _{j=1}^{ {n}_{i} }\frac{ {A}_{ij} }{ {A}_{i} }\times \frac{0.25{P}_{ij} }{\sqrt{ {A}_{ij} } }$ Explain the regularity of the shape by comparing the difference with the square perimeter, and then use area weighting method to adjust the index In the table, $ {n}_{i} $ denotes the total number of parcels in town $ i $; $ {A}_{ij} $ denotes the area of parcel $ j $ in town $ i $; $ {A}_{i} $ denotes the land area of town $ i $; ${A{\rm{c}}}_{i}$ denotes the area of convex hull circumscribing all parcels in town $ i $; and $ {P}_{ij} $ denotes the perimeter of parcel $ j $ in town $ i $.
下载: 导出CSV
Table 3. Brief introduction of roads at all levels
Road level Road usage attributes Daily traffic volume Motorway Main roads, of particularly important political and economic significance with complete management and service facilities >25 000 First-class road Main roads, connecting important political, economic, or cultural centers 10 000−25 000 Second-class road Main roads, connecting political, economic centers or large industrial and mining areas, or suburban roads with heavy traffic 2000−10 000 Third-class road Branch roads, connecting cities at or above the county level 200−2000 Fourth-class road Branch roads, connecting counties, towns, and villages <200
下载: 导出CSV
Table 4. Main factors influencing cultivated land fragmentation (CLF)
Type Influential factor Factor description Relationship with CLF Human activities GDP per unit area (¥∙km−2) Reflecting the level of regional economic development With the enhancement of land transformation by human activities, more and more cultivated land will be occupied or divided due to social and economic development. Therefore, human activities will have negative impacts on CLF. Population density
(persons∙km−2)Reflecting the strength of demand for
landDistance from the main center of the city (km) Reflecting the possibility of nonagriculturalization of cultivated land Distance from the subcenter of the city (km) Reflecting the possibility of nonagriculturalization of cultivated land Natural conditions Proportion of cultivated land area to town area Reflecting limitation of natural resources to agricultural development The better the natural resource endowment is, the more suitable it is to develop agricultural production. When the agricultural production is more suitable and relatively improved, the possibility of CLF will be relatively low. Natural quality of cultivated land Reflecting output level of cultivated land Slope (°) Reflecting surface smoothness of cultivated land resources Water network density (km∙km−2) Reflecting the segmentation of water network on cultivated land patches
下载: 导出CSV
Table 5. Spatial differences in the multidimensional cultivated land fragmentation (MCLF) at the town level in the Shanghai suburbs
MCLF Size Distribution Shape Number of
townsCultivated land
proportion (%)Number of
townsCultivated land
proportion (%)Number of
townsCultivated land
proportion (%)Low 16 34.87 24 37.24 38 30.02 Relatively low 22 36.43 33 51.16 48 51.50 Relatively high 38 27.15 22 9.37 16 18.03 High 31 1.55 28 2.23 5 0.45
下载: 导出CSV
Table 6. Features of cultivated land in different zones of cultivated land fragmentation (CLF) in the Shanghai suburbs
Zone Urban fringe Rural fringe Rural area Numbers of towns 26 40 41 GDP per unit area of land (¥∙km−2) 92 815.90 31 325.64 23 939.81 Population density
(persons∙km−2)9254.11 3773.47 2206.25 Distance from the main center of the city (km) 14.02 27.88 41.20 Distance from the subcenter of the city (km) 5.53 6.28 12.35 Proportion of cultivated land area to town area (%) 1.94 14.38 38.17 Natural quality of cultivated land 5.82 5.94 5.88 Slope (º) 0.78 0.56 0.48 Water network density (km∙km−2) 1.01 1.25 1.25
下载: 导出CSV
Table 7. Canonical correlation and significance test
Zone type Canonical correlation 1 Canonical correlation 2 Canonical correlation 3 Canonical correlation Contribution (%) Canonical correlation Contribution (%) Canonical correlation Contribution (%) Urban fringe 0.7274** 70.71 0.5521 27.38 0.1944 2.45 Rural fringe 0.7441*** 76.96 0.4987 9.75 0.1969 2.50 Rural area 0.7590*** 68.39 0.5127** 17.94 0.4622** 13.67 ***, **, * denote significance levels of P<1%, P<5%, and P<10%, respectively.
下载: 导出CSV
Table 8. Standardized canonical coefficients for road structure
Road level Urban fringe Rural fringe Rural area Canonical correlation 1 Canonical correlation 1 Canonical correlation 1 Canonical correlation 2 Motorway 0.0812 0.2883 −0.4862 −0.0726 First-class road −0.1657 0.1360 −0.4649 0.3118 Second-class road 0.1674 −0.1358 −0.5199 0.5169 Third-class road −0.4322 −0.8819 0.7316 0.5968 Fourth-class road 0.7720 0.4373 0.4365 −0.4521
下载: 导出CSV
Table 9. Standardized canonical coefficients for MCLF
Cultivated land fragmentation Urban fringe Rural fringe Rural area Canonical correlation 1 Canonical correlation 1 Canonical correlation 1 Canonical correlation 2 Size fragmentation 0.8209 0.2323 0.6113 −0.158 Distribution fragmentation −0.0273 0.9188 0.1522 −0.7947 Shape fragmentation −0.4381 0.1480 0.5845 0.4248
下载: 导出CSV
-
[1] ALPHAN H. 2017. Analysis of road development and associated agricultural land use change[J]. Environmental Monitoring and Assessment, 190(1): 1−11 [2] ASSIS J C, GIACOMINI H C, RIBEIRO M C. 2019. Road Permeability Index: evaluating the heterogeneous permeability of roads for wildlife crossing[J]. Ecological Indicators, 99: 365−374 doi: 10.1016/j.ecolind.2018.12.012 [3] BIAN Z X, CHU Z M, ZHANG Y F, et al. 2022. The relationship between farmer’s cognitions, landscapes heterogeneity and surface arthropods: Based on the mediation effect model[J]. Chinese Journal of Eco-Agriculture, 30(2): 184–193 [4] BOVET J, REESE M, KÖCK W. 2018. Taming expansive land use dynamics — Sustainable land use regulation and urban sprawl in a comparative perspective[J]. Land Use Policy, 77: 837−845 doi: 10.1016/j.landusepol.2017.03.024 [5] BRUSCHI D, ASTIASO GARCIA D, GUGLIERMETTI F, et al. 2015. Characterizing the fragmentation level of Italian’s National Parks due to transportation infrastructures[J]. Transportation Research Part D: Transport and Environment, 36: 18−28 doi: 10.1016/j.trd.2015.02.006 [6] CHEN F, CHEN J, WU H, et al. 2016. A landscape shape index-based sampling approach for land cover accuracy assessment[J]. Science China Earth Sciences, 59(12): 2263−2274 doi: 10.1007/s11430-015-5280-5 [7] CIAIAN P, GURI F, RAJCANIOVA M, et al. 2018. Land fragmentation and production diversification: a case study from rural Albania[J]. Land Use Policy, 76: 589−599 doi: 10.1016/j.landusepol.2018.02.039 [8] DE VRIES W T. 2016. Post disaster consolidation of land, memory and identity[C]//FIG Working Week 2016. Recovery From Disaster. Christchurch, New Zealand, 1–12 [9] DEMETRIOU D, STILLWELL J, SEE L D. 2013. A new methodology for measuring land fragmentation[J]. Computers, Environment and Urban Systems, 39: 71−80 doi: 10.1016/j.compenvurbsys.2013.02.001 [10] DISSANAYAKE D M N J, ZHAI D L, DOSSA G G O, et al. 2019. Roads as drivers of above-ground biomass loss at tropical forest edges in Xishuangbanna, Southwest China[J]. Land Degradation & Development, 30(11): 1325−1335 [11] DU X D, ZHANG X K, JIN X B. 2018. Assessing the effectiveness of land consolidation for improving agricultural productivity in China[J]. Land Use Policy, 70: 360−367 doi: 10.1016/j.landusepol.2017.10.051 [12] FIEDEŃ Ł. 2019. Changes in land use in the communes crossed by the A4 motorway in Poland[J]. Land Use Policy, 85: 397−406 doi: 10.1016/j.landusepol.2019.04.025 [13] GOMES E, BANOS A, ABRANTES P, et al. 2019. Agricultural land fragmentation analysis in a peri-urban context: from the past into the future[J]. Ecological Indicators, 97: 380−388 doi: 10.1016/j.ecolind.2018.10.025 [14] HARTVIGSEN M. 2015. Experiences with Land Consolidation and Land Banking in Central and Eastern Europe after 1989[M]. Rome: Food and Agriculture Organization of the United Nations, 103–106 [15] HARTVIGSEN M. 2014. Land reform and land fragmentation in Central and Eastern Europe[J]. Land Use Policy, 36: 330−341 doi: 10.1016/j.landusepol.2013.08.016 [16] IBISCH P L, HOFFMANN M T, KREFT S, et al. 2016. A global map of roadless areas and their conservation status[J]. Science, 354(6318): 1423−1427 doi: 10.1126/science.aaf7166 [17] JAEGER J A G. 2000. Landscape division, splitting index, and effective mesh size: new measures of landscape fragmentation[J]. Landscape Ecology, 15(2): 115−130 doi: 10.1023/A:1008129329289 [18] JAEGER J A G, BERTILLER R, SCHWICK C, et al. 2008. Implementing landscape fragmentation as an indicator in the Swiss Monitoring System Of Sustainable Development (Monet)[J]. Journal of Environmental Management, 88(4): 737−751 doi: 10.1016/j.jenvman.2007.03.043 [19] JIANG P H, LI M C, LV J C. 2019. The causes of farmland landscape structural changes in different geographical environments[J]. The Science of the Total Environment, 685: 667−680 doi: 10.1016/j.scitotenv.2019.05.383 [20] KARLSON M, MÖRTBERG U. 2015. A spatial ecological assessment of fragmentation and disturbance effects of the Swedish road network[J]. Landscape and Urban Planning, 134: 53−65 doi: 10.1016/j.landurbplan.2014.10.009 [21] KEKEN Z, SEBKOVA M, SKALOS J. 2014. Analyzing land cover change — the impact of the motorway construction and their operation on landscape structure[J]. Journal of Geographic Information System, 6(5): 559−571 doi: 10.4236/jgis.2014.65046 [22] KING R, BURTON S. 1982. Land fragmentation: notes on a fundamental rural spatial problem[J]. Progress in Human Geography, 6(4): 475−494 doi: 10.1177/030913258200600401 [23] LATRUFFE L, PIET L. 2014. Does land fragmentation affect farm performance? A case study from Brittany, France[J]. Agricultural Systems, 129: 68−80 doi: 10.1016/j.agsy.2014.05.005 [24] LAURANCE W F. 2018. Conservation and the global infrastructure tsunami: disclose, debate, delay![J]. Trends in Ecology & Evolution, 33(8): 568−571 [25] LAURANCE W F, BALMFORD A. 2013. A global map for road building[J]. Nature, 495(7441): 308−309 doi: 10.1038/495308a [26] LAURANCE W F, ARREA I B. 2017. Roads to riches or ruin?[J]. Science, 358(6362): 442−444 doi: 10.1126/science.aao0312 [27] LAURANCE W F, CLEMENTS G R, SLOAN S, et al. 2014. A global strategy for road building[J]. Nature, 513(7517): 229−232 doi: 10.1038/nature13717 [28] LIU J, JIN X B, XU W Y, et al. 2019. Influential factors and classification of cultivated land fragmentation, and implications for future land consolidation: a case study of Jiangsu Province in Eastern China[J]. Land Use Policy, 88: 104185 doi: 10.1016/j.landusepol.2019.104185 [29] LIU S L, CUI B S, DONG S K, et al. 2008. Evaluating the influence of road networks on landscape and regional ecological risk — a case study in Lancang River Valley of Southwest China[J]. Ecological Engineering, 34(2): 91−99 doi: 10.1016/j.ecoleng.2008.07.006 [30] LOOGA J, JÜRGENSON E, SIKK K, et al. 2018. Land fragmentation and other determinants of agricultural farm productivity: the case of Estonia[J]. Land Use Policy, 79: 285−292 doi: 10.1016/j.landusepol.2018.08.021 [31] MANN D, ANEES M M, RANKAVAT S, et al. 2021. Spatio-temporal variations in landscape ecological risk related to road network in the Central Himalaya[J]. Human and Ecological Risk Assessment: an International Journal, 27(2): 289−306 doi: 10.1080/10807039.2019.1710693 [32] MCPHERSON M F. 1982. Land Fragmentation: A Selected Literature Review[M]. Harvard University: Harvard Institute for International Development, 85 [33] MEHDIPOUR N, FAKHERAN S, SOFFIANIAN A, et al. 2019. Road-induced fragmentation and the environmental value of roadless areas in a partly protected landscape in Central Iran[J]. Environmental Monitoring and Assessment, 191(7): 461 doi: 10.1007/s10661-019-7571-4 [34] MOSER B, JAEGER J A G, TAPPEINER U, et al. 2007. Modification of the effective mesh size for measuring landscape fragmentation to solve the boundary problem[J]. Landscape Ecology, 22(3): 447−459 doi: 10.1007/s10980-006-9023-0 [35] MOSER D, ZECHMEISTER H G, PLUTZAR C, et al. 2002. Landscape patch shape complexity as an effective measure for plant species richness in rural landscapes[J]. Landscape Ecology, 17(7): 657−669 doi: 10.1023/A:1021513729205 [36] NTIHINYURWA P D, DE VRIES W T, CHIGBU U E, et al. 2019. The positive impacts of farm land fragmentation in Rwanda[J]. Land Use Policy, 81: 565−581 doi: 10.1016/j.landusepol.2018.11.005 [37] PILI S, SERRA P, SALVATI L. 2019. Landscape and the city: Agro-forest systems, land fragmentation and the ecological network in Rome, Italy[J]. Urban Forestry & Urban Greening, 41: 230−237 [38] QI X X, DANG H P. 2018. Addressing the dual challenges of food security and environmental sustainability during rural livelihood transitions in China[J]. Land Use Policy, 77: 199−208 doi: 10.1016/j.landusepol.2018.05.047 [39] SCHMOOK G. 1976. The spontaneous evolution from farming on scattered strips to farming in severalty in Flanders between the sixteenth and twentieth centuries: A quantitative approach to the study of farm fragmentation[C]//Fields, Farms and Settlement in Europe. Belfast: Ulster Folk and Transport Museum, 107−117 [40] SUNDQVIST P, LISA A. 2006. A study of the impacts of land fragmentation on agricultural productivity in Northern Vietnam[D]. Uppsala: Uppsala University, 3–7 [41] XIAO R, LIU Y, HUANG X, et al. 2018. Exploring the driving forces of farmland loss under rapidurbanization using binary logistic regression and spatial regression: a case study of Shanghai and Hangzhou Bay[J]. Ecological Indicators, 95: 455−467 doi: 10.1016/j.ecolind.2018.07.057 [42] ZANG L Z, ARARAL E, WANG Y H. 2019. Effects of land fragmentation on the governance of the commons: theory and evidence from 284 villages and 17 provinces in China[J]. Land Use Policy, 82: 518−527 doi: 10.1016/j.landusepol.2018.12.042 -


 下载:
下载:


 点击查看大图

计量
- 文章访问数: 137
- HTML全文浏览量: 76
- PDF下载量: 19
- 被引次数: 0
