

Comparative study of different meteorological yield separation methods in waterlogging disaster assessment
-
摘要: 农业旱涝灾害评估中常采用不同方法计算作物气象产量, 但其中鲜见关于不同方法的比较研究。长江中下游棉区因涝减产现象严重, 因此本文以该地区6省为研究区, 利用标准化降水蒸散指数量化棉花生长期的涝渍强度, 选用7种常见气象产量分离方法(线性拟合、二次多项式拟合、三次多项式拟合、HP滤波法、3年滑动平均法、5年滑动平均法及五点二次平滑法)计算棉花气象产量, 并通过涝渍强度与气象产量的相关分析结果评估不同方法的表现。此外, 结合历史受涝面积对不同方法的涝渍灾害刻画能力进行对比。结果表明: 不同方法计算的棉花气象产量具有相似的长期趋势, 但在短期波动上存在较大差异。就气象产量和涝渍程度的相关性而言, HP滤波法、线性拟合和二次多项式效果更好; 而就气象产量结果与历史受涝面积的相符程度而言, HP滤波最优, 其次是二次多项式和三次多项式。此外, 基于7种方法的相关分析结果均判定湖北省和安徽省是棉花因涝减产最严重的省份, 但对于其余省份的判定结果会存在差异。湖北省和安徽省虽然因涝减产严重, 但两省棉花涝渍的发生倾向低于其余省份。因此, 在农业涝渍评估工作中推荐使用HP滤波法, 而长江中下游棉区的涝渍防治工作应重点关注湖北省和安徽省。Abstract: Various meteorological yield separation methods have been applied in research on agricultural drought and flood disaster assessment. However, a specific comparison of the performance of these methods is rarely performed. The middle-and-lower reach of Yangtze River is an important cotton-production belt in China, but the region is frequently flooded, resulting in severe cotton yield losses. Hence, the objective of the present work was to assess the impacts of waterlogging disasters on cotton yield fluctuation in this cotton-production belt and to compare the accuracy of different meteorological yield separation methods for characterizing the correlations between waterlogging intensity and cotton climatic yields. Six provinces located in this belt were selected as the study areas, and the cotton climatic yields were calculated using various meteorological yield separation methods: linear fitness (LF), quadratic polynomial fitness (QP), cubic polynomial fitness (CP), HP filtering (HP), 3-year moving average (TMA), 5-year moving average (FMA), and five-point quadratic smoothing (FPQS). The performances of the employed methods were compared and well-performing methods were recommended. Specifically, the waterlogging intensity over cotton growth periods was quantified using the widely used standardized precipitation evapotranspiration index (SPEI). Next, according to the correlation between waterlogging intensity and cotton climatic yield, the performances of the seven methods were compared; in addition, this comparison was further performed on historical waterlogging area data. The results indicated that the long-term trends of cotton climatic yield derived from different methods were similar, whereas the short-term trends could be different or even opposite. The absolute values of the cotton climatic yield in Zhejiang Province were obviously lower than those in other provinces, indicating that the cotton plants in Zhejiang suffered much lower yield losses from climatic disasters. Regarding the correlation between waterlogging intensity and cotton climatic yield, LF, QP, and HP were preferable at the provincial scale, and HP, TMA, FMA, and FPQS performed satisfactorily at the county scale. Considering the ability of the seven methods to make predictions in historical waterlogging areas, HP, QP, and CP were the most satisfactory. In general, HP performed the best in various aspects. In a few cases (e.g., counties in Anhui Province), the relationships identified by various methods between waterlogging intensity and cotton climatic yields were different, which implies that the selection of meteorological yield separation methods may alter conclusions in some areas. All methods concluded that Hubei and Anhui Provinces suffered the most severe yield-reducing effect of cotton waterlogging, whereas results in other provinces were inconsistent. Although Hubei and Anhui Provinces were identified as the most waterlogging-affected provinces, the waterlogging intensity over cotton growth periods in these two provinces was lower than that in other provinces. In conclusion, HP filtering was demonstrated to be a preferable method for agricultural waterlogging assessment, and to prevent and control cotton waterlogging disasters in the middle-and-lower reach of the Yangtze River Plain, special attention should be given to Hubei and Anhui Provinces.
-

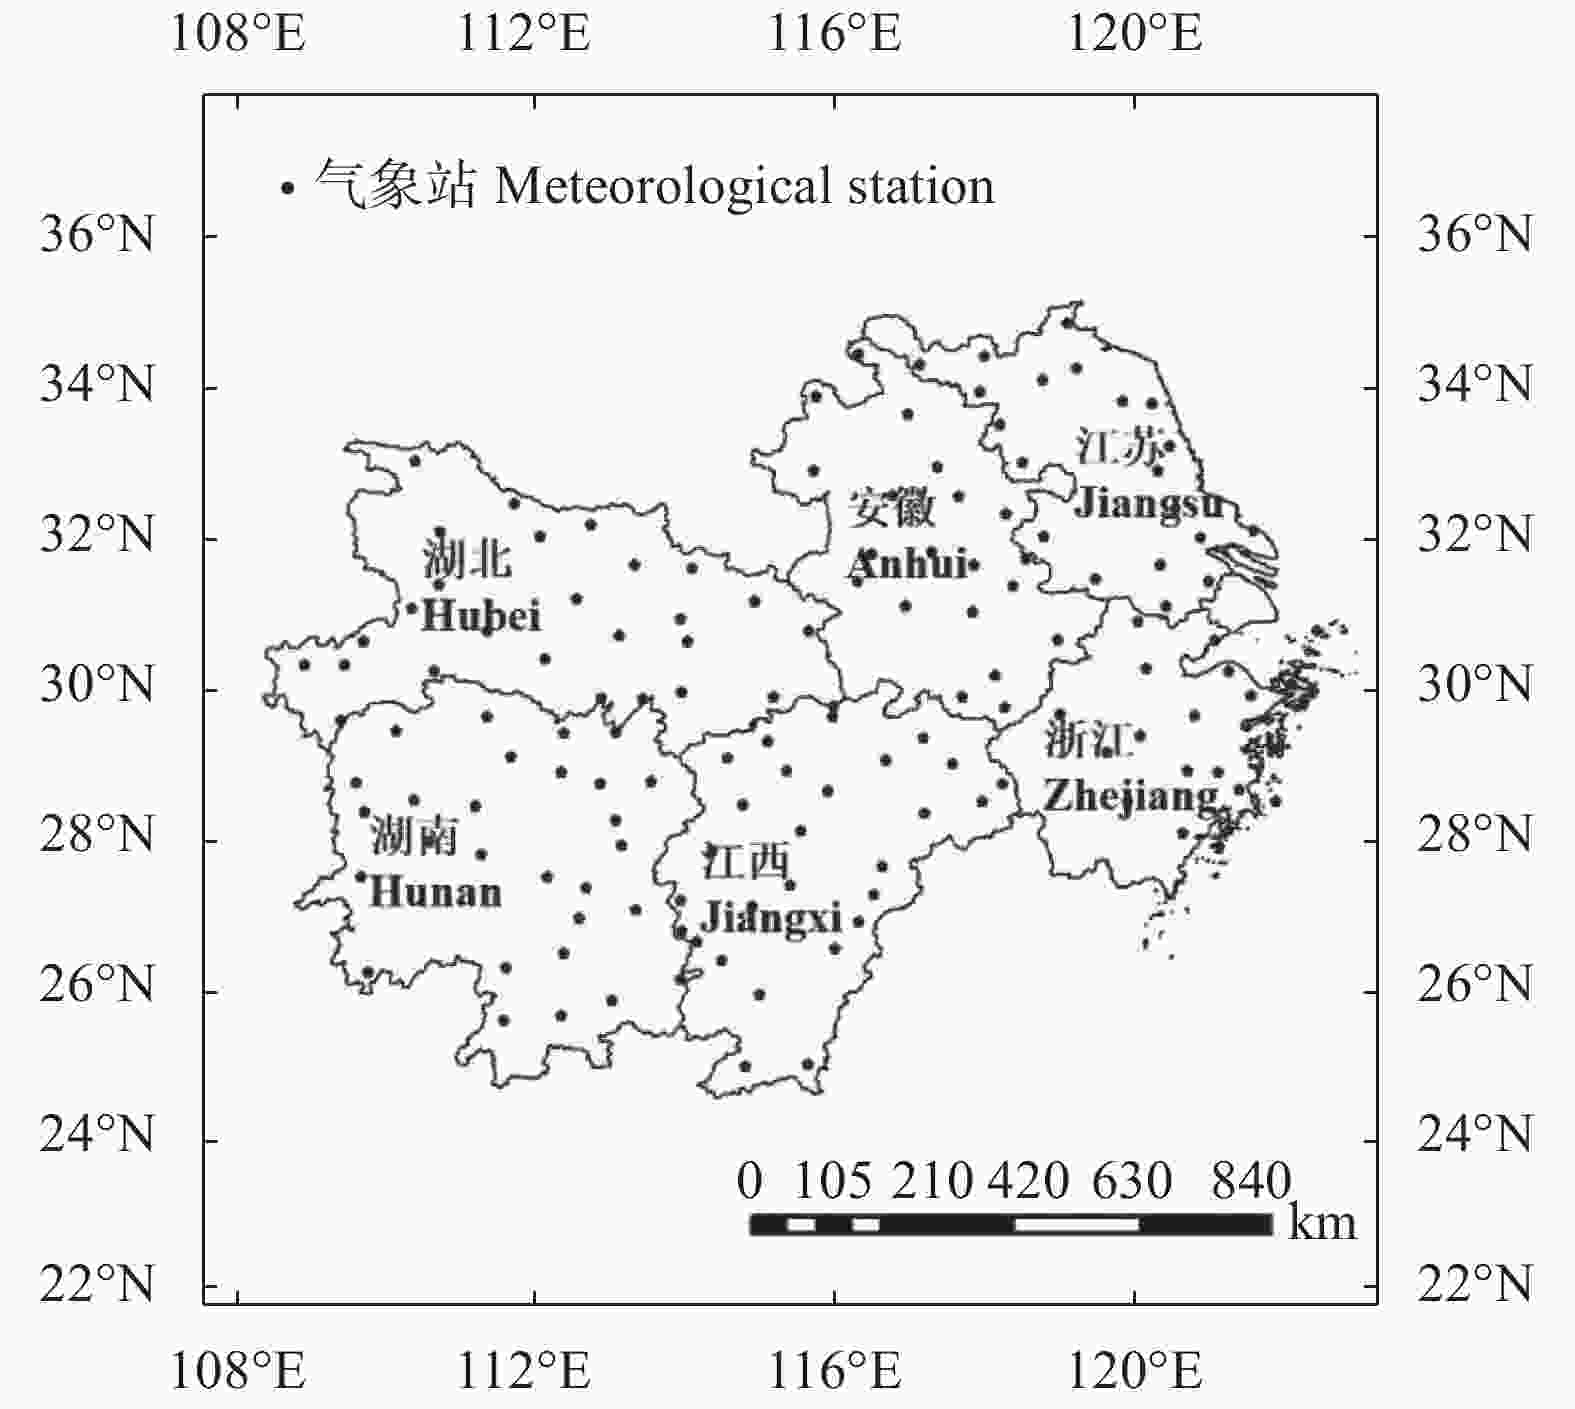
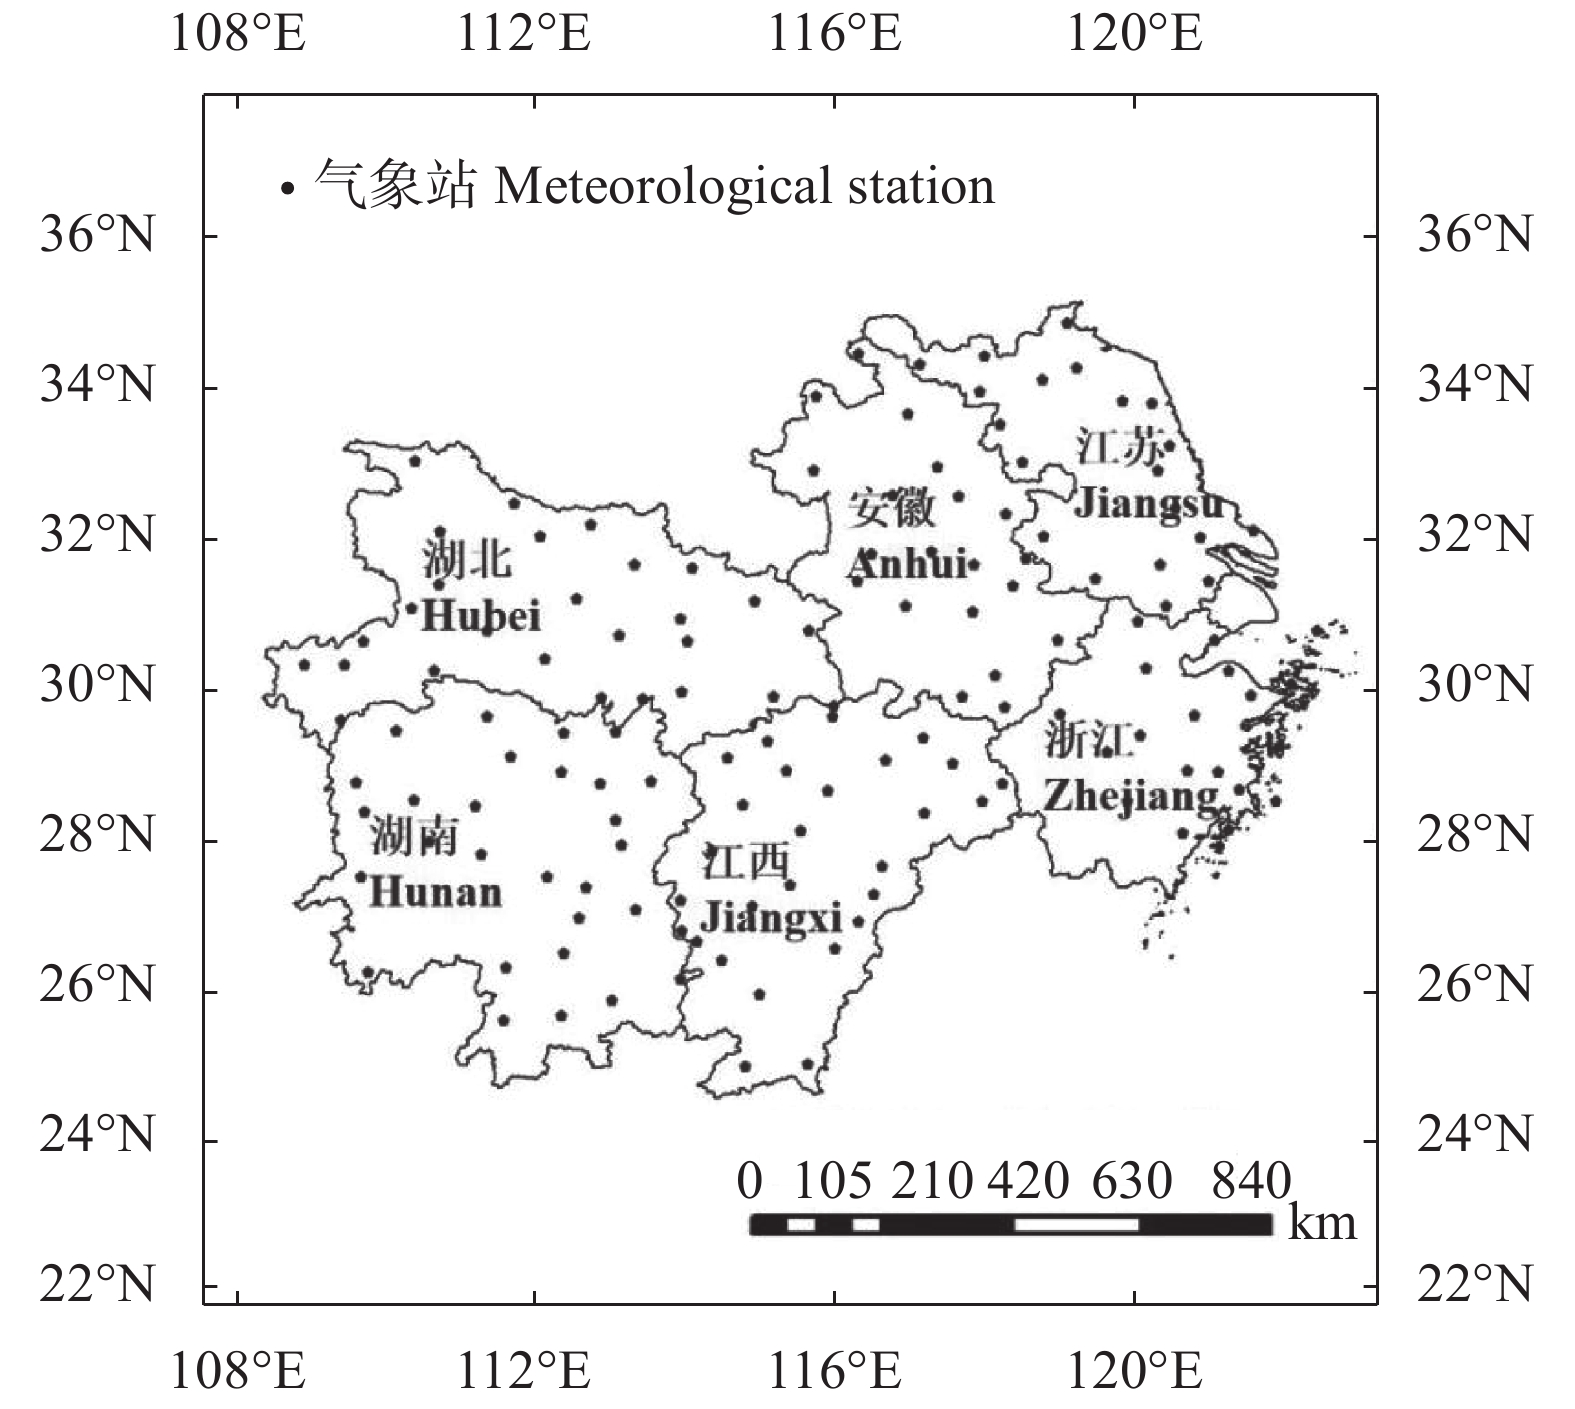
图 1 研究区及其国家基准气象站分布
Figure 1. Study region and distribution of the national-level meteorological stations
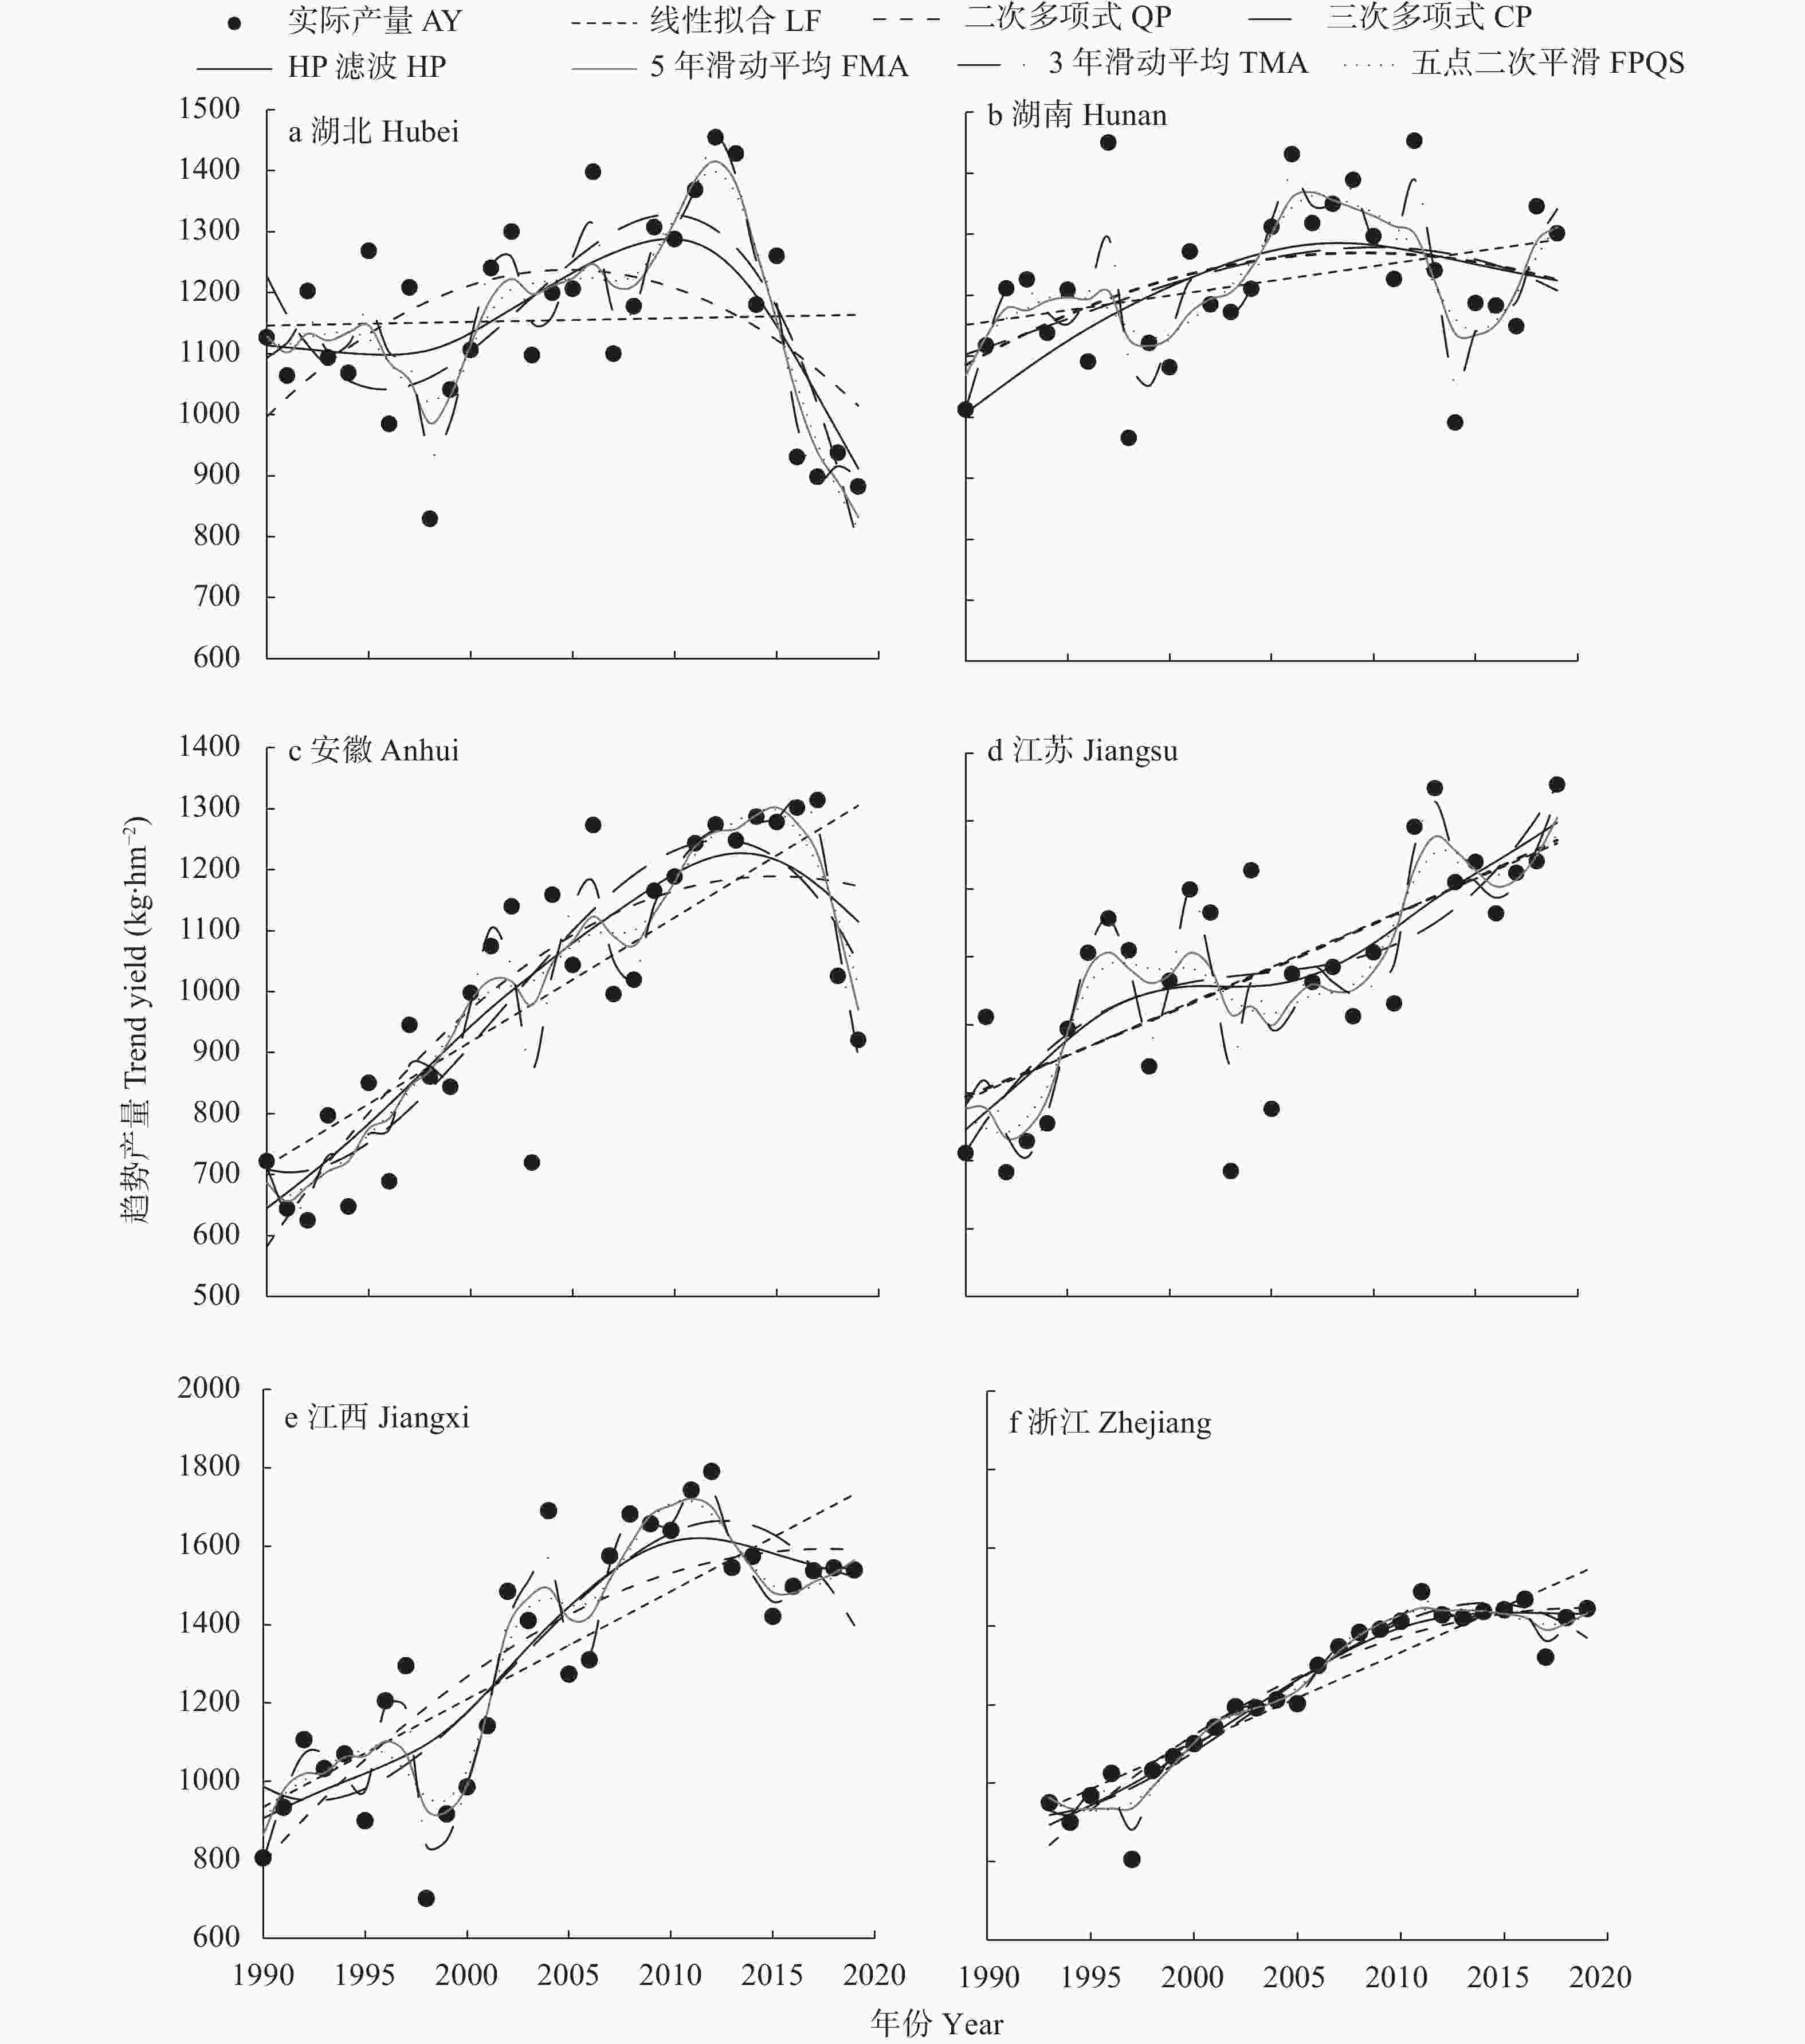
图 2 不同气象产量分离方法拟合的1990—2019年长江中下游6省棉花趋势产量
Figure 2. Cotton trend yields fitted with different meteorological yield separation methods of the six provinces in the middle-and-lower reach of the Yangtze River from 1990 to 2019
AY is actual cotton yield. LF, QP, CP, HP, FMA, FPQS, and TMA indicate linear fitting method, quadratic polynomial method, cubic polynomial method, HP filter method, five-year moving average method, five point quadratic smoothing method, and three-year moving average method, respectively.
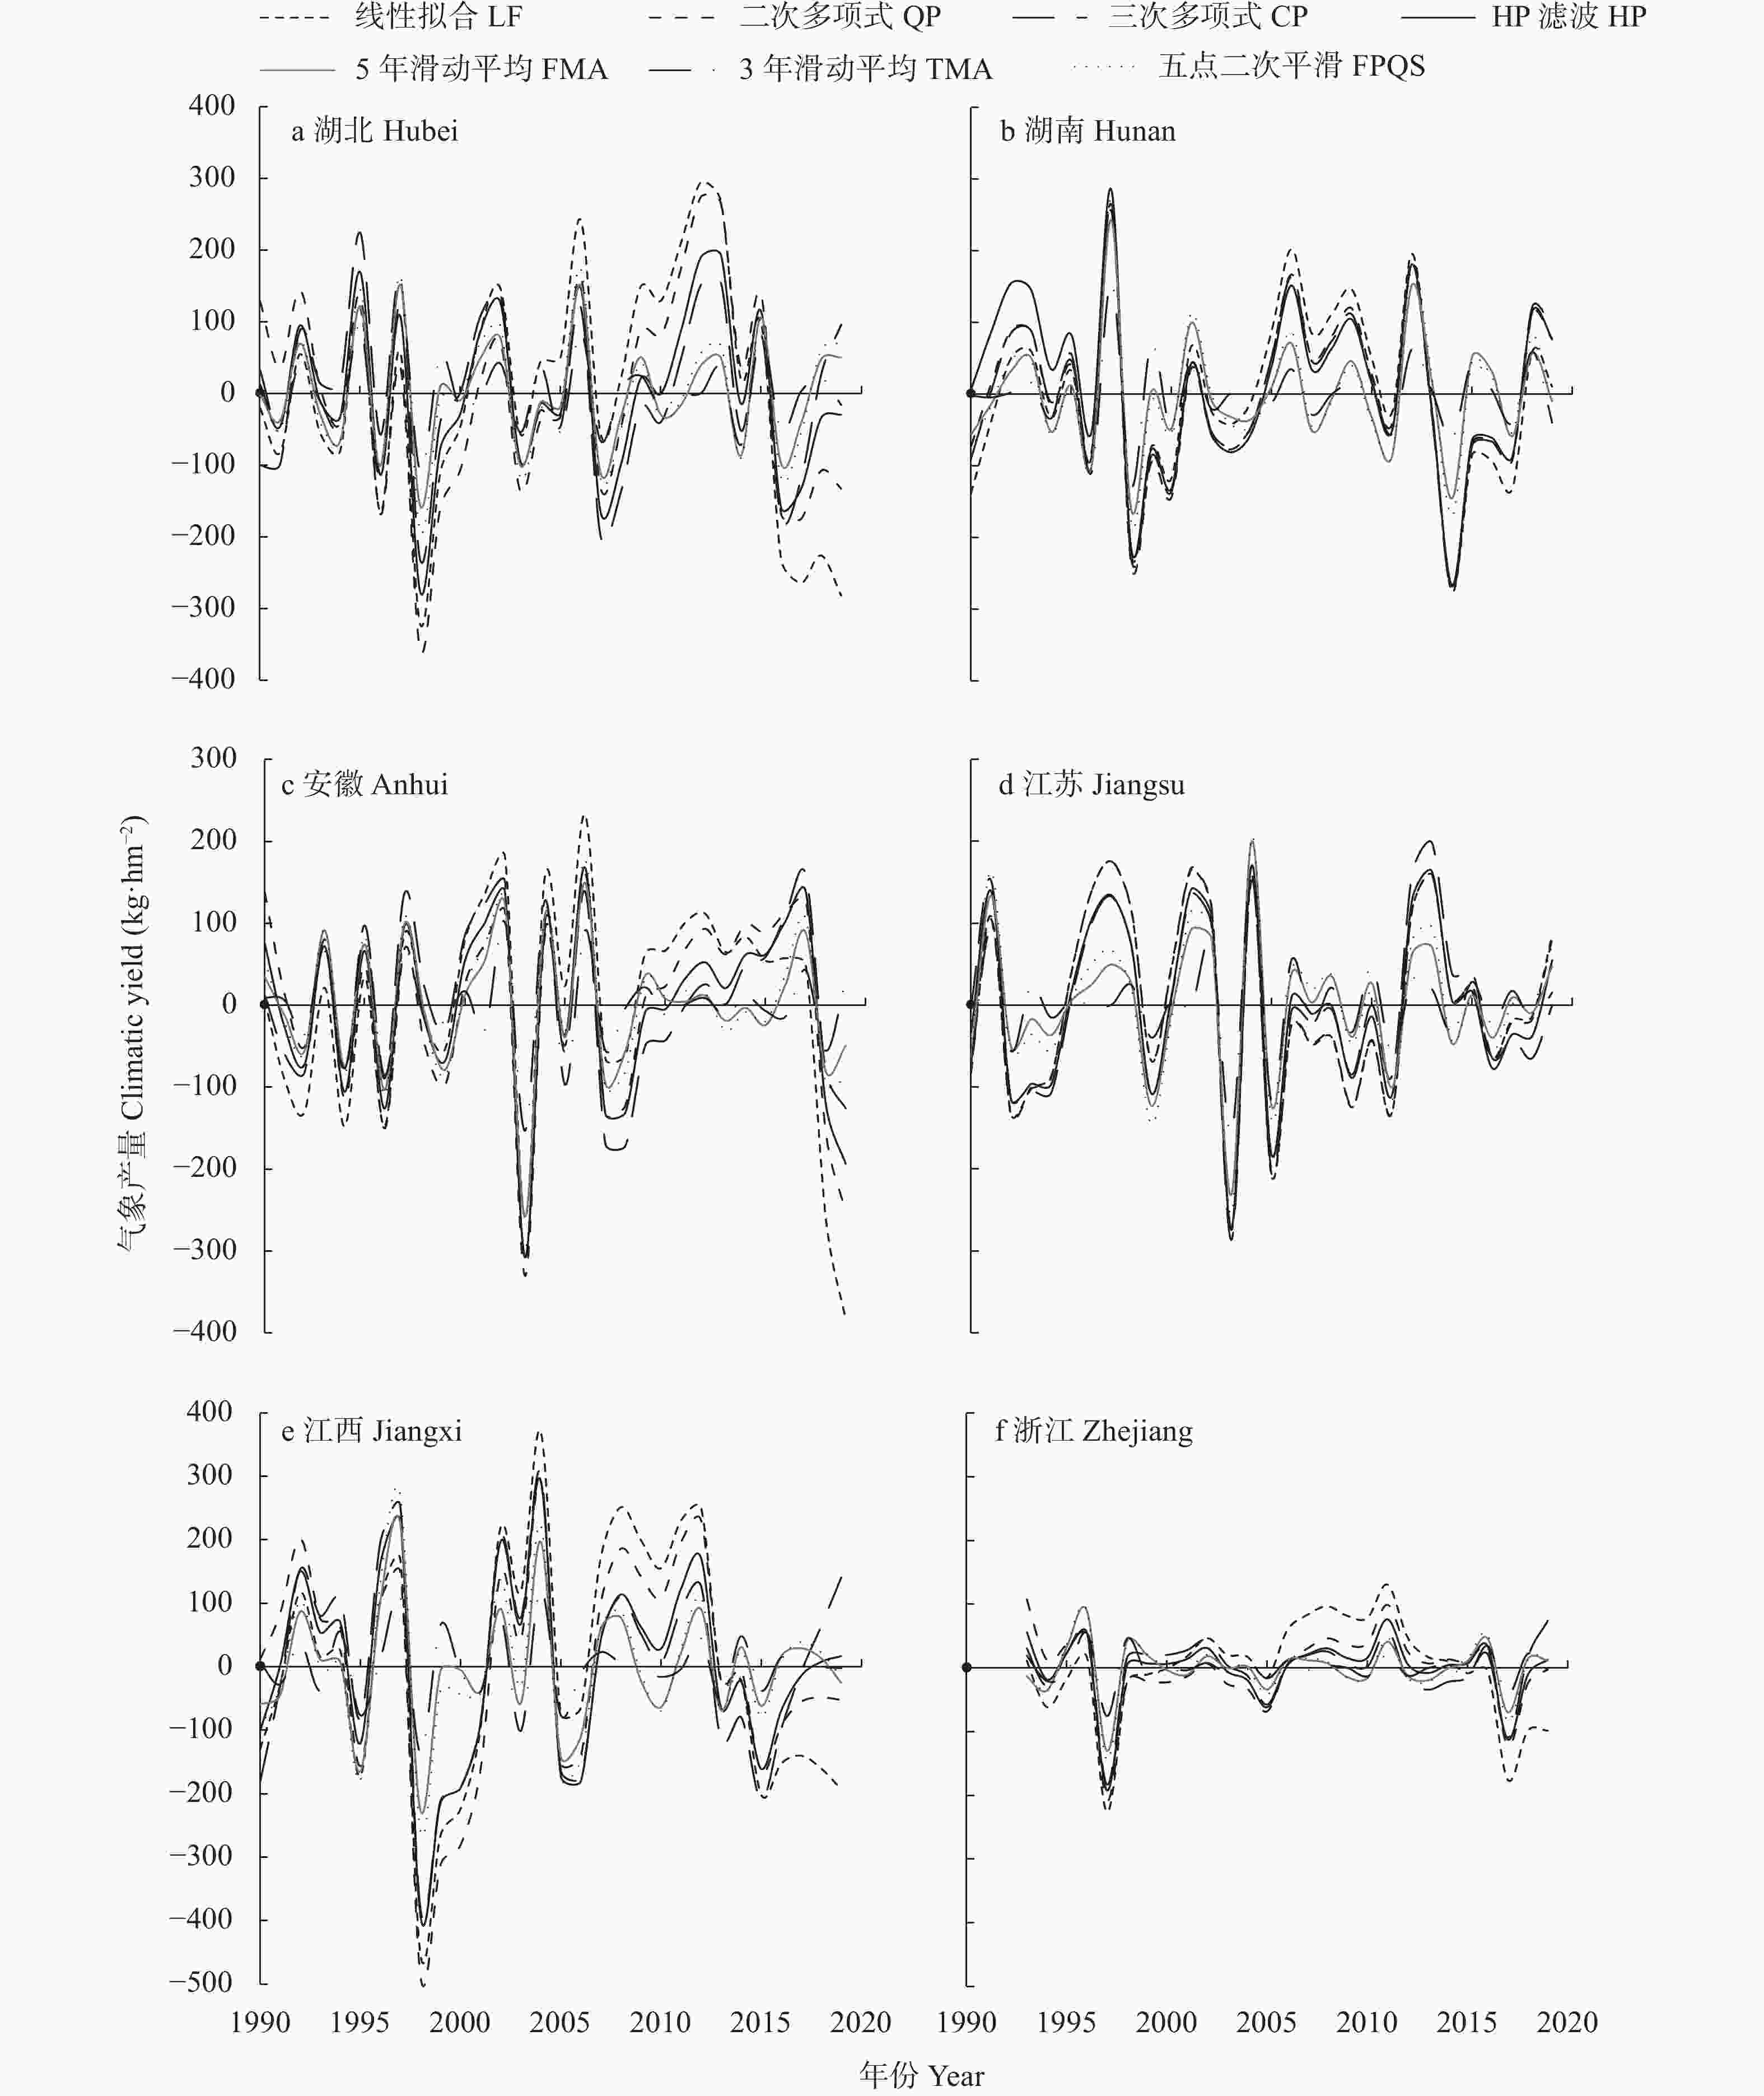
图 3 1990—2019年不同气象产量分离方法分离的长江中下游6省棉花气象产量
Figure 3. Climatic cotton yields fitted by different methods of the six provinces in the middle-and-lower reach of the Yangtze River from 1990 to 2019
LF, QP, CP, HP, FMA, FPQS, and TMA indicate linear fitting method, quadratic polynomial method, cubic polynomial method, HP filter method, five-year moving average method, five point quadratic smoothing method, and three-year moving average method, respectively.
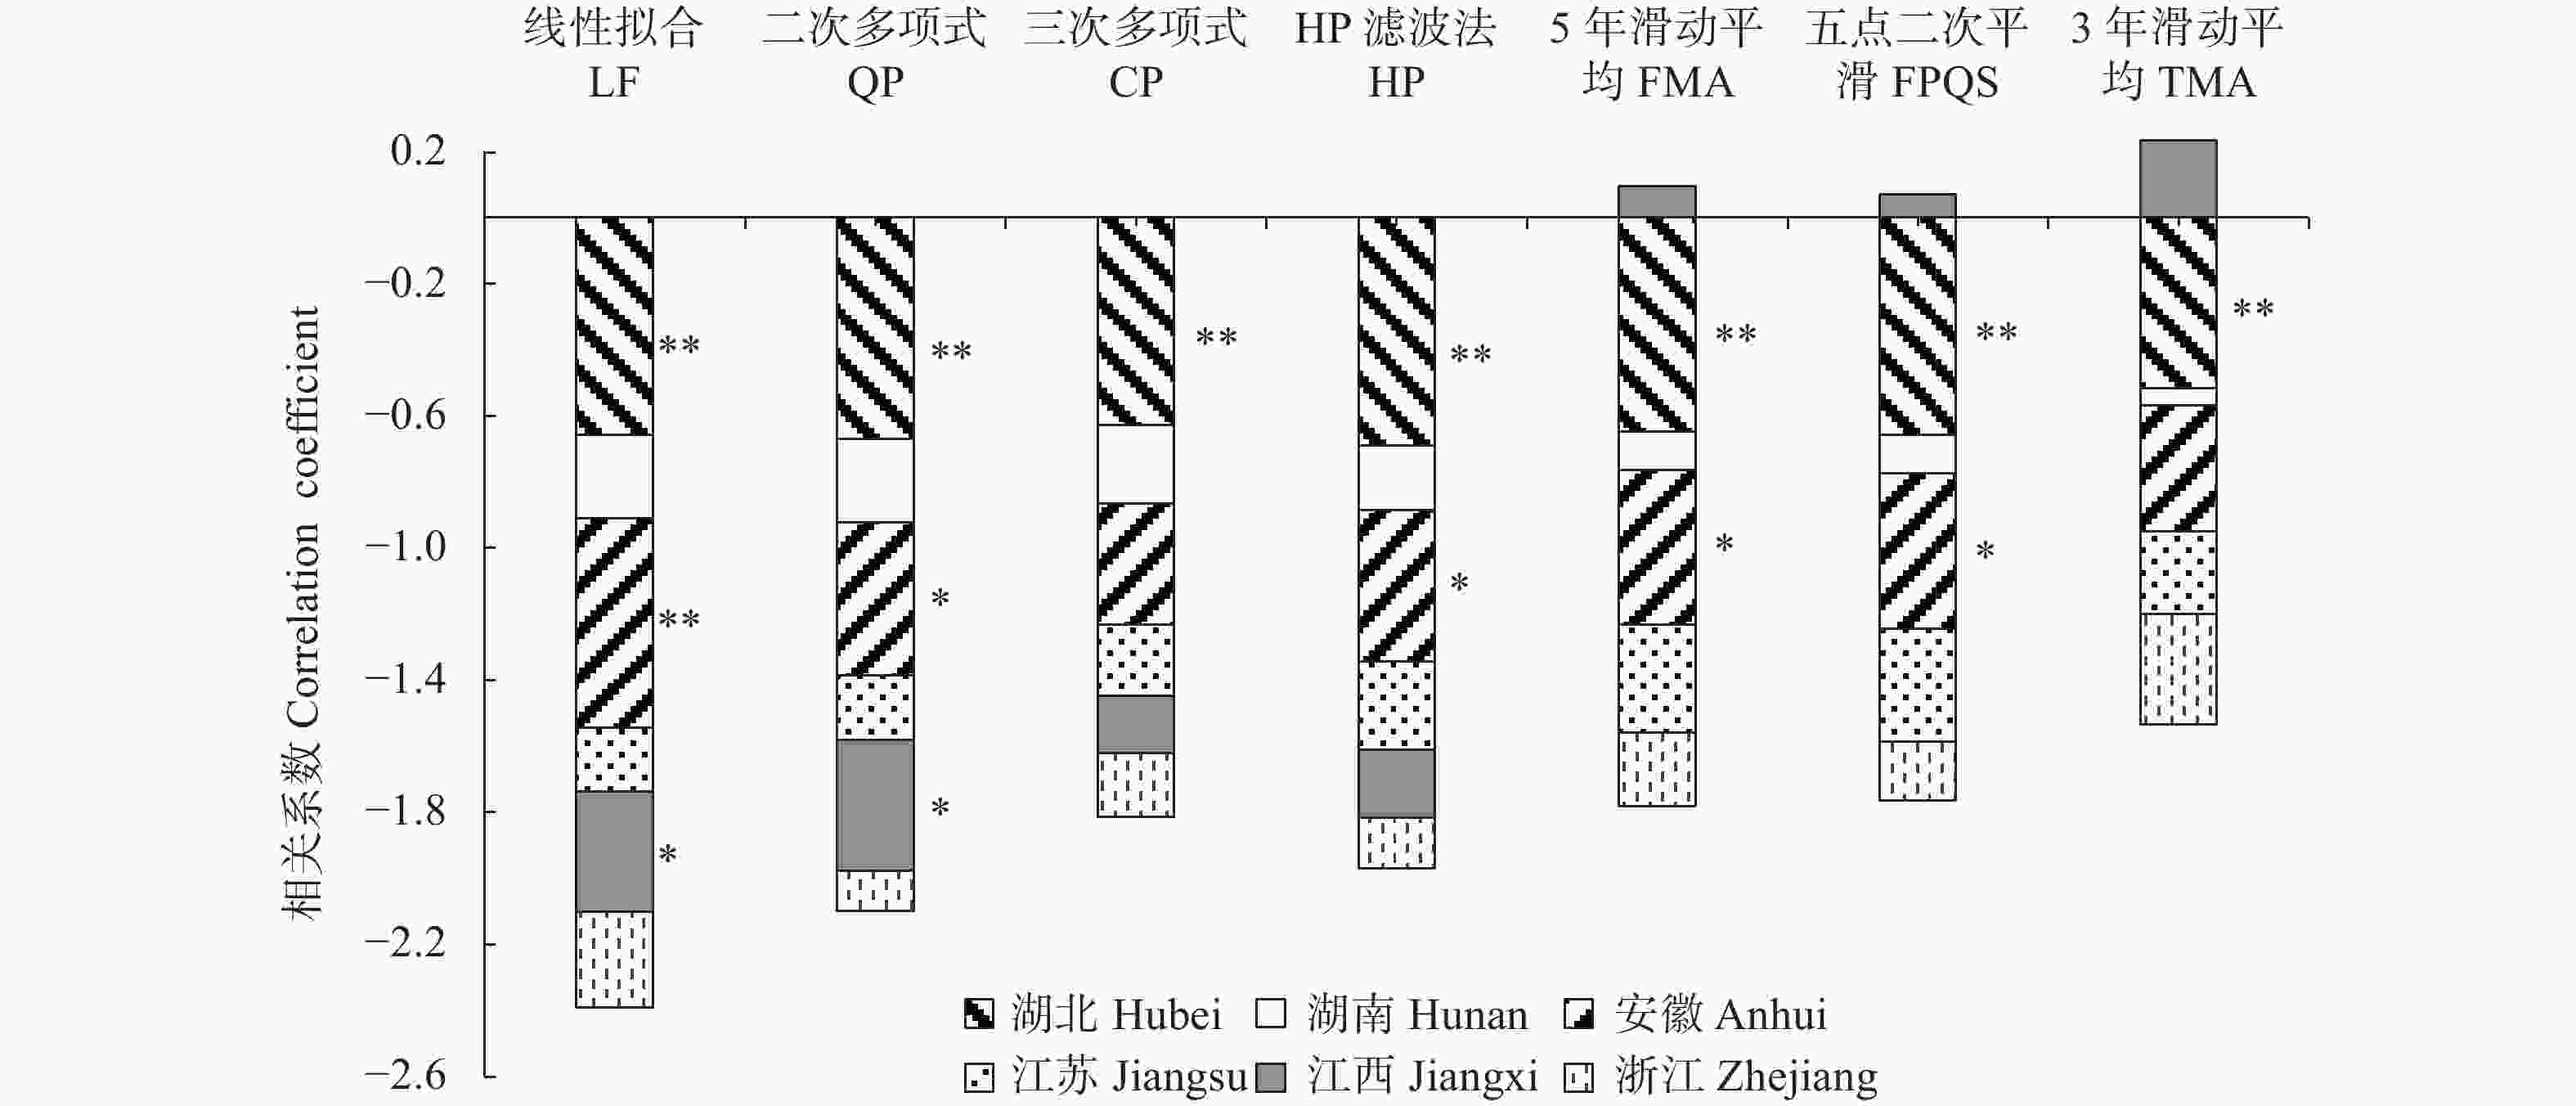
图 4 基于7种气象产量方法分离的长江中下游6省棉花气象产量与涝渍指标的相关系数
Figure 4. Correlation coefficients between cotton climatic yield fitted by different methods and cotton waterlogging indicator of the six provinces in the middle-and-lower reach of the Yangtze River
LF, QP, CP, HP, FMA, FPQS, and TMA indicate linear fitting method, quadratic polynomial method, cubic polynomial method, HP filter method, five-year moving average method, five point quadratic smoothing method, and three-year moving average method, respectively.
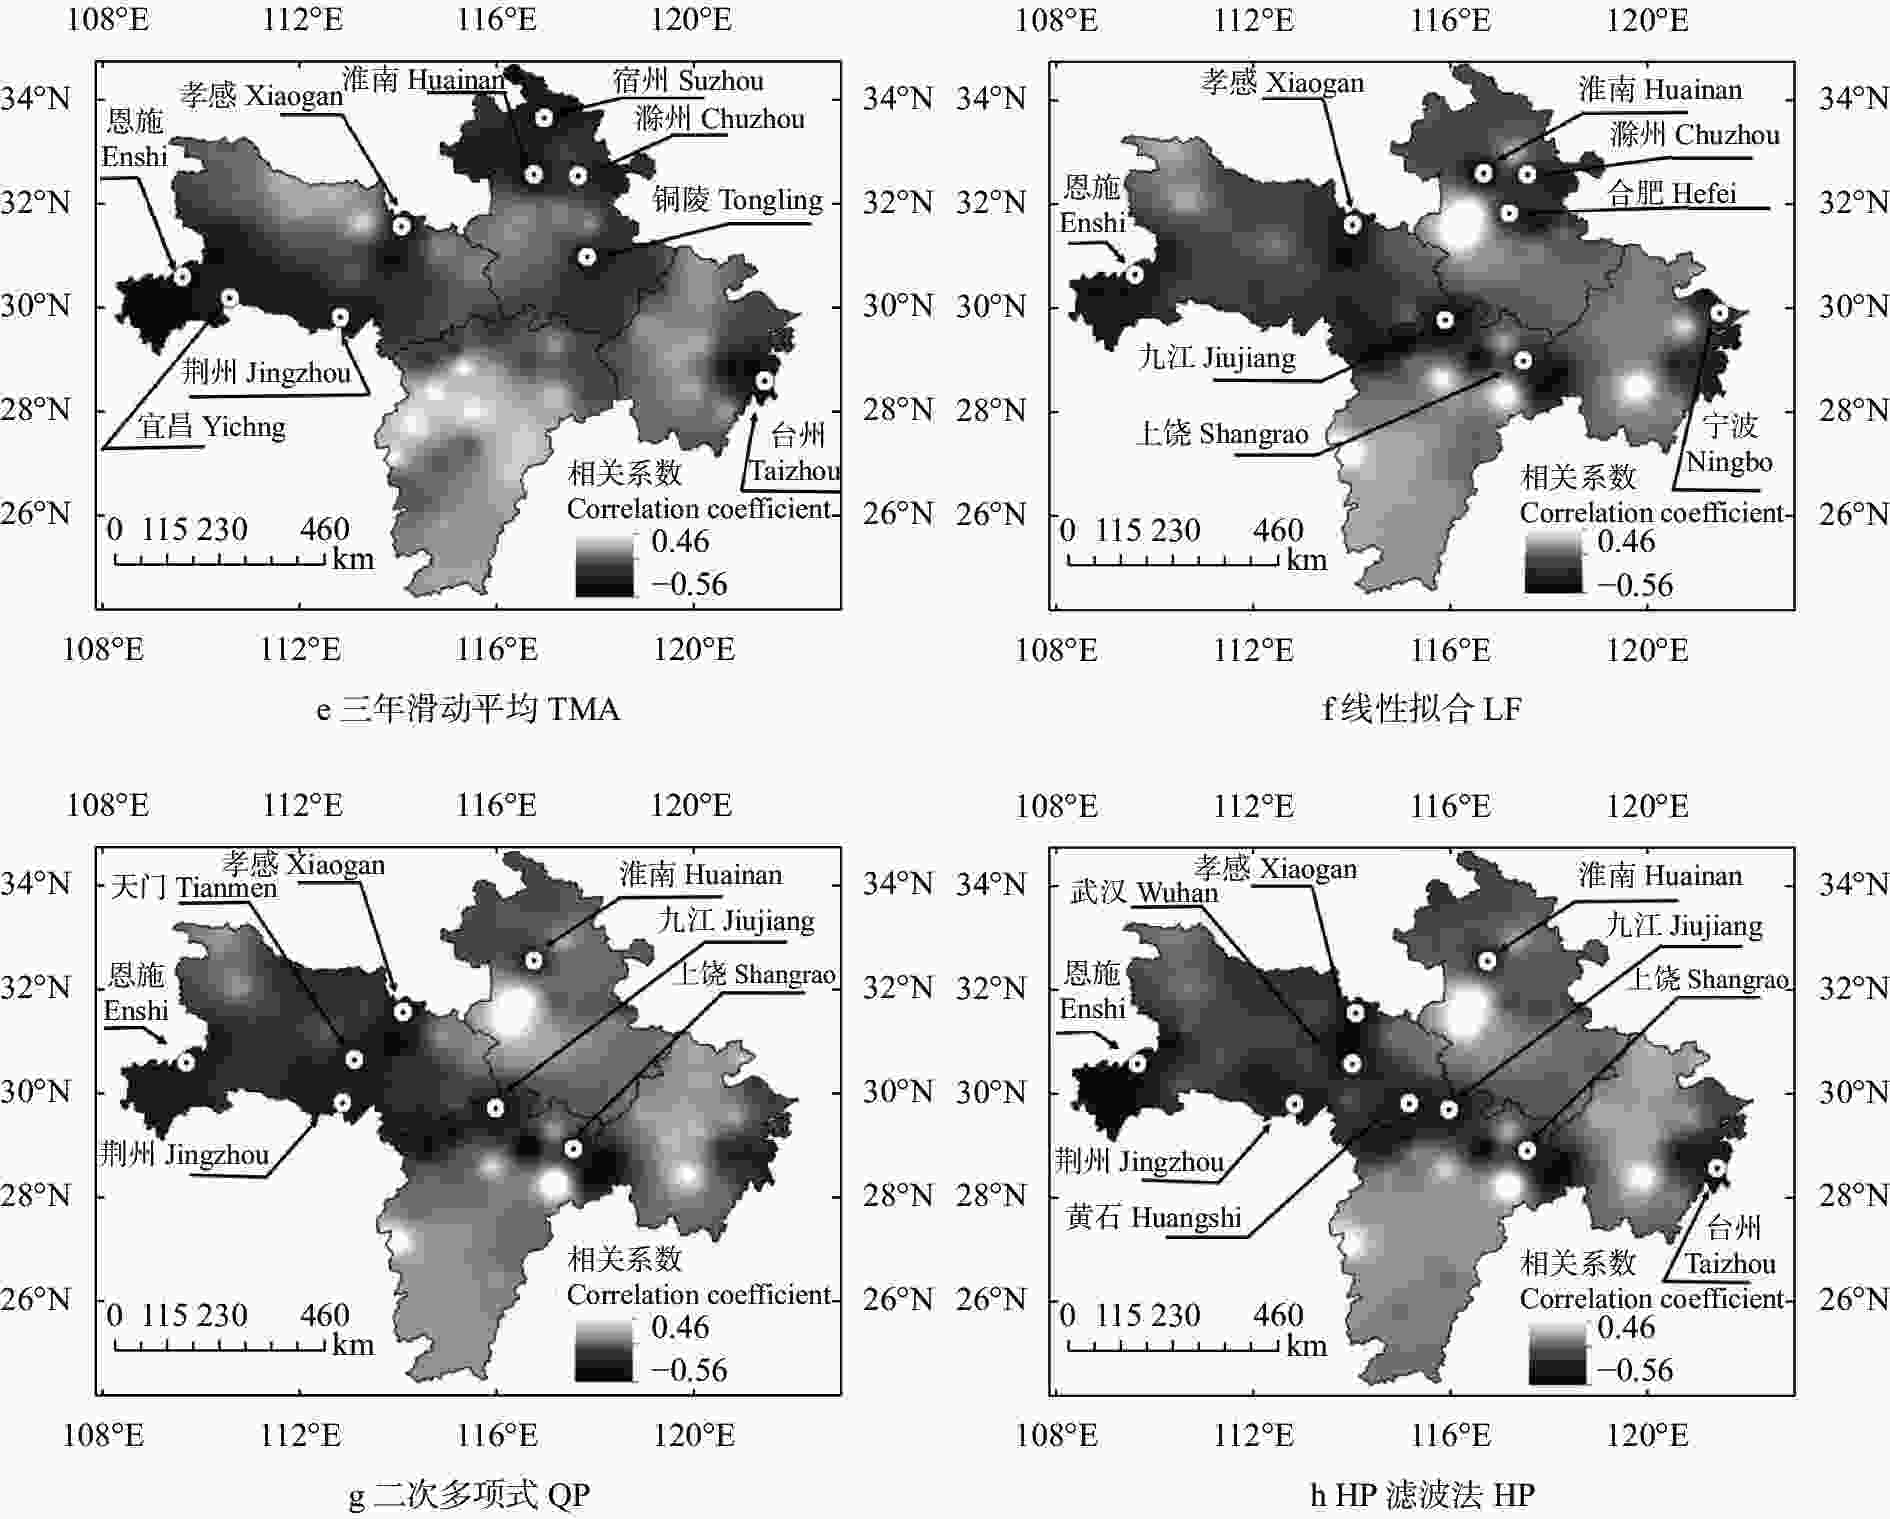
图 5 基于7种气象产量方法分离的长江中下游6省棉花气象产量与涝渍指标的相关系数的空间分布
Figure 5. Spatial distribution of correlation coefficients between cotton climatic yield fitted by different methods and cotton waterlogging indicator of the six provinces in the middle-and-lower reach of the Yangtze River
图中点标记表示该地区存在显著负相关结果。黄山市和湖州市棉花种植面积和产量均很小, 且个别年份出现了极端气象产量, 因此未纳入计算范畴。The points indicate negatively significant correlation. Cotton planting areas and cotton yields in Huangshan and Huzhou were very few, and their cotton climatic yields were abnormally high in a few years; thus, they were excluded in the calculation processes. LF, QP, CP, HP, FMA, FPQS, and TMA indicate linear fitting method, quadratic polynomial method, cubic polynomial method, HP filter method, five-year moving average method, five point quadratic smoothing method, and three-year moving average method, respectively.
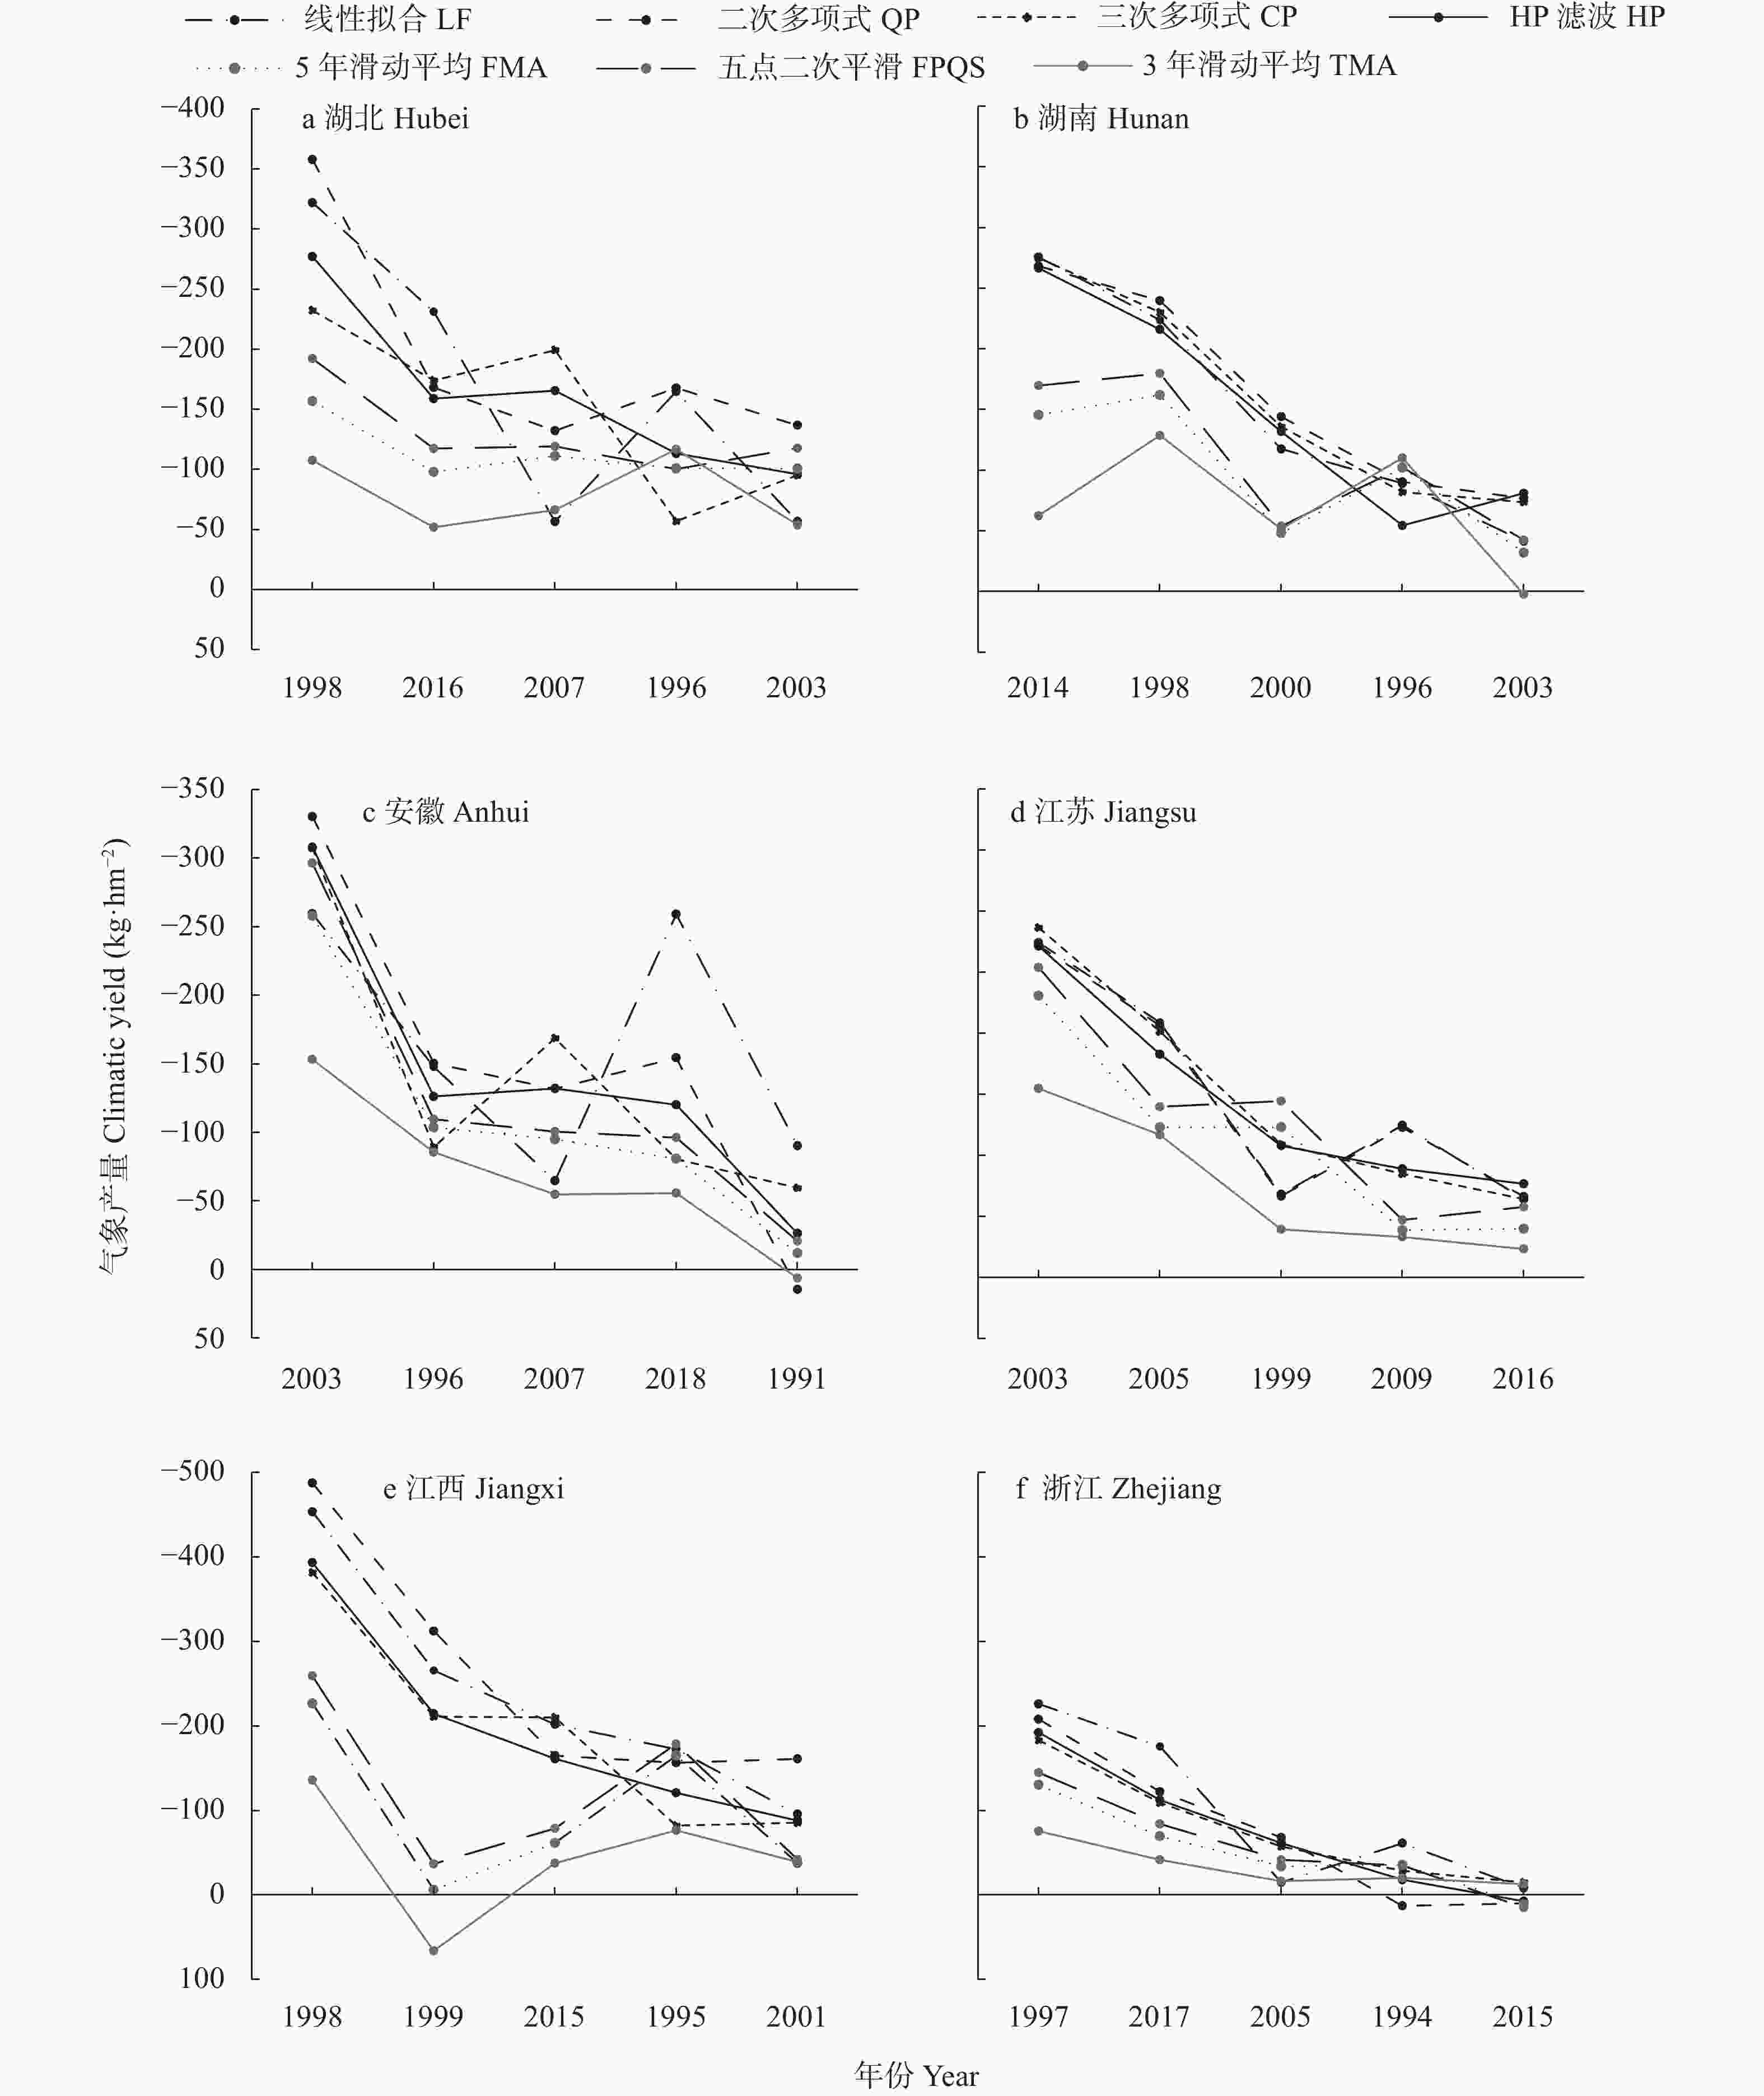
图 6 长江中下游6省典型涝渍年与对应的气象产量
Figure 6. Cotton climatic yields during the typical waterlogging years in the six provinces in the middle-and-lower reach of Yangtze River Plain
LF, QP, CP, HP, FMA, FPQS, and TMA indicate linear fitting method, quadratic polynomial method, cubic polynomial method, HP filter method, five-year moving average method, five point quadratic smoothing method, and three-year moving average method, respectively.
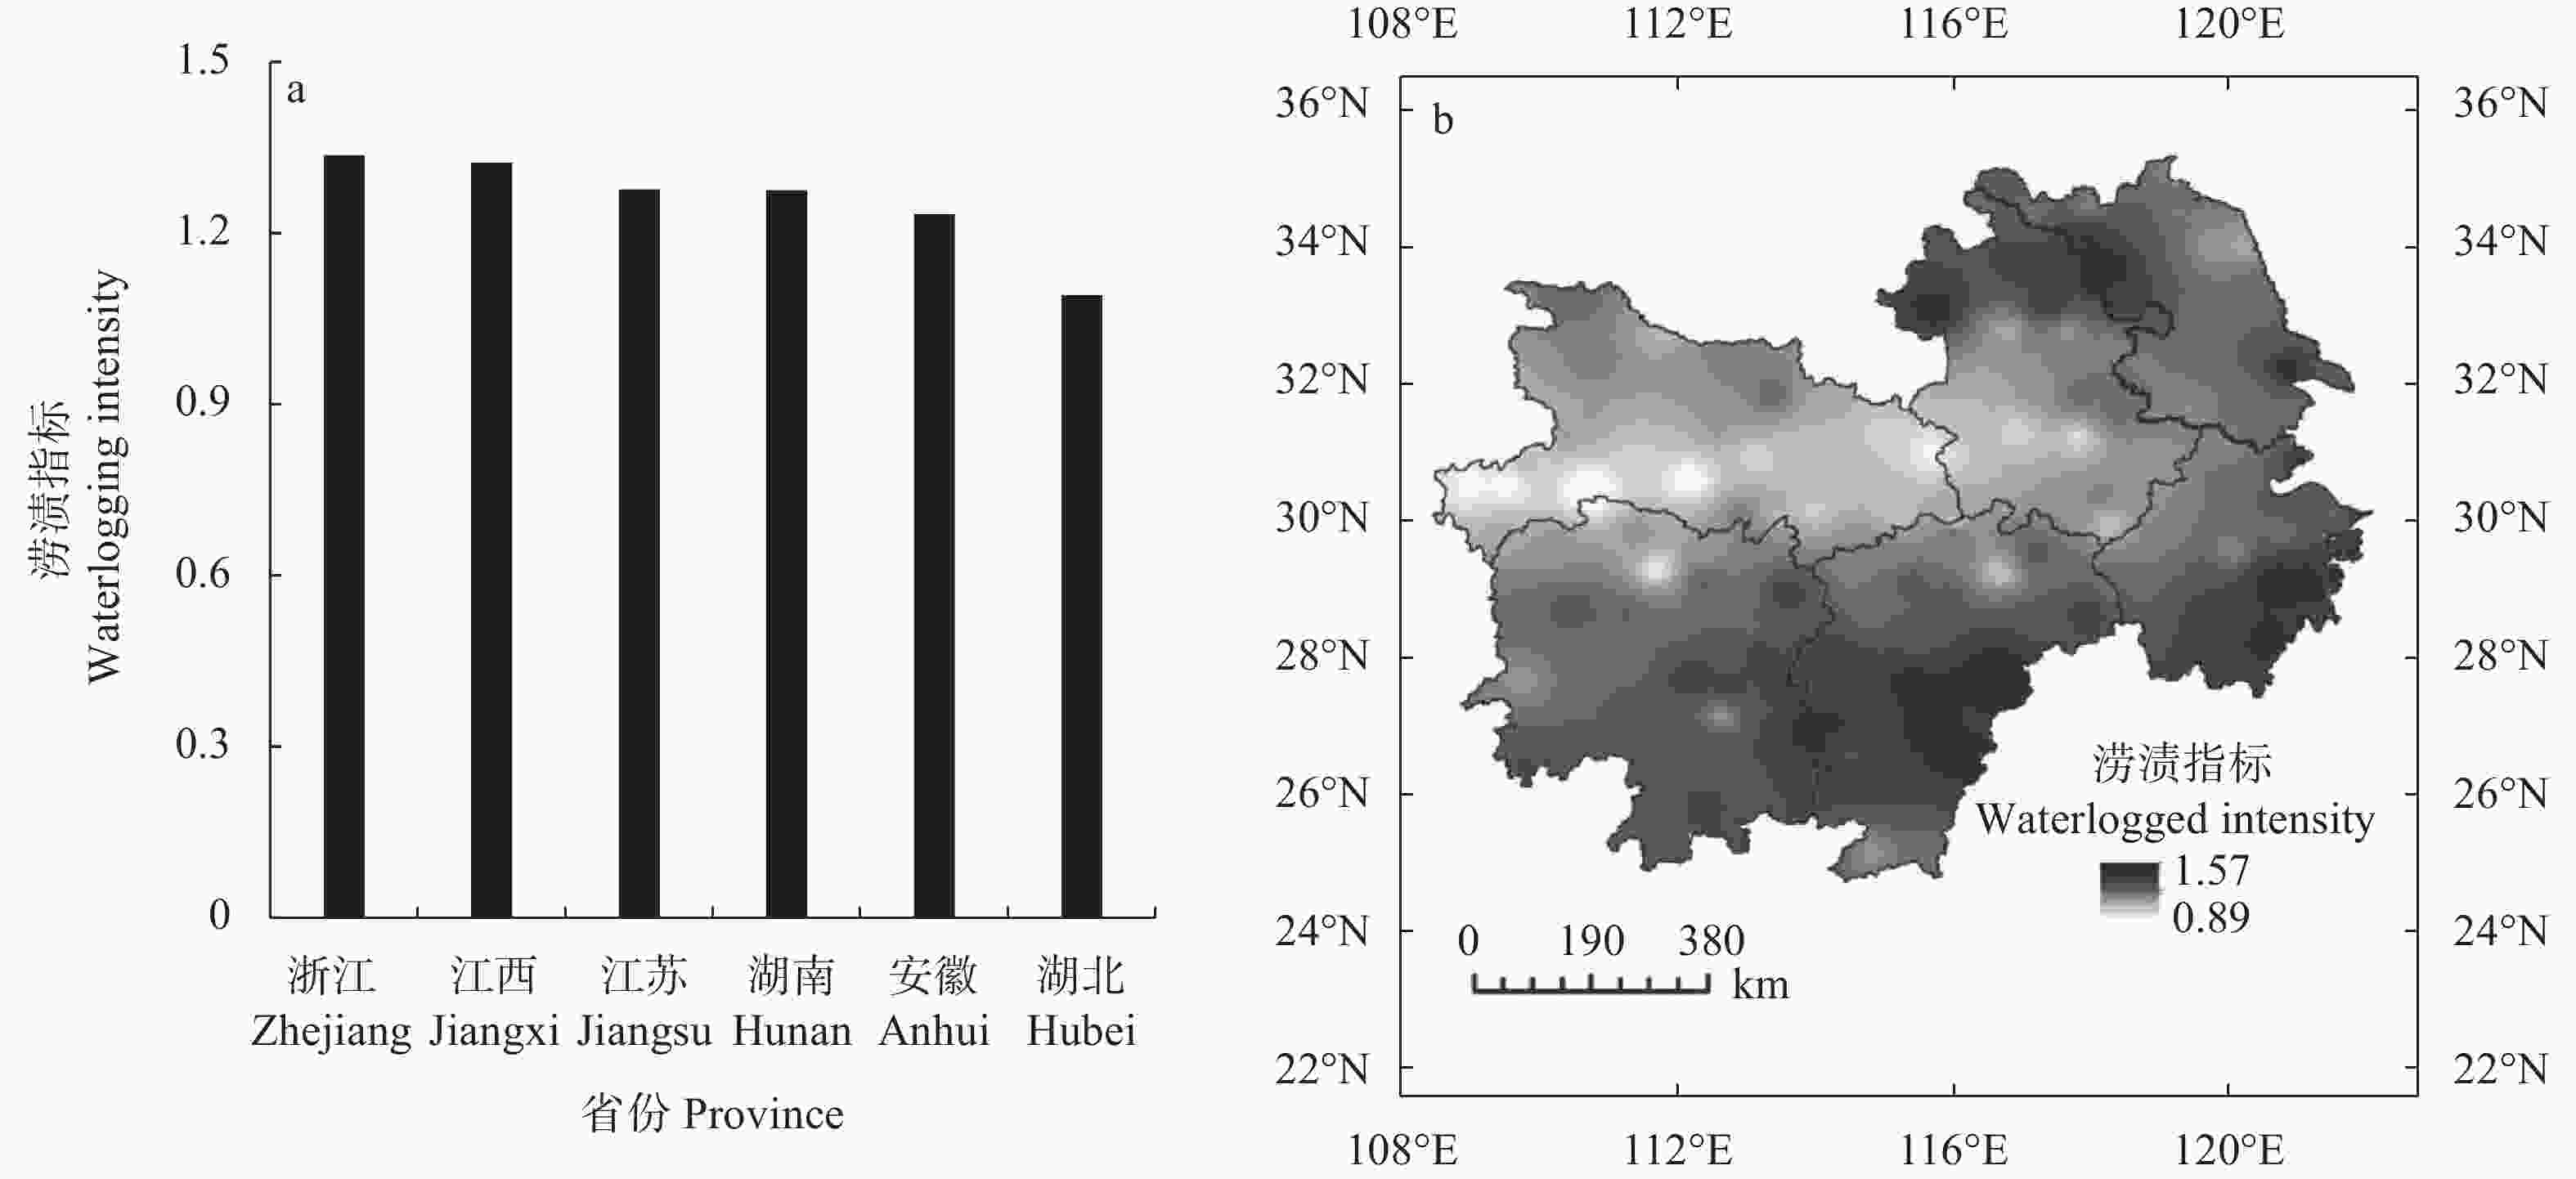
图 7 长江中下游6省1990—2019年棉花涝渍指标均值比较(a)及空间分布特征(b)
Figure 7. Averaged cotton waterlogging intensity (a) and its spatial distribution (b) in the six provinces in the middle-and-lower reach of the Yangtze River Plain from 1990 to 2019
表 1 7种气象产量分离方法拟合的长江中下游6省棉花趋势产量序列与对应方法所得的研究区域平均趋势产量序列间的相关系数
Table 1. Correlation coefficients between the cotton trend yield series fitted by seven meteorological yield separation methods and the averaged trend yield series obtained by the corresponding method in the six provinces in the middle-and-lower reach of the Yangtze River
方法 Method 湖北 Hubei 湖南 Hunan 安徽 Anhui 江苏 Jiangsu 江西 Jiangxi 浙江 Zhejiang 线性拟合 LF 1.000** 1.000** 1.000** 1.000** 1.000** 1.000** 二次多项式 QP 0.398* 0.947** 0.999** 0.936** 0.998** 0.993** 三次多项式 CP 0.479** 0.932** 0.999** 0.739** 0.999** 0.976** HP滤波法 HP 0.411* 0.923** 0.998** 0.858** 0.996** 0.983** 5年滑动平均 FMA 0.462* 0.638** 0.938** 0.719** 0.967** 0.957** 五点二次平滑 FPQS 0.453* 0.643** 0.952** 0.733** 0.975** 0.965** 3年滑动平均 TMA 0.489** 0.623** 0.894** 0.700** 0.940** 0.918** *和**分别表示P<0.05和P<0.01显著性水平。计算样本量为6。* and ** indicate significance levels of P<0.05 and P<0.01, respectively. The calculation sample size is 6. LF, QP, CP, HP, FMA, FPQS, and TMA indicate linear fitting method, quadratic polynomial method, cubic polynomial method, HP filter method, five-year moving average method, five point quadratic smoothing method, and three-year moving average method, respectively.  下载: 导出CSV
表 2 各长江中下游6省依据气象产量和历史受涝面积对涝渍年份排序的一致比率
Table 2. Consistent ratios of the sequences of waterlogging years identified by climatic yield and the sequences of historical waterlogging areas of in the six provinces in the middle-and-lower reach of the Yangtze River Plain
一致比率Consistent ratio
(%)省份数 Number of provinces 线性拟合
LF二次多项式
QP三次多项式
CPHP滤波法
HP5年滑动平均
FMA五点二次平滑
FPQS3年滑动平均
TMA100 2 3 3 3 1 2 1 80 2 2 2 3 4 0 2 60 1 0 0 0 0 3 2 40 1 1 1 0 1 1 1 LF, QP, CP, HP, FMA, FPQS, and TMA indicate linear fitting method, quadratic polynomial method, cubic polynomial method, HP filter method, five-year moving average method, five point quadratic smoothing method, and three-year moving average method, respectively.
下载: 导出CSV
-
[1] 姜大膀, 王晓欣. 对IPCC第六次评估报告中有关干旱变化的解读[J]. 大气科学学报, 2021, 44(5): 650−653JIANG D B, WANG X X. A brief interpretation of drought change from IPCC Sixth Assessment Report[J]. Transactions of Atmospheric Sciences, 2021, 44(5): 650−653 [2] LESK C, ROWHANI P, RAMANKUTTY N. Influence of extreme weather disasters on global crop production[J]. Nature, 2016, 529(7584): 84−87 doi: 10.1038/nature16467 [3] 张爱民, 马晓群, 杨太明, 等. 安徽省旱涝灾害及其对农作物产量影响[J]. 应用气象学报, 2007, 18(5): 619−626 doi: 10.3969/j.issn.1001-7313.2007.05.006ZHANG A M, MA X Q, YANG T M, et al. The influence of drought and waterlogging disasters on crop yields in Anhui Province[J]. Journal of Applied Meteorological Science, 2007, 18(5): 619−626 doi: 10.3969/j.issn.1001-7313.2007.05.006 [4] ZHANG T Y, HUANG Y. Impacts of climate change and inter-annual variability on cereal crops in China from 1980 to 2008[J]. Journal of the Science of Food and Agriculture, 2012, 92(8): 1643−1652 doi: 10.1002/jsfa.5523 [5] 李伟光, 陈汇林, 朱乃海, 等. 标准化降水指标在海南岛干旱监测中的应用分析[J]. 中国生态农业学报, 2009, 17(1): 178−182 doi: 10.3724/SP.J.1011.2009.00178LI W G, CHEN H L, ZHU N H, et al. Analysis of drought monitoring on Hainan Island from standardized precipitation index[J]. Chinese Journal of Eco-Agriculture, 2009, 17(1): 178−182 doi: 10.3724/SP.J.1011.2009.00178 [6] 杨晓晨, 明博, 陶洪斌, 等. 中国东北春玉米区干旱时空分布特征及其对产量的影响[J]. 中国生态农业学报, 2015, 23(6): 758−767YANG X C, MING B, TAO H B, et al. Spatial distribution characteristics and impact on spring maize yield of drought in Northeast China[J]. Chinese Journal of Eco-Agriculture, 2015, 23(6): 758−767 [7] 李伟光, 易雪, 侯美亭, 等. 基于标准化降水蒸散指数的中国干旱趋势研究[J]. 中国生态农业学报, 2012, 20(5): 643−649 doi: 10.3724/SP.J.1011.2012.00643LI W G, YI X, HOU M T, et al. Standardized precipitation evapotranspiration index shows drought trends in China[J]. Chinese Journal of Eco-Agriculture, 2012, 20(5): 643−649 doi: 10.3724/SP.J.1011.2012.00643 [8] GUAN X J, ZANG Y W, MENG Y, et al. Study on spatiotemporal distribution characteristics of flood and drought disaster impacts on agriculture in China[J]. International Journal of Disaster Risk Reduction, 2021, 64: 102504 doi: 10.1016/j.ijdrr.2021.102504 [9] 戚颖, 白雪峰, 李铁男. 气候变化对黑龙江省生育期内玉米产量的影响[J]. 农业机械学报, 2019, 50(9): 254−263 doi: 10.6041/j.issn.1000-1298.2019.09.030QI Y, BAI X F, LI T N. Effect of climate change on maize yield in maize growth period in Heilongjiang Province[J]. Transactions of the Chinese Society for Agricultural Machinery, 2019, 50(9): 254−263 doi: 10.6041/j.issn.1000-1298.2019.09.030 [10] 高超, 尹周祥, 许莹. 淮河流域冬小麦主要生育期旱涝时空特征及对产量的影响[J]. 农业工程学报, 2017, 33(22): 103−111 doi: 10.11975/j.issn.1002-6819.2017.22.013GAO C, YIN Z X, XU Y. Space-time characteristics of drought and flood in main growing periods of winter wheat in Huaihe River Basin and its impact on yield[J]. Transactions of the Chinese Society of Agricultural Engineering, 2017, 33(22): 103−111 doi: 10.11975/j.issn.1002-6819.2017.22.013 [11] 陈海涛, 邱林, 王文川, 等. 基于信息扩散和混沌理论的西安市玉米生育期旱涝特征[J]. 地理学报, 2020, 75(9): 1893−1906 doi: 10.11821/dlxb202009006CHEN H T, QIU L, WANG W C, et al. Characteristics analysis of drought and flood for corn in Xi’an City based on information diffusion and chaos theory[J]. Acta Geographica Sinica, 2020, 75(9): 1893−1906 doi: 10.11821/dlxb202009006 [12] 张月, 邓可楠, 高雅文, 等. 利用累积湿润指数评估湖北棉花生育期内旱涝灾害特征[J]. 灌溉排水学报, 2021, 40(9): 57−65ZHANG Y, DENG K N, GAO Y W, et al. Using accumulative humidity index to estimate drought and flooding hazards in cotton growth season in Hubei Province[J]. Journal of Irrigation and Drainage, 2021, 40(9): 57−65 [13] 李心怡, 张祎, 赵艳霞, 等. 主要作物产量分离方法比较[J]. 应用气象学报, 2020, 31(1): 74−82 doi: 10.11898/1001-7313.20200107LI X Y, ZHANG Y, ZHAO Y X, et al. Comparative study on main crop yield separation methods[J]. Journal of Applied Meteorological Science, 2020, 31(1): 74−82 doi: 10.11898/1001-7313.20200107 [14] ZHOU Z Q, SHI H Y, FU Q, et al. Assessing spatiotemporal characteristics of drought and its effects on climate-induced yield of maize in Northeast China[J]. Journal of Hydrology, 2020, 588: 125097 doi: 10.1016/j.jhydrol.2020.125097 [15] 房世波. 分离趋势产量和气候产量的方法探讨[J]. 自然灾害学报, 2011, 20(6): 13−18FANG S B. Exploration of method for discrimination between trend crop yield and climatic fluctuant yield[J]. Journal of Natural Disasters, 2011, 20(6): 13−18 [16] 赵东妮, 王艳华, 任传友, 等. 3种水稻趋势产量拟合方法的比较分析[J]. 中国生态农业学报, 2017, 25(3): 345−355ZHAO D N, WANG Y H, REN C Y, et al. Comparative analysis of three fitting methods of rice trend yield[J]. Chinese Journal of Eco-Agriculture, 2017, 25(3): 345−355 [17] 马丽珲. 基于面板数据模型的干旱对重庆市农作物产量影响研究[D]. 重庆: 西南大学, 2019MA L H. Study on the influence of drought on crop yield in Chongqing based on panel data model[D]. Chongqing: Southwest University, 2019 [18] 钱龙, 王修贵, 罗文兵, 等. 涝渍胁迫对棉花形态与产量的影响[J]. 农业机械学报, 2015, 46(10): 136−143, 166 doi: 10.6041/j.issn.1000-1298.2015.10.018QIAN L, WANG X G, LUO W B, et al. Effects of waterlogging stress on morphology and yield of cotton[J]. Transactions of the Chinese Society for Agricultural Machinery, 2015, 46(10): 136−143, 166 doi: 10.6041/j.issn.1000-1298.2015.10.018 [19] 谢德红, 李俊锋, 刘菂, 等. 基于改进Hodrick-Prescott分解模型的近红外自适应降噪方法[J]. 光谱学与光谱分析, 2020, 40(5): 1650−1655XIE D H, LI J F, LIU D, et al. An improved Hodrick-Prescott decomposition based near-infrared adaptive denoising method[J]. Spectroscopy and Spectral Analysis, 2020, 40(5): 1650−1655 [20] 汤铎铎. 三种频率选择滤波及其在中国的应用[J]. 数量经济技术经济研究, 2007, 24(9): 144−156 doi: 10.3969/j.issn.1000-3894.2007.09.014TANG D D. Three frequency selective filters and their applications in China[J]. The Journal of Quantitative & Technical Economics, 2007, 24(9): 144−156 doi: 10.3969/j.issn.1000-3894.2007.09.014 [21] 谢冰, 蔡洋萍. 基于HP滤波−生产函数方法的我国潜在产出估计[J]. 湖南大学学报:社会科学版, 2012, 26(2): 65−69XIE B, CAI Y P. Estimating the potential output by combing the Hodrick-Prescott filtering with a production function approach[J]. Journal of Hunan University:Social Sciences, 2012, 26(2): 65−69 [22] QIAN L, CHEN X H, GAO Y W, et al. Quantifying the impacts of waterlogging on cotton at different growth stages: a case study in Hubei Province, China[J]. Agronomy Journal, 2021, 113(2): 1831−1851 doi: 10.1002/agj2.20523 [23] 高雅文, 邓可楠, 张月, 等. 基于农业旱涝指标的湖北省棉花生育期内旱涝急转特征分析[J]. 灌溉排水学报, 2021, 40(2): 101−110GAO Y W, DENG K N, ZHANG Y, et al. Using agro-meteorological indexes to analyze variation in abrupt drought-flooding alternation during cotton growth season in Hubei Province[J]. Journal of Irrigation and Drainage, 2021, 40(2): 101−110 [24] 王桂芝, 陆金帅, 陈克垚, 等. 基于HP滤波的气候产量分离方法探讨[J]. 中国农业气象, 2014, 35(2): 195−199 doi: 10.3969/j.issn.1000-6362.2014.02.012WANG G Z, LU J S, CHEN K Y, et al. Exploration of method in separating climatic output based on HP filter[J]. Chinese Journal of Agrometeorology, 2014, 35(2): 195−199 doi: 10.3969/j.issn.1000-6362.2014.02.012 [25] 于文金, 周鸿渐, 占达颖, 等. 长江流域旱涝灾害特征研究[J]. 灾害学, 2013, 28(3): 42−47 doi: 10.3969/j.issn.1000-811X.2013.03.009YU W J, ZHOU H J, ZHAN D Y, et al. Characteristic research on drought and flood disasters in the Yangtze River Basin[J]. Journal of Catastrophology, 2013, 28(3): 42−47 doi: 10.3969/j.issn.1000-811X.2013.03.009 [26] 刘凯文, 苏荣瑞, 耿一风, 等. 考虑生育期需水量的荆州棉花旱涝等级划分方法[J]. 中国农业气象, 2014, 35(3): 317−322 doi: 10.3969/j.issn.1000-6362.2014.03.013LIU K W, SU R R, GENG Y F, et al. Drought and flood grades classification considering water demand at each growth stage of cotton in Jingzhou[J]. Chinese Journal of Agrometeorology, 2014, 35(3): 317−322 doi: 10.3969/j.issn.1000-6362.2014.03.013 [27] 别墅, 王孝刚, 张教海, 等. 湖北省棉花产业链发展现状与展望[J]. 中国棉花, 2011, 38(11): 7−14 doi: 10.3969/j.issn.1000-632X.2011.11.002BIE S, WANG X G, ZHANG J H, et al. The status and developmental tendency of cotton industry chain in Hubei Province[J]. China Cotton, 2011, 38(11): 7−14 doi: 10.3969/j.issn.1000-632X.2011.11.002 [28] 钱龙, 王修贵, 罗文兵, 等. 棉花先涝后渍减产规律分析及排水指标确定[J]. 农业工程学报, 2015, 31(13): 89−97 doi: 10.11975/j.issn.1002-6819.2015.13.013QIAN L, WANG X G, LUO W B, et al. Yield reduction analysis and determination of drainage index in cotton under waterlogging followed by submergence[J]. Transactions of the Chinese Society of Agricultural Engineering, 2015, 31(13): 89−97 doi: 10.11975/j.issn.1002-6819.2015.13.013 [29] 岳伟, 曹雯, 姚筠, 等. 安徽省沿江地区棉花生长季气候变化特征及其对产量的影响[J]. 长江流域资源与环境, 2014, 23(9): 1308−1314 doi: 10.11870/cjlyzyyhj201409018YUE W, CAO W, YAO Y, et al. Climate changes in cotton growing season along the Yangtze River in Anhui Province and its influence on cotton yield[J]. Resources and Environment in the Yangtze Basin, 2014, 23(9): 1308−1314 doi: 10.11870/cjlyzyyhj201409018 -

 下载:
下载:


 点击查看大图

计量
- 文章访问数: 281
- HTML全文浏览量: 89
- PDF下载量: 35
- 被引次数: 0
