

-
摘要: 尽管农业直接消耗能源带来的碳排放量有限, 但农业的生产和消费方式发生很大变化, 农业产业链不断延长, 整个农业食物系统的能源消耗及其产生的碳排放不断增加, 不容忽视。为了科学核算农业食物系统的能源消耗带来的碳排放量, 本文基于1997—2018年投入产出表和分行业能源消耗量数据, 利用投入产出法核算了农业食物系统转型过程中能源活动的碳排放量的变化趋势和构成。该方法的优点是不仅核算了农业食物系统直接消耗能源所产生的碳排放, 而且估算了整个产业链由于使用中间投入品而带来的间接能源消耗产生的排放量, 使得核算更加全面。研究发现: 2018年, 农业食物系统的直接和间接消耗能源产生的碳排放高达6.7亿t, 远高于农业直接能源消耗产生的碳排放量(1.0亿t)。1997—2018年, 农业食物系统的能源消耗带来的碳排放量呈增长趋势, 与1997年的5.3亿t相比, 2018年增长26.4%, 但其年均增长速率(1.1%)低于非农业食物系统6.3%, 因此, 农业食物系统能源活动碳排放量占中国能源活动碳排放总量的比重显著下降, 从16.3%下降到6.4%。食品加工业是农业食物系统能源活动中最主要排放来源, 2018年占农业食物系统能源活动碳排放量的62.7%。由于能源利用效率的提高, 农业能源活动的碳排放量虽呈下降趋势, 但仍是农业食物系统能源活动中第二大排放来源; 与农业相关的批发零售、运输仓储和餐饮等行业碳排放量及比重不断增加。因此, 应从产业链各环节减排、加快食品加工业低碳低耗发展、促进农业绿色发展、优化能源结构等方面助力实现减排。Abstract: Energy consumption and carbon emissions from all sectors have increased over the past four decades. Climate change caused by carbon emissions from energy activities poses a serious risk to humans. Although carbon emissions from the direct energy consumption of agriculture are limited, agricultural production modes and consumption patterns are undergoing significant changes. The extension of the supply chain has resulted in an increase in energy consumption and carbon emissions. To estimate the carbon emissions from agrifood systems, this study used the input-output tables from 1997 to 2018 and the data of energy consumption by sector in China to estimate the carbon emissions and analyze its trends, components, and characteristics based on the input-output model. The most prominent advantage of this model is that it not only captures the carbon emissions from direct energy use, but also includes the carbon emissions from indirect energy use due to the production of intermediate inputs. This study had several findings. First, with China’s economic development, total energy consumption increased 2.2 times from 1.5 billion tons in 2000 to 4.7 billion tons of standard coal in 2018. The energy consumption of the agriculture and food processing industry has increased from 42.3 million tons and 39.2 million tons of standard coal in 2000 to 87.8 million tons and 75.1 million tons of standard coal in 2018, respectively. Second, carbon emissions from energy use in agrifood systems and non-agrifood systems have increased from 530.0 million tons and 2.7 billion tons in 1997 to 670.0 million and 9.7 billion tons in 2018, respectively. However, the growth rate of agrifood systems (1.1%) was much lower than that of non-agrifood systems (6.3%); therefore, the share of agrifood systems in the total carbon emissions from energy use declined from 16.3% in 1997 to 6.4% in 2018. Third, the food processing industry’s carbon emissions have increased significantly and have become the most important carbon emission source in agrifood systems, with 420.0 million tons accounting for 62.7% of the carbon emissions from energy activities in the agrifood systems in 2018. Carbon emissions from agriculture-related transportation and storage, wholesale and retail, and catering have continued to rise. In 2018, the total carbon emissions were 73.58 million tons, contributing to 11.1% of the carbon emissions of the energy activities in the agrifood systems. The carbon emissions from agricultural energy use showed a downward trend owing to the improvement in energy efficiency; however, this was still the second largest carbon emission source. The carbon emissions in 2018 were 170 million tons, accounting for 26.2% of the carbon emissions from energy activities in agrifood systems. Based on these results, policy suggestions are provided, such as reducing emissions from the supply chain, accelerating the development of low carbon emissions and low energy consumption in the food processing industry, promoting agricultural green development, and optimizing the energy structure to help to reduce carbon emissions.
-
Key words:
- Agrifood systems /
- Energy consumption /
- Carbon emissions /
- Input-output model
-

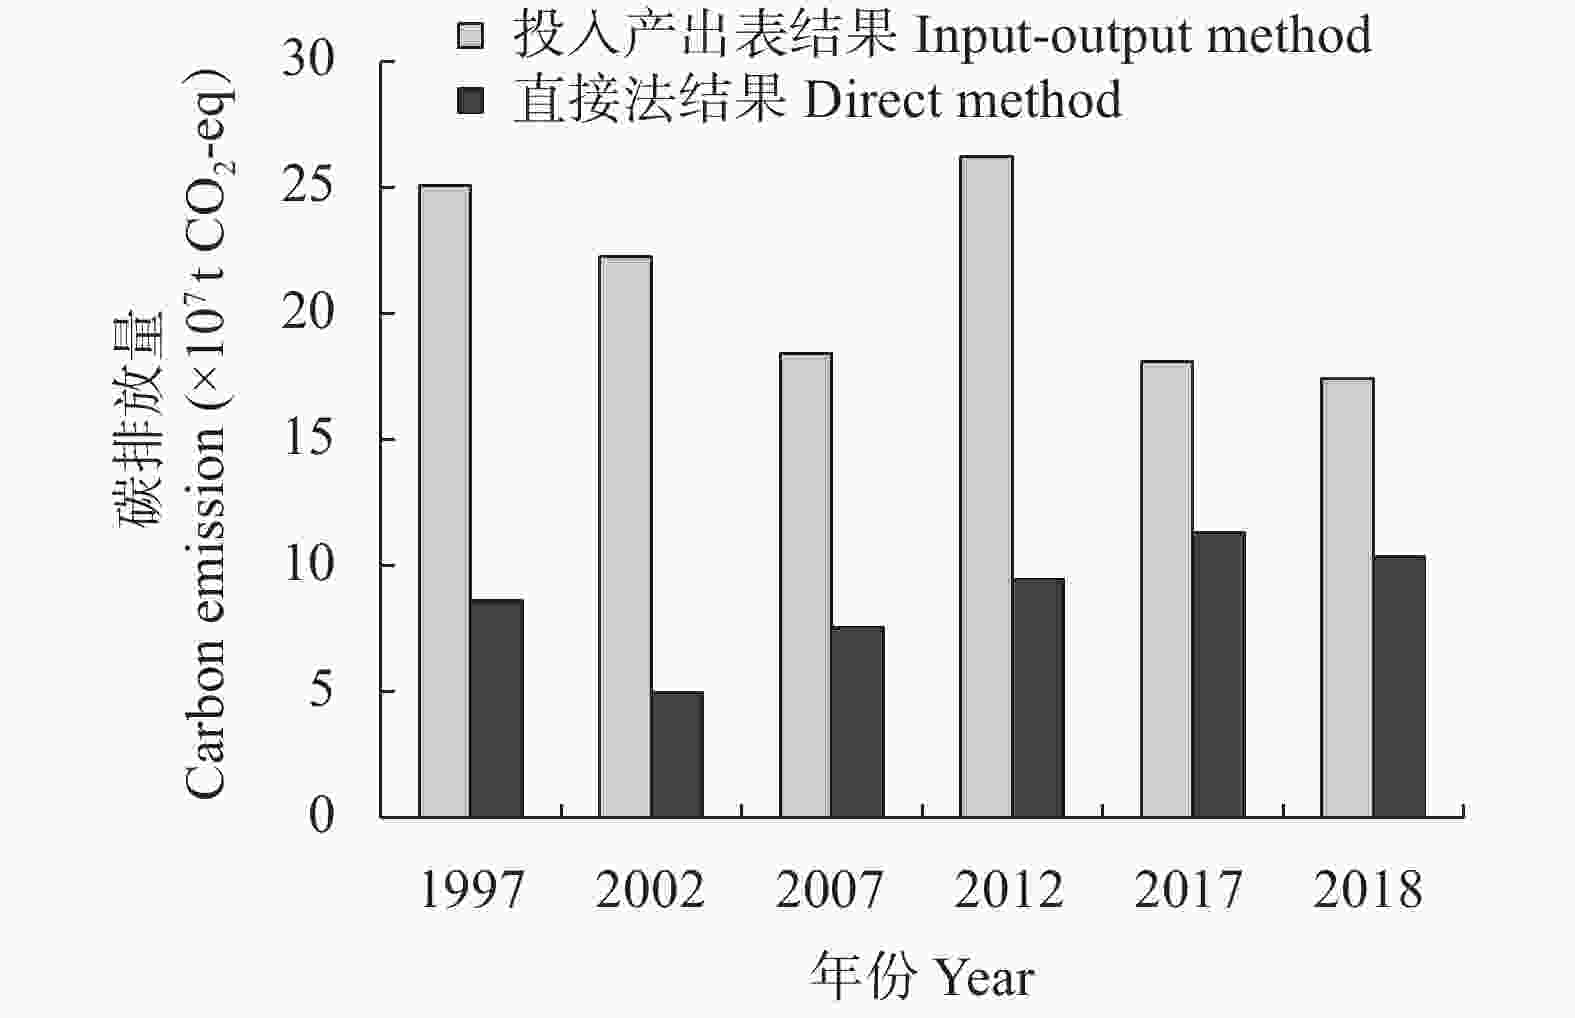
图 2 1997—2018年投入产出法和直接法计算的农业生产活动的能源碳排放量
Figure 2. Carbon emissions of agricultural energy consumption using input-output method and direct method from 1997 to 2018
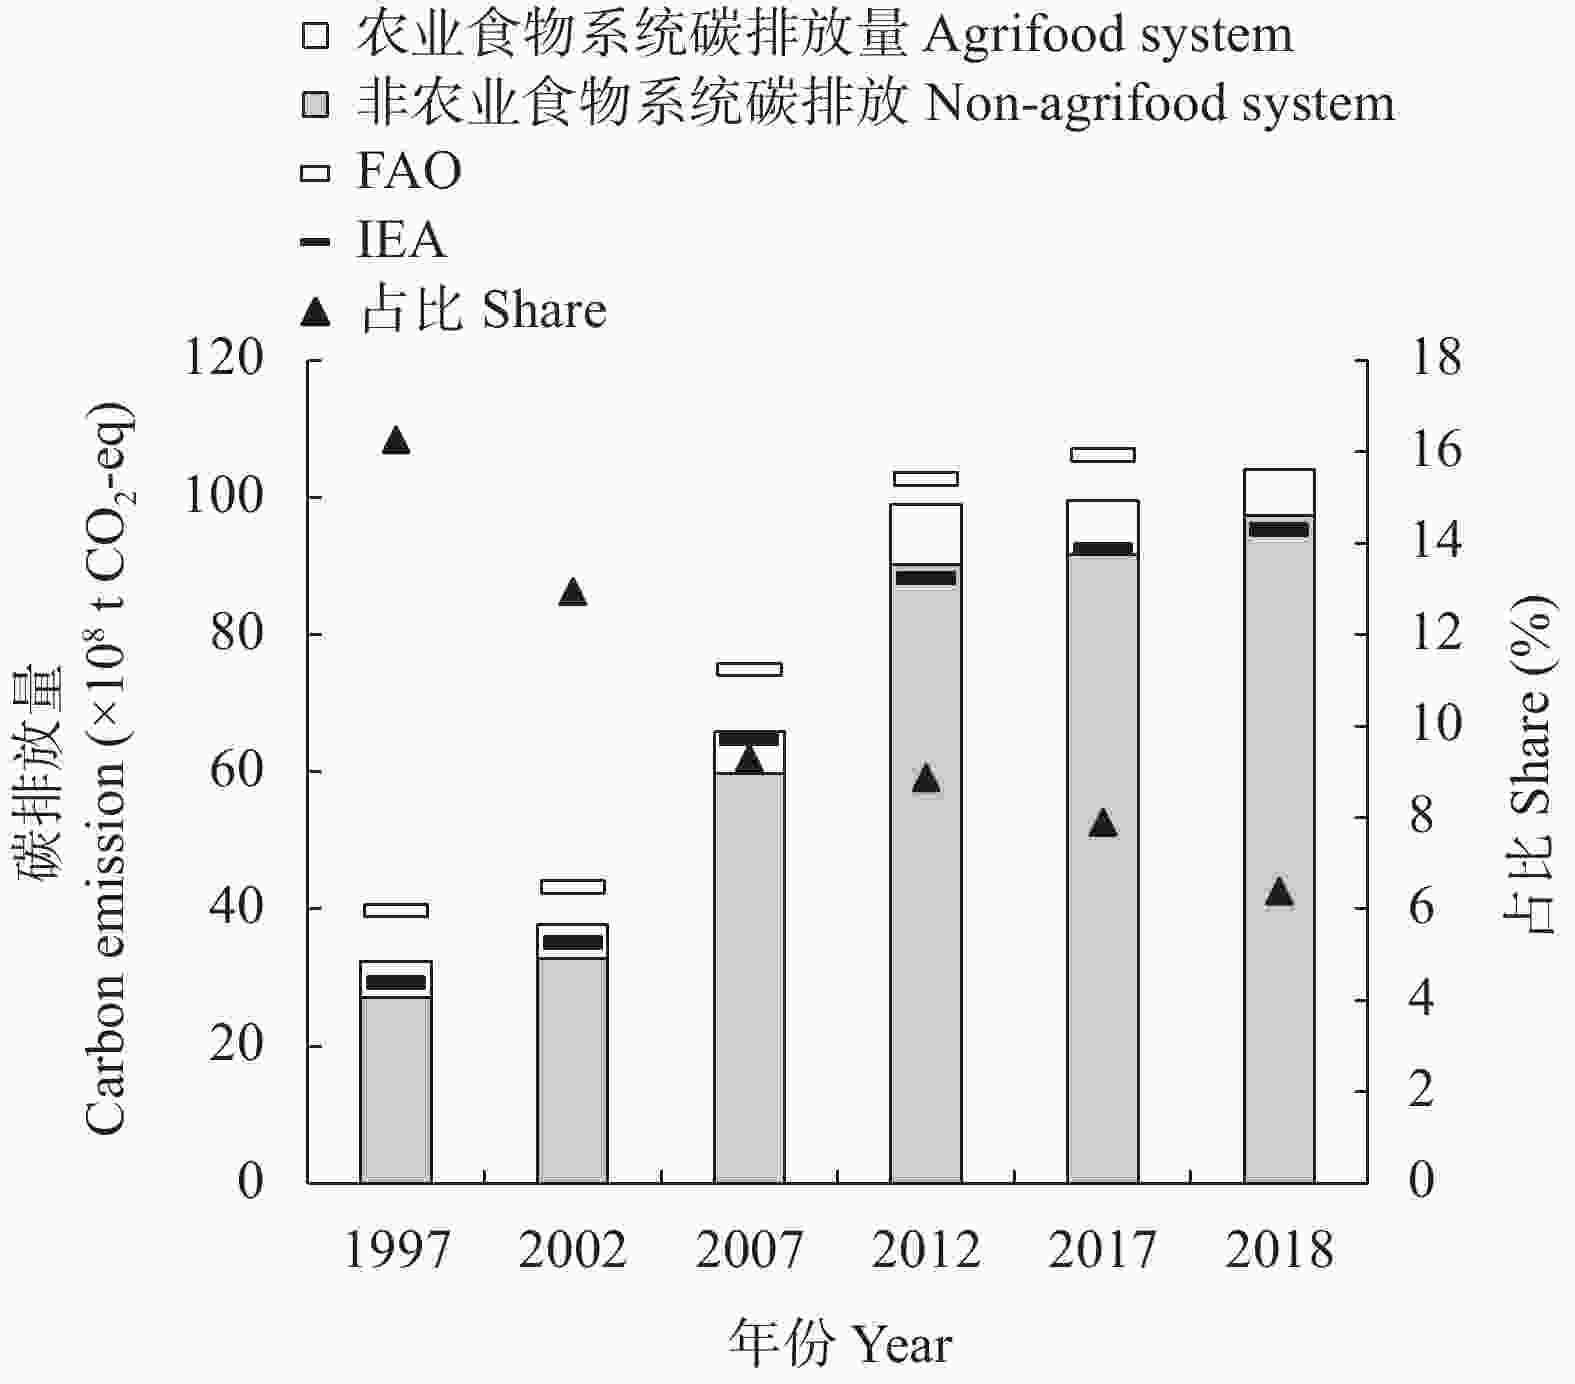
图 3 1997—2018年中国能源活动碳排放量
FAO: 联合国粮农组织数据; IEA: 国际能源署数据; 占比指农业食物系统能源活动碳排放量占能源活动碳排放总量的比重。
Figure 3. Carbon emissions from energy use in China during 1997−2018
FAO: data of Food and Agriculture Organization of the United Nations; IEA: data of International Energy Agency; Share: percentage of carbon emissions from energy activities in the agrifood systems to the total carbon emissions from energy activities.
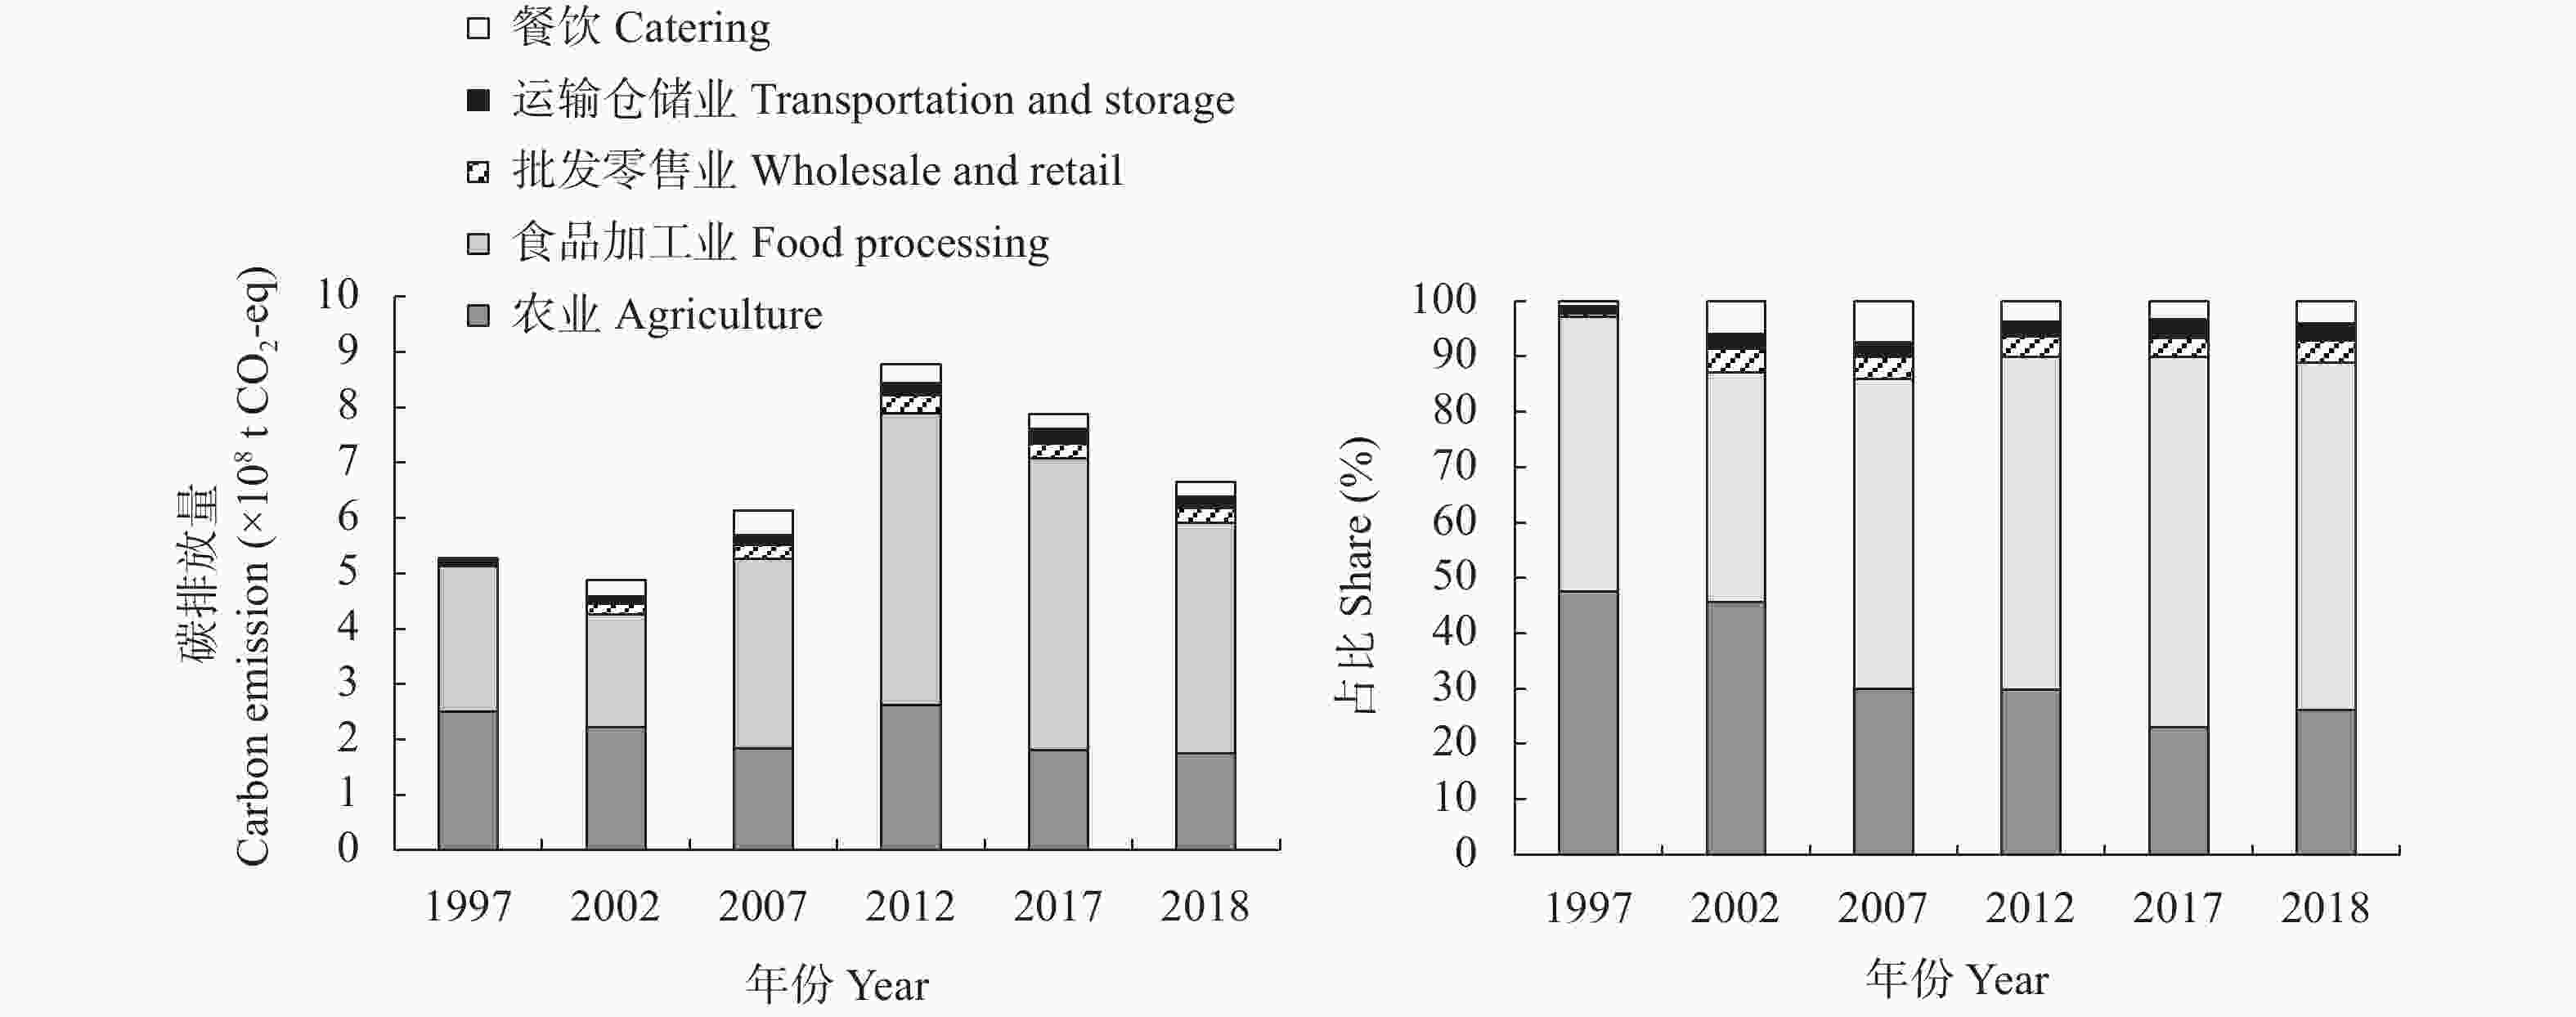
图 4 1997—2018年中国农业食物系统能源活动碳排放量(a)和结构(b)
Figure 4. Carbon emissions from agrifood systems (a) and its structure (b) in China during 1997−2018
表 1 1997—2018年农业和食品加工业消耗的能源及结构
Table 1. Energy consumption and structure of agricultural and food processing industries in China from 1997 to 2018
能源
Energy农业 Agriculture 食品加工业 Food processing 1997 2002 2007 2012 2017 2018 1997 2002 2007 2012 2017 2018 消耗量 Consumption [×104 t (standard coal)] 原油 Crude oil 0 0 0 0 0 0 2 2 1 0 0 0 燃料油 Fuel oil 4 1 1 3 2 1 45 39 54 21 10 7 汽油 Petrol 285 149 254 284 338 358 108 139 48 75 46 28 煤油 Coal oil 2 2 1 2 2 7 2 1 2 0 0 0 煤 Coal 1508 669 1085 1619 2024 1688 23 20 27 10 5 4 焦炭 Coke 141 72 56 56 37 100 30 32 16 14 137 134 柴油 Diesel oil 1583 1193 1776 1946 2254 2139 86 111 147 132 86 64 天然气
Natural gas0 0 0 0 0 0 423 419 364 445 382 364 电力 Electricity 804 745 1080 1244 1444 1528 367 524 1065 1404 1460 1552 占比 Proportion (%) 原油 Crude oil 0.0 0.0 0.0 0.0 0.0 0.0 0.2 0.1 0.1 0.0 0.0 0.0 燃料油 Fuel oil 0.1 0.0 0.0 0.1 0.0 0.0 4.2 3.1 3.1 1.0 0.5 0.3 汽油 Petrol 6.6 5.3 6.0 5.5 5.5 6.1 9.9 10.8 2.8 3.6 2.1 1.3 煤油 Coal oil 0.0 0.1 0.0 0.0 0.0 0.1 0.1 0.1 0.1 0.0 0.0 0.0 煤 Coal 34.9 23.6 25.5 31.4 33.2 29.0 2.1 1.5 1.6 0.5 0.2 0.2 焦炭 Coke 3.2 2.5 1.3 1.1 0.6 1.7 2.8 2.5 0.9 0.7 6.4 6.2 柴油 Diesel oil 36.6 42.2 41.7 37.8 36.9 36.8 8.0 8.6 8.5 6.3 4.1 3.0 天然气
Natural gas0.0 0.0 0.0 0.0 0.0 0.0 38.9 32.6 21.1 21.1 18.0 16.9 电力 Electricity 18.6 26.3 25.5 24.1 23.8 26.3 33.8 40.7 61.8 66.8 68.7 72.1 数据来源: 《中国能源统计年鉴》。Source: China Energy Statistical Yearbook.  下载: 导出CSV
表 2 2002—2018年农业食物系统各部门能源利用效率
Table 2. Efficiency of energy utilization of agrifood systems by subsectors in China from 2000 to 2018
部门 Sector 2002 2007 2012 2017 2018 t(standard coal)∙(104¥)−1(GDP) 全部行业 All sectors 1.20 1.30 1.07 0.86 0.83 农业 Agriculture 0.22 0.32 0.26 0.25 0.24 食品加工业 Food processing — 0.56 0.45 0.33 0.36 交通运输仓储 Transportation and storage 1.35 1.80 0.93 2.20 2.24 批发零售业和住宿餐饮业 Wholesale, retail and catering 1.91 0.33 0.54 0.32 0.31 根据《中国能源统计年鉴》中分行业能源消耗量与《中国统计年鉴》中GDP整理得到, GDP为2005年可比价。The value is calculated by using the data of energy use of subsectors from China Energy Statistical Yearbook and the GDP from the China Statistical Yearbook. GDP is adjusted by comparable prices in 2005.
下载: 导出CSV
-
[1] IPCC. Summary for Policymakers[M]//Climate Change 2021: The Physical Science Basis. Contribution of Working Group Ⅰ to the Sixth Assessment Report of the Intergovernmental Panel on Climate Change. Cambridge: Cambridge University Press, 2021 [2] CAMPANHOLA C, PANDEY S. Sustainable Food and Agriculture — An Integrated Approach. 2019[M]. The Food and Agriculture Organization of the United Nations (FAO). Elsevier Inc., 2019 [3] BRAUN VON J, AFSANAK, FORSCO, et al. Food Systems — Definition, Concept and Application for the UN Food Systems Summit[EB/OL]. United Nations Food Systems Summit 2021 Scientific Group. 2018. https://www.un.org/en/food-systems-summit/leadership#scientific-group [4] 金书秦, 林煜, 牛坤玉. 以低碳带动农业绿色转型: 中国农业碳排放特征及其减排路径[J]. 改革, 2021(5): 29−37JIN S Q, LIN Y, NIU K Y. Driving green transformation of agriculture with low carbon: Characteristics of agricultural carbon emissions and its emission reduction path in China[J]. Reform, 2021(5): 29−37 [5] 孙世芳. 以低碳带动农业绿色转型[N]. 经济日报, 2021-11-03(11)SUN S F. Driving green transformation of agriculture with low carbon[N]. Economic Daily, 2021-11-03(11) [6] CRIPPA M, SOLAZZO E, GUIZZARDI D, et al. Food systems are responsible for a third of global anthropogenic carbon emissions[J]. Nature Food, 2021, 2(3): 198−209 doi: 10.1038/s43016-021-00225-9 [7] POORE J, NEMECEK T. Reducing food’s environmental impacts through producers and consumers[J]. Science, 2018, 360(6392): 987−992 doi: 10.1126/science.aaq0216 [8] ROSENZWEIG C, MBOW C, BARIONI L G, et al. Climate change responses benefit from a global food system approach[J]. Nature Food, 2020, 1(2): 94−97 doi: 10.1038/s43016-020-0031-z [9] CAO S Y, XIE G D, ZHEN L. Total embodied energy requirements and its decomposition in China’s agricultural sector[J]. Ecological Economics, 2010, 69(7): 1396−1404 doi: 10.1016/j.ecolecon.2008.06.006 [10] SONG F, REARDON T, TIAN X, et al. The energy implication of China’s food system transformation[J]. Applied Energy, 2019, 240: 617−629 doi: 10.1016/j.apenergy.2019.02.069 [11] LEONTIEF W. Environmental repercussions and the economic structure: an input-output approach[J]. The Review of Economics and Statistics, 1970, 52(3): 262 doi: 10.2307/1926294 [12] SU B, ANG B W, LI Y Z. Input-output and structural decomposition analysis of Singapore’s carbon emissions[J]. Energy Policy, 2017, 105: 484−492 doi: 10.1016/j.enpol.2017.03.027 [13] ZHU B Z, SU B, LI Y Z. Input-output and structural decomposition analysis of India’s carbon emissions and intensity, 2007/08-2013/14[J]. Applied Energy, 2018, 230: 1545−1556 doi: 10.1016/j.apenergy.2018.09.026 [14] LI Y Z, SU B, DASGUPTA S. Structural path analysis of India’s carbon emissions using input-output and social accounting matrix frameworks[J]. Energy Economics, 2018, 76: 457−469 doi: 10.1016/j.eneco.2018.10.029 [15] 杜丽娟, 马靖森, 郎鹏, 等. 中匈贸易隐含碳测算与对策分析[J]. 华北理工大学学报(社会科学版), 2021, 21(3): 130−136DU L J, MA J S, LANG P, et al. Estimation of implicit carbon in China-Hungary trade and the countermeasure analysis[J]. Journal of North China University of Science and Technology (Social Science Edition), 2021, 21(3): 130−136 [16] 冯居易, 魏修建. 基于投入产出法的中国互联网行业经济效应分析[J]. 统计与决策, 2021, 37(15): 123−127FENG J Y, WEI X J. Analysis of the economic effect of China’s internet industry based on the input-output method[J]. Statistics & Decision, 2021, 37(15): 123−127 [17] 刘宇, 吕郢康, 周梅芳. 投入产出法测算CO2排放量及其影响因素分析[J]. 中国人口·资源与环境, 2015, 25(9): 21−28 doi: 10.3969/j.issn.1002-2104.2015.09.004LIU Y, LYU Y K, ZHOU M F. Analysis on the influence factors of computing CO2 emission by input-output method[J]. China Population, Resources and Environment, 2015, 25(9): 21−28 doi: 10.3969/j.issn.1002-2104.2015.09.004 [18] YANG J, HUANG Z H, ZHANG X B, et al. The rapid rise of cross-regional agricultural mechanization services in China[J]. American Journal of Agricultural Economics, 2013, 95(5): 1245−1251 doi: 10.1093/ajae/aat027 [19] 郑志浩, 高颖, 赵殷钰. 收入增长对城镇居民食物消费模式的影响[J]. 经济学(季刊), 2016, 15(1): 263−288ZHENG Z H, GAO Y, ZHAO Y Y. Impact of income growth on food consumption patterns in urban China[J]. China Economic Quarterly, 2016, 15(1): 263−288 [20] ZHANG Y M, DIAO X S. The changing role of agriculture with economic structural change — The case of China[J]. China Economic Review, 2020, 62: 101504 doi: 10.1016/j.chieco.2020.101504 [21] 吴巧生, 陈亮, 张炎涛, 等. 中国能源消费与GDP关系的再检验−基于省际面板数据的实证分析[J]. 数量经济技术经济研究, 2008, 25(6): 27−40 doi: 10.3969/j.issn.1000-3894.2008.06.005WU Q S, CHEN L, ZHANG Y T, et al. Retesting the granger causality between energy consumption and GDP in China: based on the provincial panel data analysis[J]. The Journal of Quantitative & Technical Economics, 2008, 25(6): 27−40 doi: 10.3969/j.issn.1000-3894.2008.06.005 -

 下载:
下载:


 点击查看大图

计量
- 文章访问数: 865
- HTML全文浏览量: 171
- PDF下载量: 160
- 被引次数: 0
