

Cotton mega-environment investigation and test environment evaluation for the national cotton variety trials in the northwest inland cotton production region
-
摘要: 在农作物多环境品种试验中基因型与环境互作(GE)现象是普遍存在的, 品种生态区划分和试验环境评价与选择是提高品种选择效率的有效方法。西北内陆棉区是我国目前最重要的主产棉区, 探索该棉区棉花品种生态区划分和品种试验环境科学评价与选择, 有利于试验环境资源的合理利用和棉花品种试验效率的提升。本研究基于2011—2020年西北内陆棉区国家棉花品种区域试验产量数据, 采用LG双标图和GGE双标图方法探索了试验环境间的相关性模式, 并对各试验环境的代表性、鉴别力和理想指数进行了综合评价。结果表明: 1) LG双标图揭示了西北内陆早熟棉区除乌苏外的沙湾、五家渠、奎屯、石河子、敦煌、博乐和精河等试点均属于同一品种生态区; 南疆早中熟棉区除麦盖提外的巴州、阿拉尔、莎车、库车、拜城、库尔勒和图木舒克等试点属于同一品种生态区。2)各试验环境的鉴别力差异不显著, 而早熟棉区的乌苏试点和早中熟棉区的麦盖提点的代表性及理想指数显著差于其余试点, 其他试点间的差异不显著。3)早熟棉区各试验环境依据理想指数的综合优劣排序为沙湾>精河>五家渠>敦煌>博乐>石河子>奎屯>乌苏, 早中熟棉区各试验环境的理想指数综合优劣排序为巴州>图木舒克>阿拉尔>库尔勒>莎车>拜城>库车>麦盖提。可见, 乌苏和麦盖提点在品种试验方案优化中应当考虑更换, 以提高试验的总体效率。本研究充分展示了LG双标图和GGE双标图在区域试验环境评价中的应用效果, 为西北内陆棉区棉花品种试验方案优化提供了理论依据, 也可为其他作物和其他目标区域的类似研究提供参考。Abstract: Plant breeding has played a key role in increasing agricultural productivity and meeting the increasing needs of the world, while the prevalence of genotype-by-environment interaction (GE) in multi-year, multi-location variety trials impedes variety selection and application efficiency. The Northwest Inland Cotton Production Region (NICPR) is currently the most important cotton-growing region, occupying more than 80% of the total cotton acreage in China. Therefore, mega-environment (ME) investigation and test environment evaluation are beneficial for the rational utilization of experimental resources and the improvement of the efficiency of cotton variety trials conducted in the NICPR. The objective of the present study was to demonstrate the application efficiency of the existing genotype main effect plus GE (GGE) biplot and a newly proposed location grouping (LG) biplot in exploring ME and comprehensively evaluating test environments using identification ability, representativeness, and desirability index based on the lint cotton yield of national cotton variety trials in the NICPR from 2011 to 2020. (1) The LG biplot revealed that the majority of test environments, including Shawan, Wujiaqu, Kuytun, Shihezi, Dunhuang, Bole and Jinghe, belonged to the same ME and suitably represented the targeting early-maturing cotton production region, while the test environment Usu was delineated out as an outlier of the early-maturing cotton ME. The test environment Makit in the medium-early maturing ME was also identified as an outlier in the southern Xinjiang cotton growing region, while the other test environments covering Bazhou, Alaer, Shache, Kuqa, Baicheng, Korla, and Tumxuk were all positively correlated and suitably represented the medium-early maturing ME. (2) The differences in identification ability among all test environments were not significant at P>5% level. The representativeness and desirability of Usu and Markit displayed significant differences from other test locations in the same ME, while the differences among other test locations were not significant. (3) According to the desirability index, the comprehensive ordination of the test environments in the early maturing cotton region was ranked as Shawan > Jinghe > Wujiaqu > Dunhuang > Bole > Shihezi > Kuytun > Usu. Similarly, on the basis of the desirability index, the ordination of test locations in the medium-early maturing cotton region was listed as Bazhou > Tumxuk > Alaer > Korla > Shache > Baicheng > Kuqa > Makit. It was clear that Usu and Makit should be removed from cotton variety trial scheme optimization for test efficiency improvement. The results of the study not only presented the highly efficient function of LG and GGE biplots in test environment evaluation in cotton variety trials in the NICPR and provided a theoretical basis for the optimization of the cotton regional trial schemes in Northwest Inland, but they also set a good example for future application in similar studies on other crops for other target crop growing regions.
-


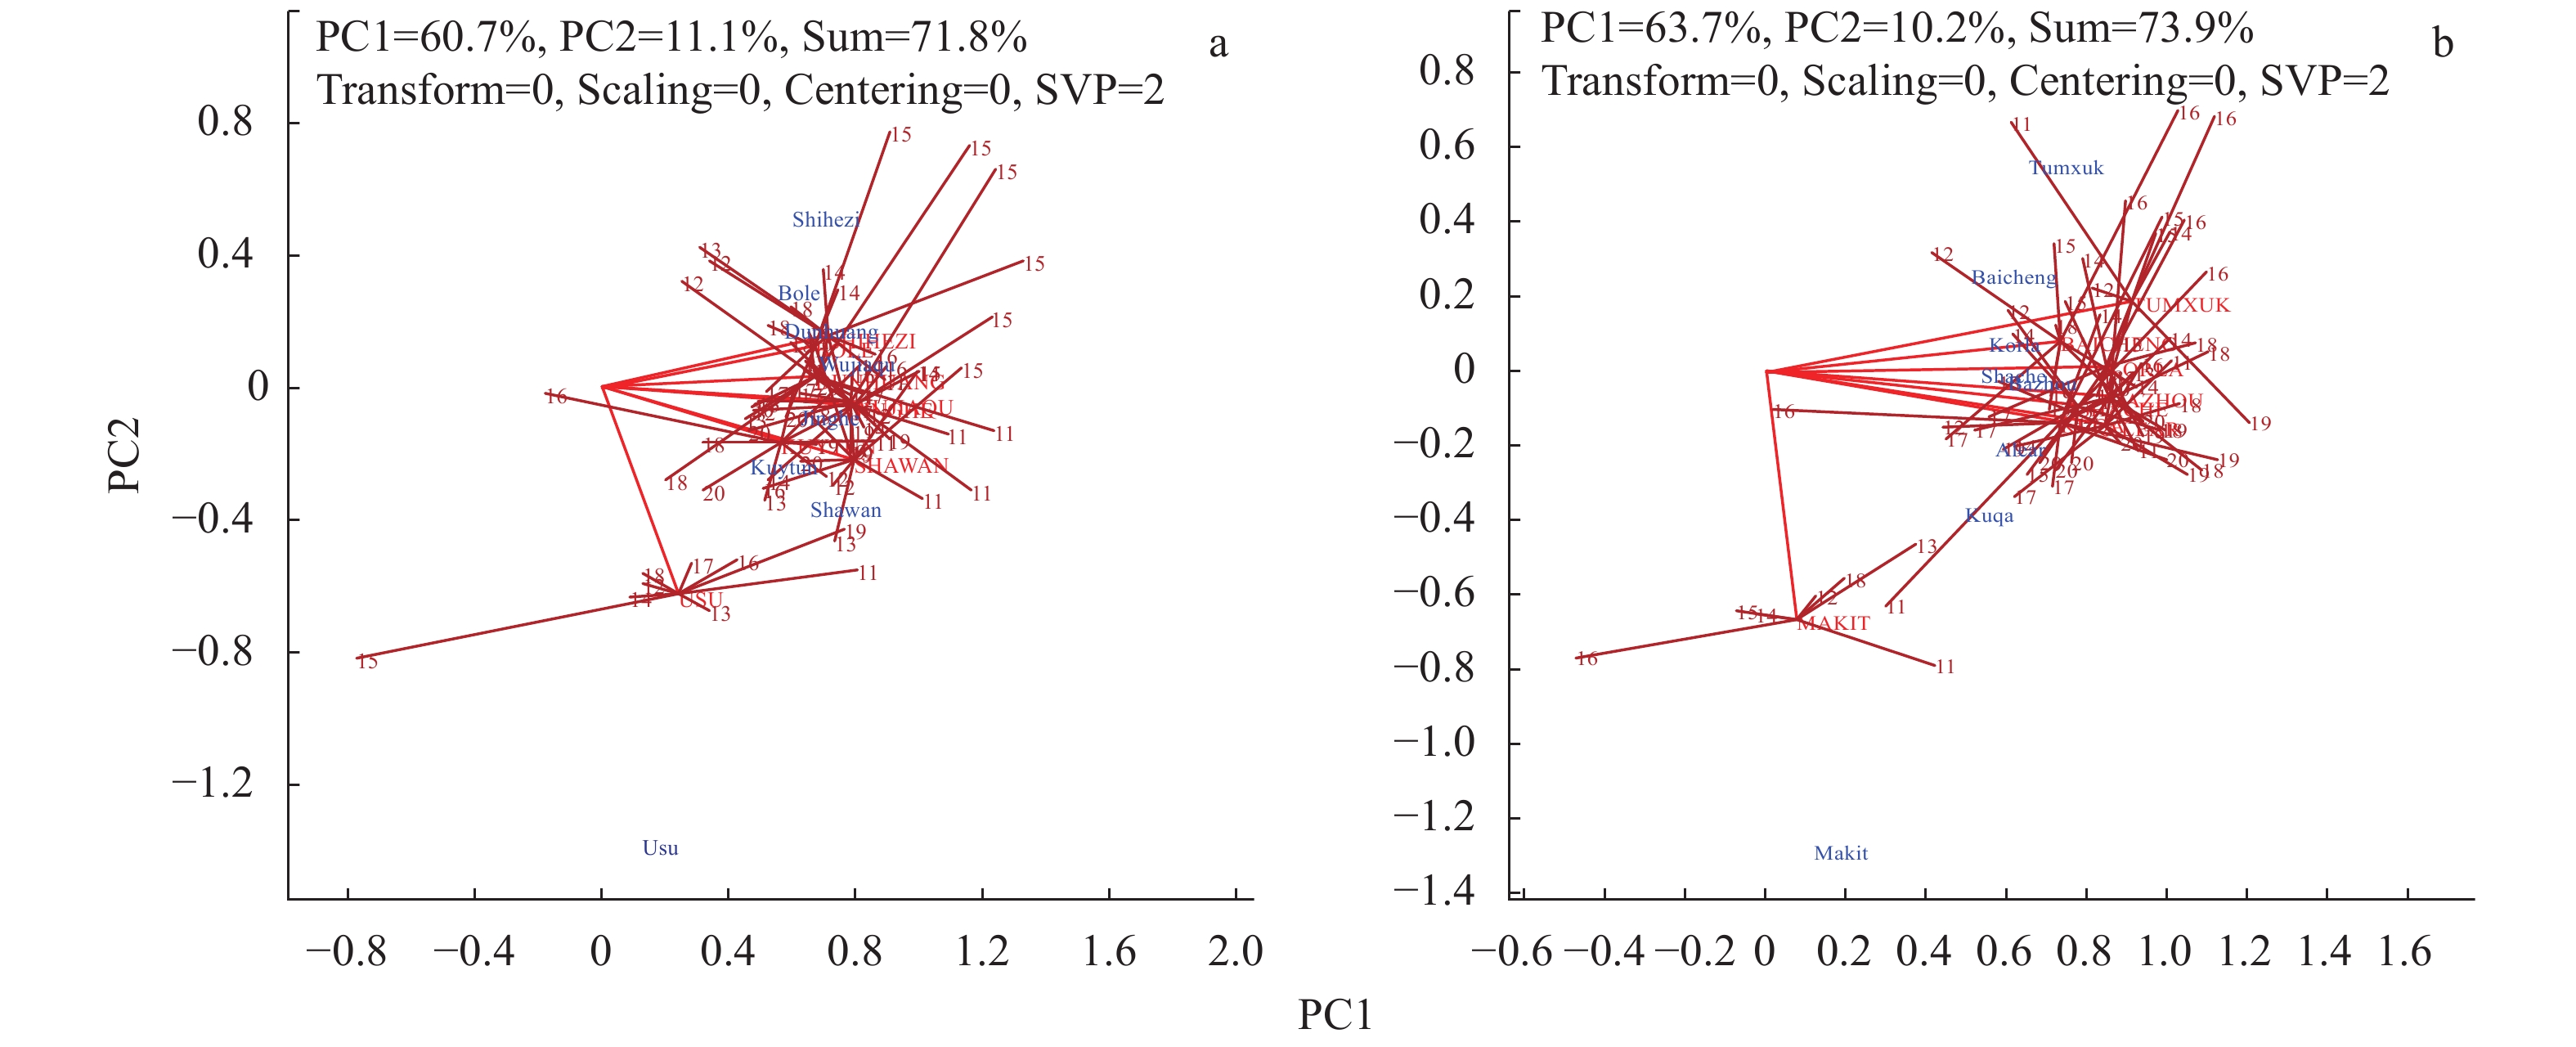
图 1 2011—2020年西北内陆棉区早熟组(a)和早中熟组(b)棉花品种区域试验的LG双标图
试点图标由各年份试验的平均坐标表示。例如“USU”坐标是2011—2020年期间乌苏点8年试验的平均值; 连接乌苏(USU)的数字表示年份, 如USU-15表示乌苏点2015年的试验结果。试点名称详见表1。
Figure 1. Location-grouping (LG) biplots of the early-maturing group (a) and medium-early maturing group (b) of cotton variety trials in the Northwest Inland cotton production region in 2011−2020
The placement of a location is determined by the mean coordinates of all trials conducted at the locations. For example, the placement of “USU” is determined by the placements of the eight trials conducted at Usu during 2011−2020; date linked with it is the trail year, for example, USU-15 is the trial in Usu in 2015. See Table 1 for the detailed names of the locations.

图 2 2013年西北内陆棉区早中熟组棉花区试点“鉴别力与代表性”GGE双标图
带*号前缀蓝色图标, 如*Hcm9和*Zms49等为参试品种名称; 红色字母带前缀“+”号的图标为试点名称, 如+Makit和+Alaer等, 试点名称详见表1。Marks in blue prefixed with asterisk are tested varieties, such as *Hcm9 and *Zms49. Marks in red prefixed with plus sign “+” are the test locations, such as +Makit, +Alaer, et al, which are shown in Table 1.
Figure 2. “Discrimination and representativeness” view of the GGE biplot for the medium-early maturing cotton trial dataset in the Northwest Inland cotton production region in 2013
表 1 2011—2020年西北内陆国家棉花品种区域试验环境的地理因子
Table 1. Geographical factors of trial environments in the national cotton variety trials in the Northwest Inland cotton production region in 2011−2020
棉区
Cotton growing region试验环境
Trial environment经度
Longitude纬度
Latitude海拔
Altitude (m)土壤类型
Soil type试验年限
Test years早熟棉区
Early-maturing cotton region博乐 Bole 83°50′ 44°57′ 501 沙壤土 Sandy loam 7 (2014—2020) 敦煌 Dunhuang 94°42′ 40°11′ 1139 灌淤土 Cumulated irrigated soil 9 (2011—2018, 2020) 精河 Jinghe 82°57′ 44°39′ 320 沙壤土 Sandy loam 8 (2011—2016, 2018—2019) 沙湾 Shawan 85°35′ 44°50′ 457 沙壤土 Sandy loam 10 (2011—2020) 五家渠 Wujiaqu 87°34′ 44°10′ 552 灰漠土 Desert grey soil 10 (2011—2020) 奎屯 Kuytun 84°54′ 44°26′ 461 黏壤土 Clay loam 10 (2011—2020) 石河子 Shihezi 86°20′ 44°20′ 443 草甸土 Meadow soil 10 (2011—2020) 乌苏 Usu 84°19′ 44°25′ 479 沙壤土 Sandy loam 9 (2011—2019) 早中熟棉区
Medium-early maturing cotton region阿拉尔 Alaer 82°40′ 41°30′ 1011 沙壤土 Sandy loam 9 (2011—2014, 2016—2020) 图木舒克 Tumxuk 79°10′ 39°90′ 1098 沙壤土 Sandy loam 10 (2011—2020) 巴州 Bazhou 86°70′ 41°44′ 1500 草甸土 Meadow soil 10 (2011—2020) 库车 Kuqa 82°54′ 41°21′ 1099 沙壤土 Sandy loam 10 (2011—2020) 莎车 Shache 77°20′ 38°40′ 1236 沙壤土 Sandy loam 10 (2011—2020) 麦盖提 Makit 77°70′ 38°90′ 1180 灌淤土 Cumulated irrigated soil 7 (2011—2016, 2018) 拜城 Baicheng 81°53′ 41°48′ 1240 沙壤土 Sandy loam 9 (2012—2020) 库尔勒 Korla 86°16′ 41°20′ 936 沙壤土 Sandy loam 6 (2014, 2016—2020)  下载: 导出CSV
表 2 2011—2020年西北内陆棉区早熟组棉花品种皮棉产量的试验环境间相关系数
Table 2. Average Pearson correlation coefficients among test locations across tested genotypes based on the lint yield data of the early-maturing cotton variety trials in the Northwest Inland cotton production region in 2011−2020
试验环境
Test location博乐
Bole敦煌
Dunhuang精河
Jinghe奎屯
Kuytun沙湾
Shawan石河子
Shihezi乌苏
Usu五家渠
Wujiaqu平均值
Average博乐 Bole 1.000 0.265a 敦煌 Dunhuang 0.424 1.000 0.266a 精河 Jinghe 0.317 0.297 1.000 0.336a 奎屯 Kuytun 0.205 0.240 0.356 1.000 0.221a 沙湾 Shawan 0.296 0.267 0.425 0.272 1.000 0.351a 石河子 Shihezi 0.431 0.269 0.370 0.138 0.414 1.000 0.275a 乌苏 Usu −0.042 0.052 0.084 0.102 0.278 −0.021 1.000 0.084b 五家渠 Wujiaqu 0.217 0.351 0.488 0.244 0.486 0.360 0.088 1.000 0.322a “平均值”列数据后不同小写字母表示P<0.05水平差异显著。Different lowercase letters in the “Average” column mean significant differences at P<0.05 level.
下载: 导出CSV
表 3 2011—2020年西北内陆棉区早中熟组棉花品种试验环境间平均相关系数矩阵
Table 3. Average Pearson correlation coefficients among test locations across tested genotypes based on the lint yield data of the medium-early maturing cotton variety trials in the Northwest Inland cotton production region in 2011−2020
试验环境
Test location阿拉尔
Alaer巴州
Bazhou拜城
Baicheng库车
Kuqa库尔勒
Korla麦盖提
Makit莎车
Shache图木舒克
Tumxuk平均值
Average阿拉尔 Alaer 1.000 0.352a 巴州 Bazhou 0.293 1.000 0.274a 拜城 Baicheng 0.490 0.300 1.000 0.348a 库车 Kuqa 0.355 0.363 0.491 1.000 0.342a 库尔勒 Korla 0.295 0.356 0.304 0.305 1.000 0.283a 麦盖提 Makit 0.135 −0.147 0.062 −0.236 −0.048 1.000 −0.035b 莎车 Shache 0.351 0.249 0.308 0.377 0.319 0.124 1.000 0.314a 图木舒克 Tumxuk 0.469 0.394 0.463 0.450 0.370 −0.239 0.436 1.000 0.352a “平均值”列数据后不同小写字母表示P<0.05水平差异显著。Different lowercase letters in the “Average” column mean significant differences at P<0.05 level.
下载: 导出CSV
表 4 2013年西北内陆棉区早中熟组国家棉花品种区域试验环境评价参数
Table 4. Standardized trial location evaluation parameters based on “discrimination and representativeness” GGE biplot for the medium-early maturing cotton trial dataset in the Northwest Inland national cotton production region in 2013
试验环境 Test location 鉴别力 Discriminating ability 代表性 Representativeness 理想指数 Desirability index 阿拉尔 Alaer 0.893 0.479 0.428 拜城 Baicheng 0.583 0.903 0.526 巴州 Bazhou 1.052 0.938 0.987 库车 Kuqa 1.267 0.938 1.188 麦盖提 Makit 1.435 0.411 0.590 莎车 Shache 1.331 0.999 1.330 图木舒克 Tumxuk 1.279 0.998 1.276
下载: 导出CSV
表 5 2011—2020年西北内陆棉区国家棉花品种区域试验环境综合评价参数
Table 5. Standardized trial location evaluation parameters based on “discrimination and representativeness” GGE biplot for the Northwest Inland national cotton variety trials from 2011 to 2020
棉区
Cotton production region试验环境
Test location鉴别力
Discriminating ability代表性
Representativeness理想指数
Desirability index早熟棉区
Early-maturing cotton
production region博乐 Bole 0.882±0.10a 0.725±0.05ab 0.654±0.09ab 敦煌 Dunhuang 0.923±0.03a 0.711±0.11ab 0.667±0.11ab 精河 Jinghe 0.814±0.02a 0.882±0.06a 0.723±0.06ab 奎屯 Kuytun 0.907±0.02a 0.619±0.18ab 0.582±0.16ab 沙湾 Shawan 0.837±0.07a 0.877±0.04a 0.731±0.07a 石河子 Shihezi 0.851±0.02a 0.729±0.1ab 0.622±0.09ab 乌苏 Usu 0.800±0.08a 0.484±0.17b 0.422±0.14b 五家渠 Wujiaqu 0.857±0.07a 0.831±0.06a 0.704±0.08ab 早中熟棉区
Medium-early maturing cotton
production region阿拉尔 Alaer 0.820±0.08a 0.851±0.06a 0.704±0.09a 拜城 Baicheng 0.920±0.03a 0.711±0.08a 0.657±0.08a 巴州 Bazhou 0.817±0.03a 0.924±0.02a 0.757±0.03a 库尔勒 Korla 0.815±0.11a 0.805±0.08a 0.684±0.12a 库车 Kuqa 0.872±0.03a 0.696±0.15a 0.627±0.13a 麦盖提 Makit 0.939±0.02a 0.105±0.12b 0.109±0.11b 莎车 Shache 0.835±0.07a 0.804±0.06a 0.683±0.08a 图木舒克 Tumxuk 0.817±0.07a 0.862±0.07a 0.705±0.08a 同列数据后同一棉区不同小写字母表示P<0.05水平差异显著。Different lowercase letters for the same cotton production region in the same column mean significant differences among different trail environments at P<0.05 level.
下载: 导出CSV
-
[1] 黄滋康, 崔读昌. 中国棉花生态区划[J]. 棉花学报, 2002, 14(3): 185−190 doi: 10.3969/j.issn.1002-7807.2002.03.014HUANG Z K, CUI D C. Ecological regionalization of cotton production in China[J]. Acta Gossypii Sinica, 2002, 14(3): 185−190 doi: 10.3969/j.issn.1002-7807.2002.03.014 [2] GIAUFFRET C, LOTHROP J, DORVILLEZ D, et al. Genotype × environment interactions in maize hybrids from temperate or highland tropical origin[J]. Crop Science, 2000, 40(4): 1004−1012 doi: 10.2135/cropsci2000.4041004x [3] HAUSSMANN B I G, HESS D E, REDDY B V S, et al. Pattern analysis of genotype × environment interaction for Striga resistance and grain yield in African Sorghum trials[J]. Euphytica, 2001, 122(2): 297−308 doi: 10.1023/A:1012909719137 [4] YAN W K, HUNT L A. Interpretation of genotype × environment interaction for winter wheat yield in Ontario[J]. Crop Science, 2001, 41(1): 19−25 doi: 10.2135/cropsci2001.41119x [5] 许乃银, 金石桥, 李健. 利用GGE双标图划分我国棉花纤维品质生态区[J]. 应用生态学报, 2017, 28(1): 191−198XU N Y, JIN S Q, LI J. Ecological regionalization of national cotton fiber quality in China using GGE biplot analysis method[J]. Chinese Journal of Applied Ecology, 2017, 28(1): 191−198 [6] 许乃银, 李健. 我国主产棉区棉花纤维品质性状的区域分布特征[J]. 中国生态农业学报, 2016, 24(11): 1547−1554XU N Y, LI J. Regional distribution characteristics of cotton fiber quality in main cotton production areas in China[J]. Chinese Journal of Eco-Agriculture, 2016, 24(11): 1547−1554 [7] YAN W K, TINKER N A. Biplot analysis of multi-environment trial data: principles and applications[J]. Canadian Journal of Plant Science, 2006, 86(3): 623−645 doi: 10.4141/P05-169 [8] YAN W K, TINKER N A. An integrated biplot analysis system for displaying, interpreting, and exploring genotype × environment interaction[J]. Crop Science, 2005, 45(3): 1004−1016 doi: 10.2135/cropsci2004.0076 [9] YAN W K. GGE biplot — A windows application for graphical analysis of multienvironment trial data and other types of two-way data[J]. Agronomy Journal, 2001, 93(5): 1111−1118 doi: 10.2134/agronj2001.9351111x [10] 常磊, 柴守玺. GGE双标图在我国旱地春小麦稳产性分析中的应用[J]. 中国生态农业学报, 2010, 18(5): 988−994 doi: 10.3724/SP.J.1011.2010.00988CHANG L, CHAI S X. Application of GGE biplot in spring wheat yield stability analysis in rainfed areas of China[J]. Chinese Journal of Eco-Agriculture, 2010, 18(5): 988−994 doi: 10.3724/SP.J.1011.2010.00988 [11] 许乃银, 荣义华, 李健, 等. GGE双标图在陆地棉高产稳产和适应性分析中的应用−以长江流域棉区国审棉花新品种‘鄂杂棉30’为例[J]. 中国生态农业学报, 2017, 25(6): 884−892XU N Y, RONG Y H, LI J, et al. Evaluation of upland cotton yield stability and adaptability using GGE-biplot analysis: A case study of ‘Ezamian 30’ cotton cultivar in Yangtze River Valley[J]. Chinese Journal of Eco-Agriculture, 2017, 25(6): 884−892 [12] YAN W K. Mega-environment analysis and test location evaluation based on unbalanced multiyear data[J]. Crop Science, 2015, 55(1): 113−122 doi: 10.2135/cropsci2014.03.0203 [13] YAN W K, MITCHELL-FETCH J, BEATTIE A, et al. Oat mega-environments in Canada[J]. Crop Science, 2021, 61(2): 1141−1153 doi: 10.1002/csc2.20426 [14] 汪洲涛, 苏炜华, 阙友雄, 等. 应用AMMI和HA-GGE双标图分析甘蔗品种产量稳定性和试点代表性[J]. 中国生态农业学报, 2016, 24(6): 790−800WANG Z T, SU W H, QUE Y X, et al. Analysis of yield stability and test site representativeness of sugarcane trials using combined AMMI and HA-GGE biplot models[J]. Chinese Journal of Eco-Agriculture, 2016, 24(6): 790−800 [15] YAN W K, RAJCAN I. Biplot analysis of test sites and trait relations of soybean in Ontario[J]. Crop Science, 2002, 42(1): 11 doi: 10.2135/cropsci2002.1100 [16] YAN W K, HOLLAND J B. A heritability-adjusted GGE biplot for test environment evaluation[J]. Euphytica, 2010, 171(3): 355−369 doi: 10.1007/s10681-009-0030-5 [17] YAN W K. A systematic narration of some key concepts and procedures in plant breeding[J]. Frontiers in Plant Science, 2021, 12: 724517 doi: 10.3389/fpls.2021.724517 [18] YAN W. LG biplot: a graphical method for mega-environment investigation using existing crop variety trial data[J]. Scientific Reports, 2019, 9: 7130 doi: 10.1038/s41598-019-43683-9 [19] 唐淑荣, 许乃银, 杨伟华, 等. 基于GGE分析的西北内陆棉区纤维品质生态区划分[J]. 中国生态农业学报, 2016, 24(12): 1674−1682TANG S R, XU N Y, YANG W H, et al. Ecological regionalization of cotton fiber quality in the Northwest Inland Region using GGE analysis[J]. Chinese Journal of Eco-Agriculture, 2016, 24(12): 1674−1682 [20] BAXEVANOS D, GOULAS C, ROSSI J, et al. Separation of cotton cultivar testing sites based on representativeness and discriminating ability using GGE biplots[J]. Agronomy Journal, 2008, 100(5): 1230−1236 doi: 10.2134/agronj2007.0363 [21] 许乃银, 张国伟, 李健, 等. 基于HA-GGE双标图的长江流域棉花区域试验环境评价[J]. 作物学报, 2012, 38(12): 2229−2236XU N Y, ZHANG G W, LI J, et al. Evaluation of cotton regional trial environments based on HA-GGE biplot in the Yangtze River Valley[J]. Acta Agronomica Sinica, 2012, 38(12): 2229−2236 [22] 许乃银, 李健, 张国伟, 等. 基于GGE双标图和马克隆值选择的棉花区域试验环境评价[J]. 中国生态农业学报, 2013, 21(10): 1241−1248 doi: 10.3724/SP.J.1011.2013.01241XU N Y, LI J, ZHANG G W, et al. Evaluation of regional cotton trial environments based on cotton fiber micronaire selection by using GGE biplot analysis[J]. Chinese Journal of Eco-Agriculture, 2013, 21(10): 1241−1248 doi: 10.3724/SP.J.1011.2013.01241 [23] 严威凯. 双标图分析在农作物品种多点试验中的应用[J]. 作物学报, 2010, 36(11): 1805−1819YAN W K. Optimal use of biplots in analysis of multi-location variety test data[J]. Acta Agronomica Sinica, 2010, 36(11): 1805−1819 [24] XU N Y, FOK M, ZHANG G W, et al. The application of GGE biplot analysis for evaluating test locations and mega-environment investigation of cotton regional trials[J]. Journal of Integrative Agriculture, 2014, 13(9): 1921−1933 doi: 10.1016/S2095-3119(13)60656-5 [25] 金石桥, 许乃银. 基于GGE双标图与纤维长度选择的棉花品种生态区探索与划分[J]. 中国农学通报, 2013, 29(33): 165−171 doi: 10.3969/j.issn.1000-6850.2013.33.029JIN S Q, XU N Y. Cotton megaenvironment investigation based on GGE biplot and fiber length selection[J]. Chinese Agricultural Science Bulletin, 2013, 29(33): 165−171 doi: 10.3969/j.issn.1000-6850.2013.33.029 [26] 许乃银, 张国伟, 李健, 等. 长江流域棉花纤维比强度选择的理想试验环境筛选[J]. 棉花学报, 2013, 25(2): 121−128 doi: 10.3969/j.issn.1002-7807.2013.02.005XU N Y, ZHANG G W, LI J, et al. Identifying ideal test environments for cotton fiber strength selection in the Yangtze River Valley[J]. Cotton Science, 2013, 25(2): 121−128 doi: 10.3969/j.issn.1002-7807.2013.02.005 [27] 许乃银, 李健. 利用GGE双标图和综合选择指数划分棉花品种生态区[J]. 中国生态农业学报, 2014, 22(9): 1113−1121XU N Y, LI J. Using GGE biplot and comprehensive selection index to investigate mega-environments of cotton cultivar[J]. Chinese Journal of Eco-Agriculture, 2014, 22(9): 1113−1121 -

 下载:
下载:


 点击查看大图

计量
- 文章访问数: 289
- HTML全文浏览量: 115
- PDF下载量: 36
- 被引次数: 0
