

Temporal and spatial characteristics of China’s provincial green total factor productivity of grains from the ecological value perspective
-
摘要: 绿色发展是我国未来粮食安全生产的重要内容, 衡量绿色生产率是探索粮食绿色增产方式的有效途径。本文在考虑粮食种植生态价值(ESV)的基础上, 运用全局要素生产率指数(GML)和超效率数据包络模型(SBM)从静态和动态两个角度切入, 测算1997—2019年中国粮食绿色全要素生产率和投入产出冗余率, 并采用空间探索性数据分析(ESDA)对粮食绿色全要素生产率的全局和局部空间特征进行研究。结果表明: 1)研究期内粮食种植生态价值降低0.39%, 由1997年的6471.57亿元下降到2019年的6446.16亿元, 损失25.41亿元, 其中东北、中部、西南地区有所提升, 而东部地区、西北地区有所下降; 2)粮食绿色全要素生产率年均增长0.60%, 由1997年的0.9754上升到2019年的1.0990, 主要由技术进步驱动(1.0308), 而技术效率(0.9973)的带动作用较弱; 3)粮食绿色全要素生产率相对有效省(市)占比从1997年的9.68%提升至2019年的67.74%, 在时空上呈现以东部为主, 并逐期向东北-中部-西北发展的格局; 4)粮食绿色全要素生产率相对无效省(市)效率损失的主要原因为第一产业从业人员、农膜使用量和碳排放量存在冗余; 5)粮食绿色全要素生产率呈现出向中部、西南部高效率区集聚的空间特征, 并且集聚程度在不断增强。基于此, 提倡要充分认识粮食生产活动的正负外部性, 严格管控农地非粮、非农化现象, 并促进先进农业技术推广及粮食绿色全要素生产率提升。
-
关键词:
- 粮食种植生态价值 /
- 粮食绿色全要素生产率 /
- 耕地非粮化 /
- 超效率SBM /
- 空间探索性数据分析(ESDA)
Abstract: Green development is important for China’s future food safety, and measuring green productivity is an effective method to explore ways to increase green grains production. Based on the differences in the endowment of cultivated land resources in different regions, this study adopted the ecological services value evaluation method to measure the ecological value of cultivated land during the process of grain production. To incorporate the nutrient pollution and non-nutrient pollution generated in the process of grain production, the global Malmquise Luenberger index and the super efficiency model were used from the static and dynamic perspectives, to calculate China’s total factor productivity and input-output redundancy rate from 1997 to 2019. To better understand the temporal and spatial changes in China’s green total factor productivity, the spatial development characteristics of the agricultural production factors were investigated in the selected six years (1997, 2001, 2005, 2009, 2013 and 2019) using the equidistant distribution method, and Moran’s I index was used to study the spatial heterogeneity and agglomeration of green total factor productivity of grains in China. The results showed that: 1) During the study period, the ecological value of grain production reduced by 0.39%, from 647.157 billion Yuan in 1997 to 644.616 billion Yuan in 2019; a loss of 2.541 billion Yuan. The ecological value in the northeast, central, and southwest regions increased, whereas that in the east and northwest regions decreased. 2) Analysis of the environmental impact of grain production showed that the traditional total factor productivity, which does not consider environmental effects, tended to ignore the positive and negative aspects of grain production and cannot accurately assess the true efficiency of China’s grain production. After accounting for environmental factors, such as the ecological value of grain production and agricultural non-point source pollution, this study found that the green total factor productivity of grains increased by 0.60% annually, from 0.9754 in 1997 to 1.0990 in 2019, driven mainly by technological progress (1.0308). The driving effect of technical efficiency (0.9973) was weak. 3) The proportion of provinces (cities) that were relatively effective in the green total factor productivity of grains increased from 9.68% in 1997 to 67.74% in 2019. In terms of time and space, the relatively effective provinces (cities) was mainly in the eastern region and then graduallydeveloped to the northeast, central, and northwest regions. 4) Due to high pollution emissions and resource consumption, the main reasons for the provinces (cities) that were relatively ineffective in green total factor productivity of grains were the redundancy of employees in the primary industry, the use of agricultural film, and carbon emissions. 5) The green total factor productivity of grains in China had a significant positive spatial correlation dominated by high-high agglomeration, and the green total factor productivity of grains showed spatial characteristics of agglomeration in the central and southwestern high-efficiency areas. The degree of agglomeration was increasing. Based on the above results, this study advocates for a better understanding of the positive and negative effects of grain production activities, strict control of the non-grain and non-agricultural phenomenon of agricultural land, and the promotion of advanced agricultural technologies to promote the green total factor productivity of grains. -

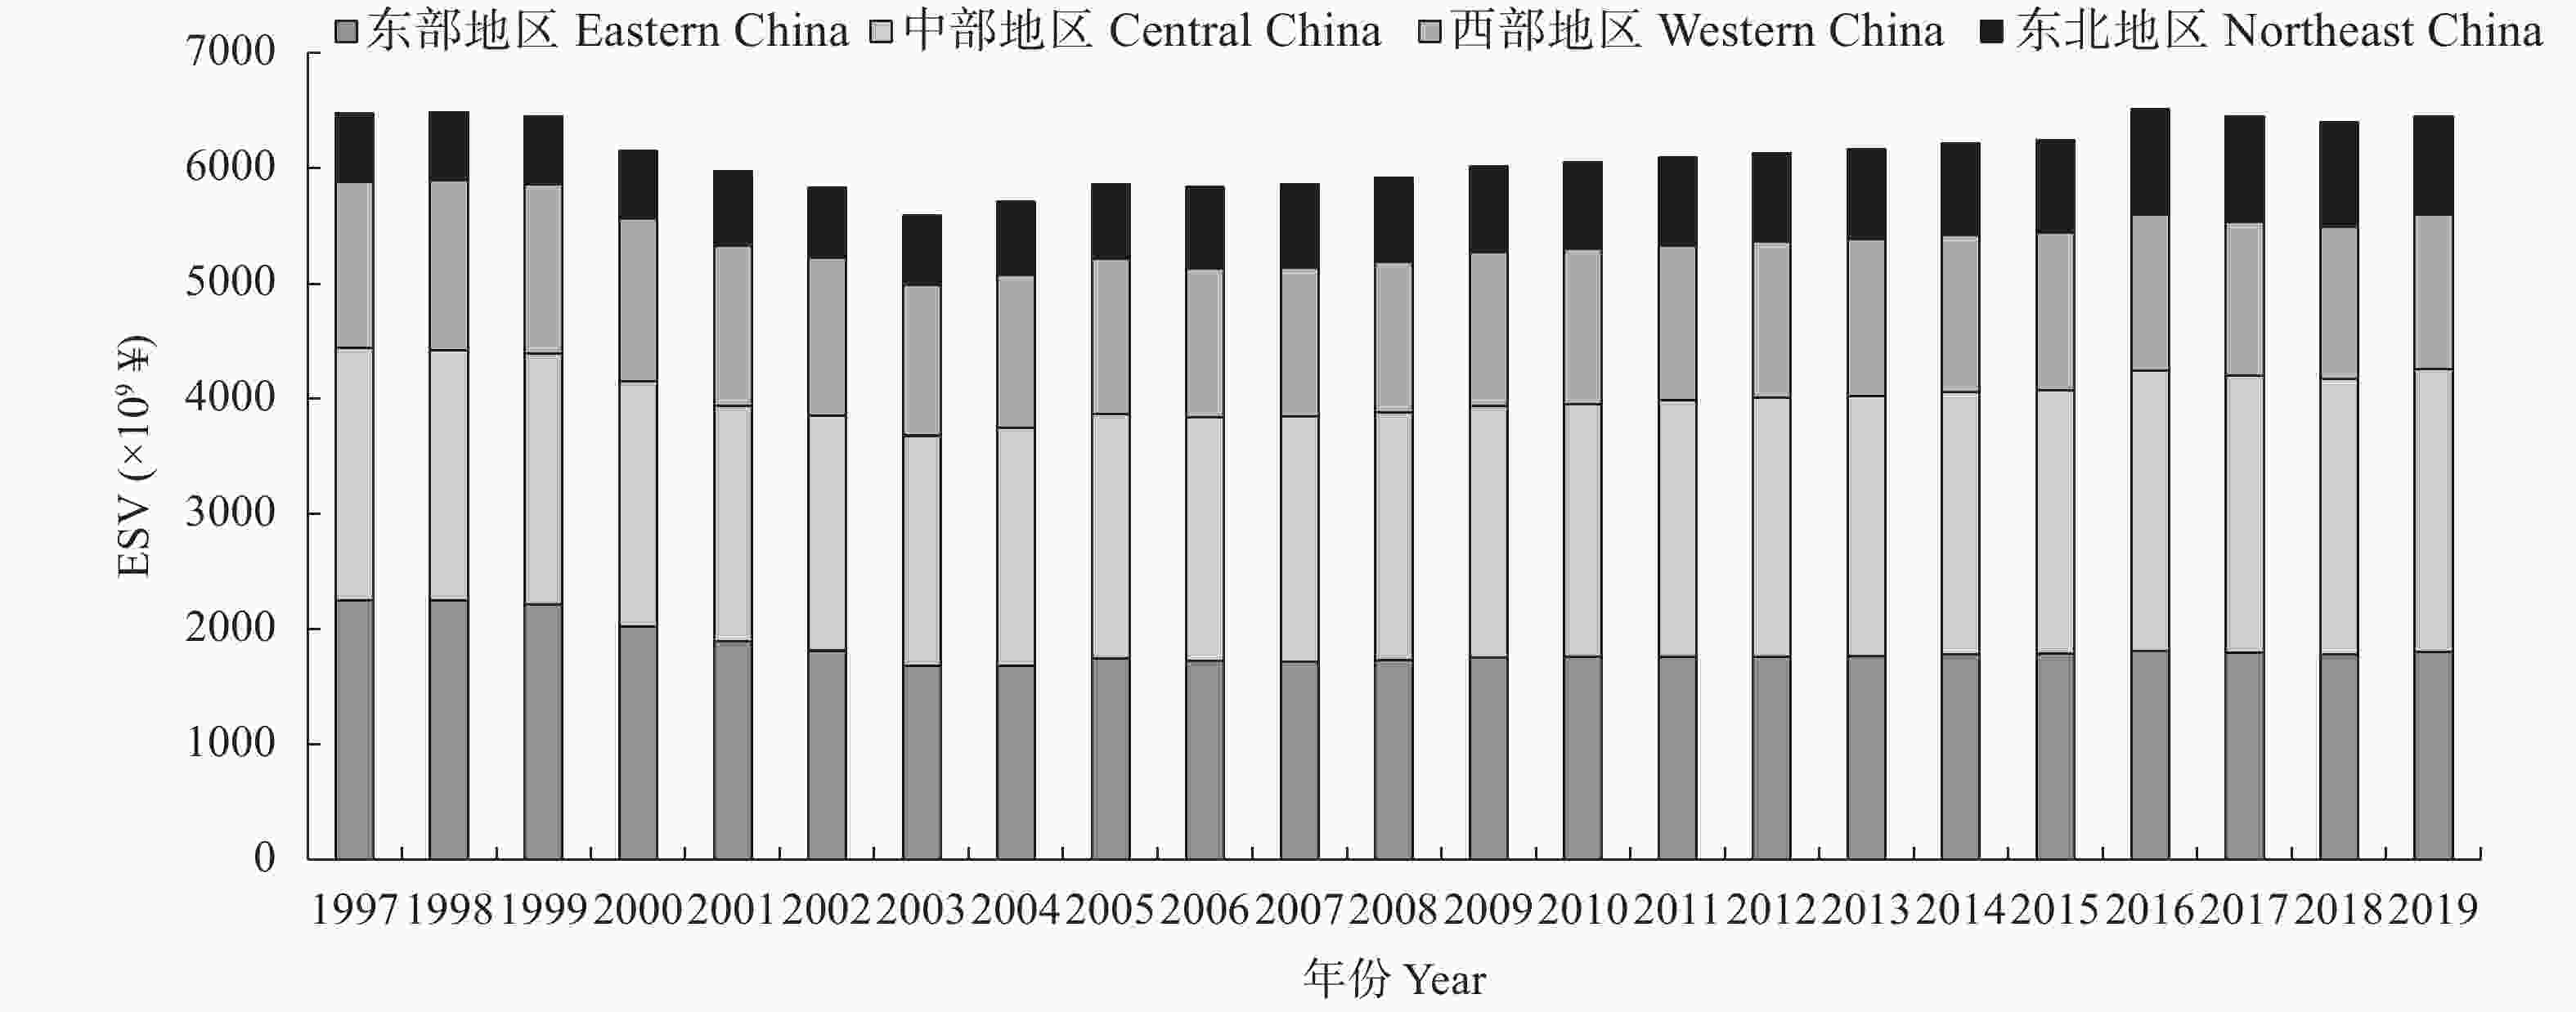
图 1 1997—2019年中国及不同区域粮种生态价值(ESV)演变情况
由于统计口径差异和数据获取问题, 本文研究区域不含中国港澳台地区。Due to the difference of statistical caliber and the problem of data acquisition, the study area does not include Hong Kong, Macao and Taiwan of China.
Figure 1. Evolution of ecological value (ESV) of grain production in different regions and whole county of China from 1997 to 2019
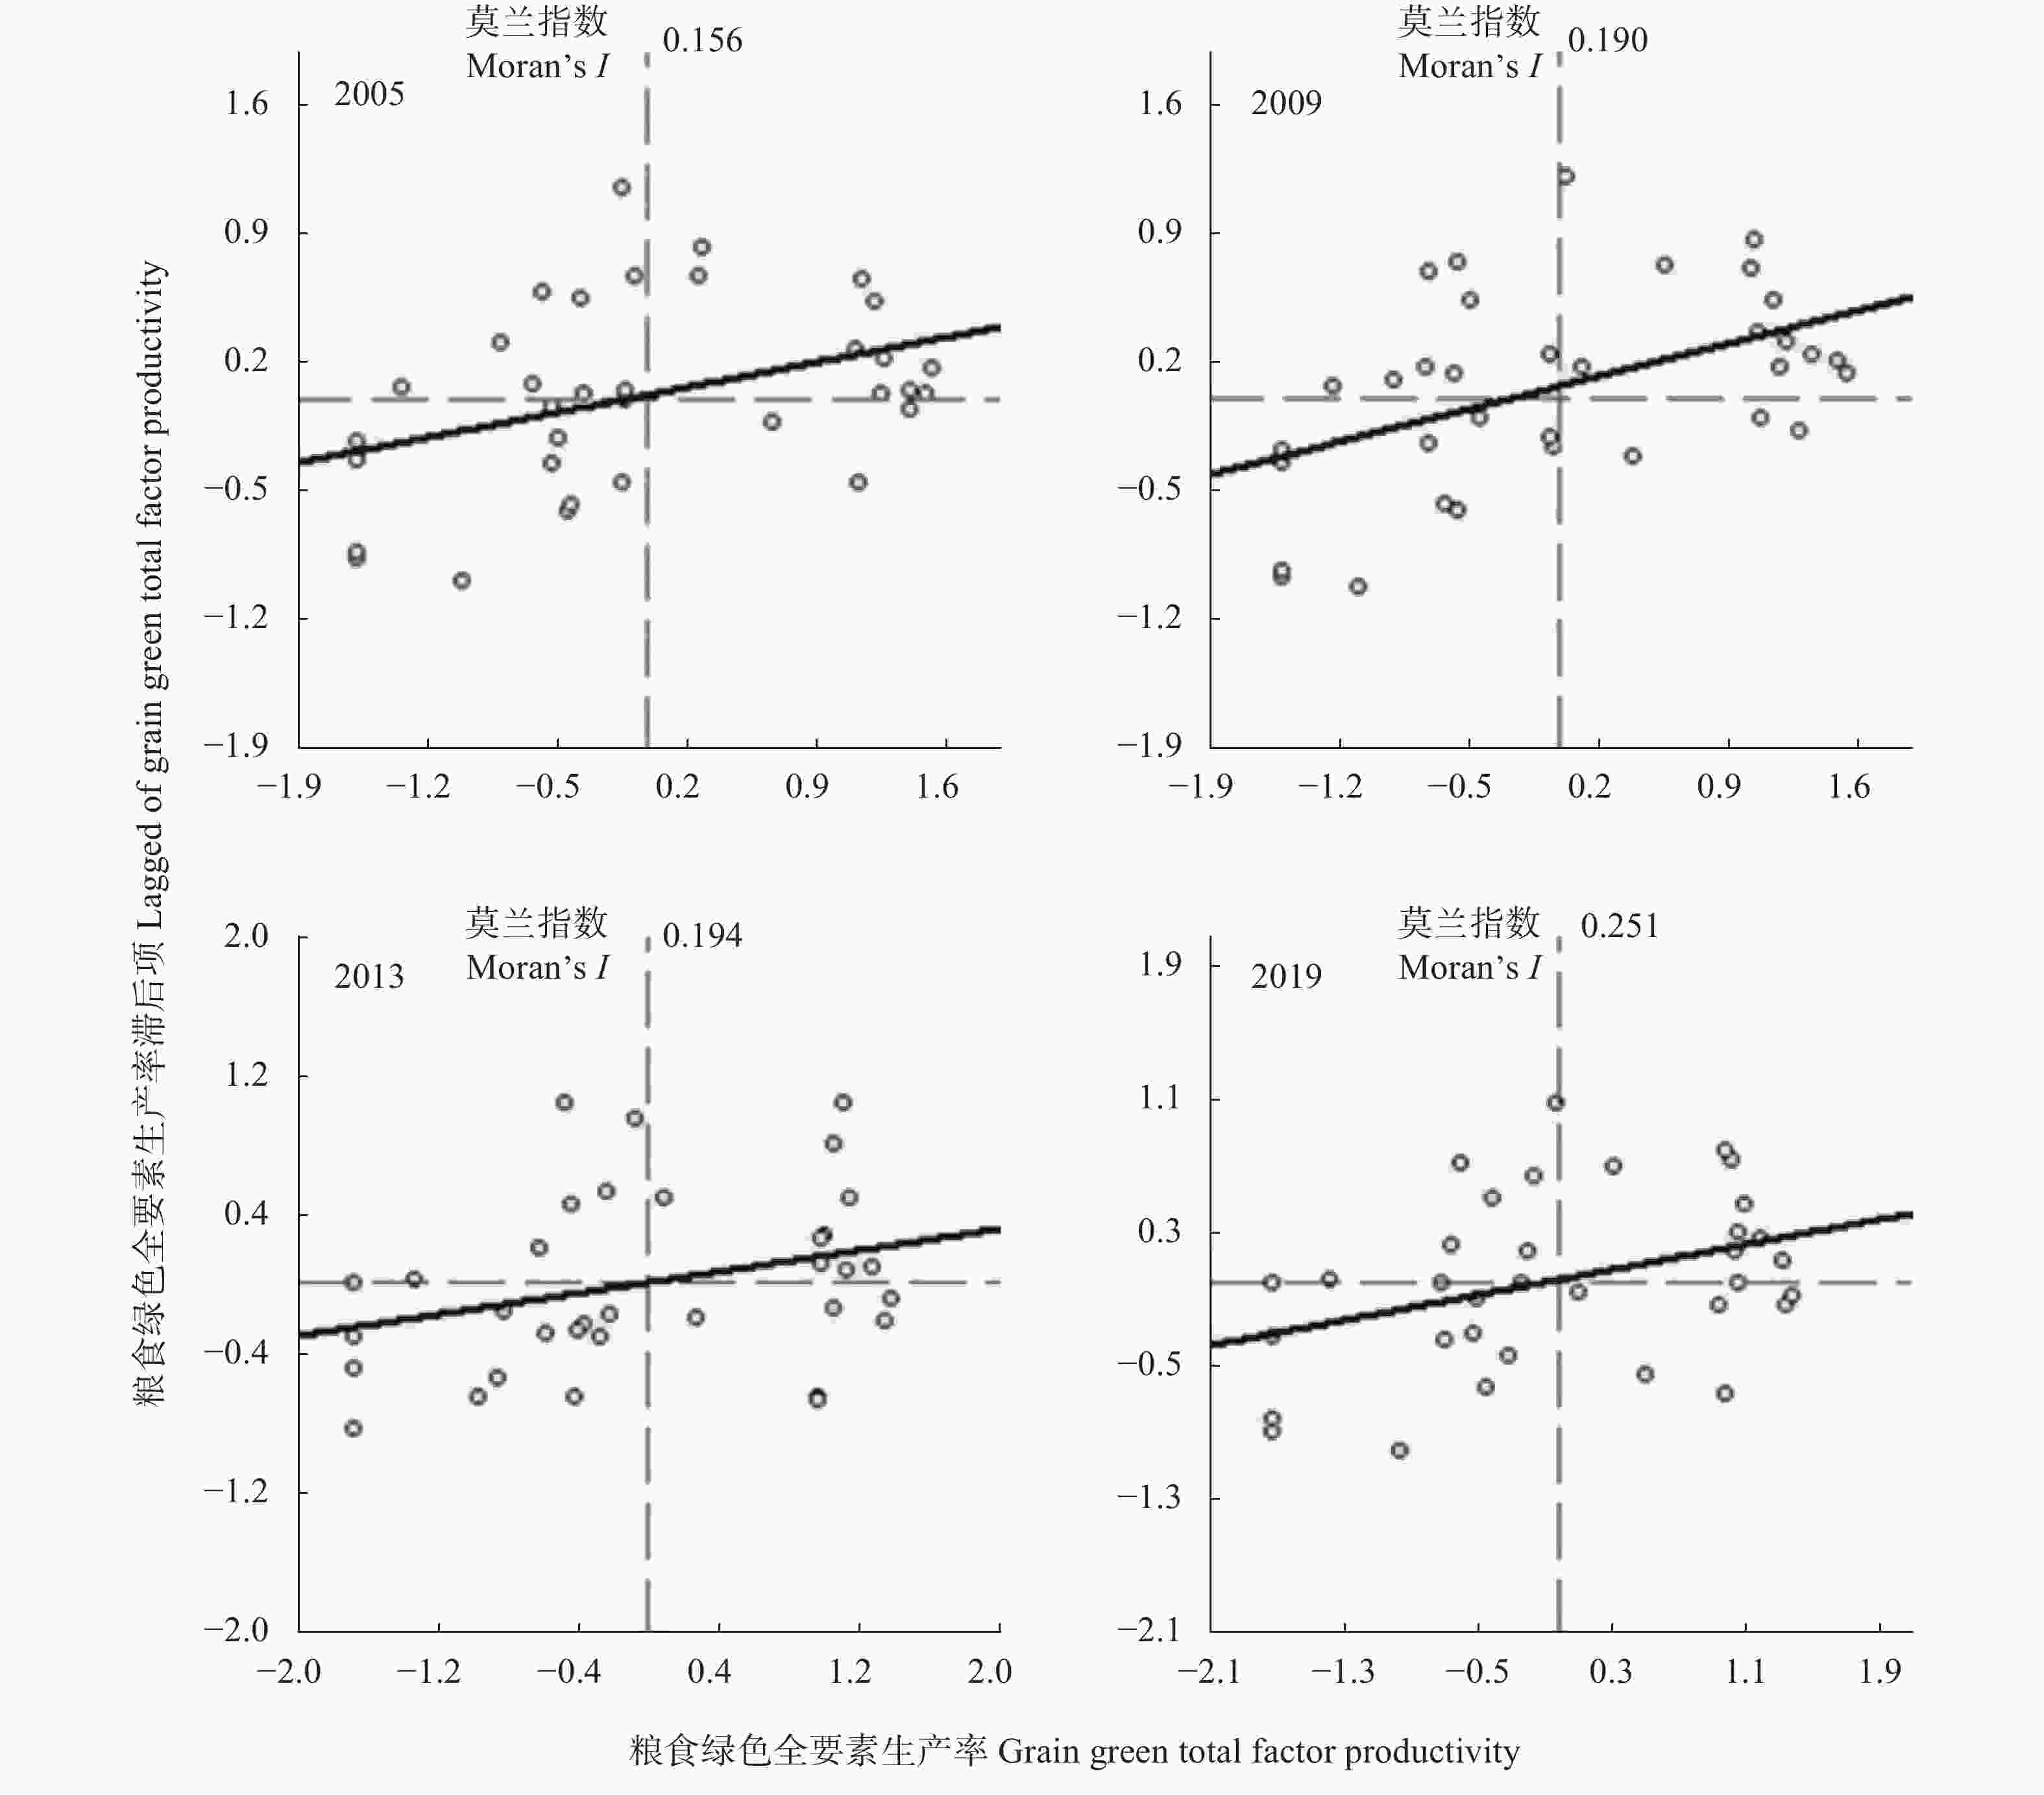
图 2 1997—2019年中国粮食绿色全要素生产率莫兰散点图
Figure 2. Moran scatter chart of grain green total factor productivity in China from 2005 to 2019
表 1 我国不同省份耕地生态系统生物量因子
Table 1. Biomass factors of cultivated land ecosystems in different provinces of China
省(市、自治区)
Province
(city, autonomous region)生物量因子
Biomass
factor省(市、自治区)
Province
(city, autonomous region)生物量因子
Biomass
factor省(市、自治区)
Province
(city, autonomous region)生物量因子
Biomass
factor北京市 Beijing City 1.04 安徽省 Anhui Province 1.17 四川省 Sichuan Province 1.35 天津市 Tianjin City 0.85 福建省 Fujian Province 1.56 贵州省 Guizhou Province 0.63 河北省 Hebei Province 1.02 江西省 Jiangxi Province 1.51 云南省 Yunnan Province 0.64 山西省 Shanxi Province 0.46 山东省 Shandong Province 1.38 西藏自治区
Tibet Autonomous Region0.75 内蒙古自治区
Inner Mongolia Autonomous Region0.44 河南省 Henan Province 1.39 陕西省 Shaanxi Province 0.51 辽宁省 Liaoning Province 0.90 湖北省 Hubei Province 1.27 甘肃省 Gansu Province 0.42 吉林省 Jilin Province 0.96 湖南省 Hunan Province 1.95 青海省 Qinghai Province 0.04 黑龙江 Heilongjiang Province 0.66 广东省 Guangdong Province 1.40 宁夏回族自治区
Ningxia Hui Autonomous Region0.64 上海市 Shanghai City 1.44 广西壮族自治区
Guangxi Zhuang Autonomous Region0.98 新疆维吾尔自治区
Xinjiang Uygur Autonomous Region0.58 江苏省 Jiangsu Province 1.74 海南省 Hainan Province 0.72 浙江省 Zhejiang Province 1.76 重庆市 Chongqing City 1.21 全国 Nationwide 1.00 由于统计口径差异和数据获取问题, 本文研究区域不含中国港澳台地区。Due to the difference of statistical caliber and the problem of data acquisition, the study area does not include Hong Kong, Macao and Taiwan of China.  下载: 导出CSV
表 2 粮食绿色全要素生产率投入-产出指标体系
Table 2. Input and output indexes system of grain green total factor productivity
指标类别 Index category 分项指标 Subindicator 具体指标 Specific indicator 投入指标 Input 劳动力投入 Labor input 第一产业从业人员 Employees in the primary industry 土地投入 Land investment 粮食作物播种面积 Sown area of grain crops 机械动力投入 Mechanical power input 农业机械总动力 Total power of agricultural machinery 农药化肥投入 Input of pesticide and fertilizer 农药使用量、化肥折纯量 Pesticide usage and chemical fertilizer conversion 产出指标 Output 期望产出 Expected output 粮食产量 Grain yield 粮种生态价值 Ecological value of grain 非期望产出 Unexpected output 农业面源污染 Agricultural non-point source pollution 碳排放量 Carbon emissions
下载: 导出CSV
表 3 1997—2017年中国各时期粮食绿色全要素生产率
Table 3. Grain green total factor productivities of China in different periods from 1997 to 2017
时期
Period技术效率
Green technology efficiency技术进步
Green technology change综合效率
Green total factor productivity时期
Period技术效率
Green technology efficiency技术进步
Green technology change综合效率
Green total factor productivity1997—1998 0.9088 1.1059 0.9754 2011—2012 0.9645 1.0472 1.0009 1998—1999 0.8772 1.0681 0.8998 2012—2013 0.981 1.0353 1.0157 1999—2000 0.9972 0.9637 0.9533 2013—2014 0.9915 1.0159 1.007 2000—2001 1.0093 0.9398 0.9396 2014—2015 1.0104 1.0169 1.0289 2001—2002 1.0031 0.9953 0.9975 2015—2016 1.1173 0.9866 1.0984 2002—2003 1.0715 0.9695 1.0275 2016—2017 1.0106 1.0683 1.0807 2003—2004 0.9989 1.0202 1.0091 2017—2018 1.0112 1.0944 1.1076 2004—2005 0.9427 1.0029 0.9358 2018—2019 1.0219 1.0757 1.0990 2005—2006 1.0268 1.0080 1.0267 T1 0.9481 1.0194 0.9420 2006—2007 1.0274 1.0343 1.0543 T2 1.0086 0.9992 0.9993 2007—2008 0.9475 1.0831 1.0195 T3 0.9992 1.0530 1.0434 2008—2009 0.9656 1.1353 1.0708 T4 1.0129 1.0204 1.0302 2009—2010 1.0209 0.9712 0.9944 T5 1.0146 1.0794 1.0958 2010—2011 1.0345 1.0411 1.0782 总体均值
Mean value0.9973 1.0308 1.0191 表中各项指数所示为年份间对应效率的动态变化值; T1为“九五”时期(1997—2000年)、T2为“十五”时期(2001—2005年)、T3为“十一五”时期(2006—2010年)、T4为“十二五”时期(2011—2015年)、T5为“十三五”时期(2016—2019年); 同时由于统计口径差异和数据获取问题, 本文研究区域不含中国港澳台地区。The indexes in the table show the dynamic changes of corresponding efficiency in different years; T1 is the Ninth Five-Year Plan period (1997−2000), T2 is the Tenth Five-Year Plan period (2001−2005), T3 is the 11th Five Year-Plan period (2006−2010), T4 is the 12th Five-Year Plan period (2011−2015), T5 is the 13th Five Year-Plan period (2016−2019). Due to the difference of statistical caliber and the problem of data acquisition, the study area does not include Hong Kong, Macao and Taiwan of China.
下载: 导出CSV
表 4 1997—2019年中国各省市综合效率相对有效情况
Table 4. Relative efficiencies of provinces and cities of China from 1997 to 2019
时期 Period 相对有效区 Relative effective area 1997—2000
(T1)广东、辽宁、云南 Guangdong, Liaoning, Yunnan 2001—2005
(T2)浙江、辽宁、新疆、山西、山东、北京、安徽、黑龙江、江苏、江西、吉林
Zhejiang, Liaoning, Xinjiang, Shanxi, Shandong, Beijing, Anhui, Heilongjiang, Jiangsu, Jiangxi, Jilin2006—2010
(T3)浙江、新疆、山东、辽宁、吉林、北京、天津、重庆、江苏、河北、江西、内蒙古、黑龙江
Zhejiang, Xinjiang, Shandong, Liaoning, Jilin, Beijing, Tianjin, Chongqing, Jiangsu, Hebei, Jiangxi, Inner Mongolia, Heilongjiang2011—2015
(T4)贵州、天津、湖北、山东、安徽、江苏、江西、河北、宁夏、四川、重庆、河南
Guizhou, Tianjin, Hubei, Shandong, Anhui, Jiangsu, Jiangxi, Hebei, Ningxia, Sichuan, Chongqing, Henan2016—2019
(T5)天津、福建、浙江、辽宁、上海、安徽、山西、山东、贵州、青海、河北、
新疆、甘肃、湖北、内蒙古、黑龙江、吉林、河南、江西、江苏、宁夏
Tianjin, Fujian, Zhejiang, Liaoning, Shanghai, Anhui, Shanxi, Shandong, Guizhou, Qinghai, Hebei,
Xinjiang, Gansu, Hubei, Inner Mongolia, Heilongjiang, Jilin, Henan, Jiangxi, Jiangsu, Ningxia由于统计口径差异和数据获取问题, 本文研究区域不含中国港澳台地区。Due to the difference of statistical caliber and the problem of data acquisition, the study area does not include Hong Kong, Macao and Taiwan of China.
下载: 导出CSV
表 5 中国粮食绿色全要素生产率投入产出冗余表
Table 5. Input and output redundancy of grain green total factor productivity in China
地区
Region效率值
Efficiency value投入冗余率 Input redundancy rate (%) 产出冗余率 Output redundancy rate (%) 第一产业
从业人员
Employees
in the
primary
industry粮食播种
面积
Grain sown area农业机械
总动力
Total power
of agricultural machinery农药
使用量
Pesticides
usage化肥
折纯量
Chemical fertilizer
application农膜
使用量
Agricultural film
usage碳排放量
Carbon emissions农业
面源污染
Agriculture
non-point source
pollution粮食产量
Grain
yield生态价值
Ecological
value安徽
Anhui0.8139 −11.87 −1.97 −35.01 0.00 −30.69 −4.77 −22.42 0.00 0.00 0.00 天津
Tianjin0.7453 −9.88 0.00 −45.66 0.00 −7.07 −45.78 −24.94 −14.83 0.00 0.00 山东
Shandong0.6407 −49.39 0.00 −37.90 −33.37 −14.68 −53.15 −24.11 −4.06 0.00 0.00 湖北
Hubei0.6069 −41.69 0.00 −36.94 −19.71 −50.97 −12.09 −42.04 −39.74 0.00 0.00 内蒙古
Inner Mongolia0.5791 −32.93 −8.19 −21.50 0.00 −46.13 −56.08 −38.76 −24.82 0.00 0.00 辽宁
Liaoning0.5704 −69.21 0.00 −15.69 −42.16 −18.69 −73.52 −38.23 −6.72 0.00 0.00 河北
Hebei0.5677 −59.46 0.00 −49.33 −27.69 −36.41 −44.14 −42.57 −7.16 0.00 0.00 山西
Shanxi0.4176 −79.61 −18.63 −22.75 −47.22 −58.99 −70.82 −53.93 −11.38 0.00 0.00 浙江
Zhejiang0.3992 −65.13 0.00 −55.83 −70.04 −35.60 −70.54 −69.82 −26.45 0.00 0.00 广东
Guangdong0.3757 −70.95 −6.03 −48.46 −59.04 −71.68 −37.70 −68.27 −74.99 0.00 0.00 陕西
Shaanxi0.3720 −81.20 −24.49 −55.69 0.00 −80.47 −65.54 −75.87 −48.47 0.00 0.00 广西
Guangxi0.3685 −76.53 −14.12 −64.94 −47.05 −74.10 −46.34 −67.66 −33.35 0.00 0.00 新疆
Xinjiang0.3488 −76.77 −2.05 −55.62 −31.18 −71.09 −92.12 −76.16 0.00 0.00 0.00 福建
Fujian0.3140 −74.41 0.00 −54.45 −66.44 −71.45 −79.19 −76.18 −60.48 0.00 0.00 云南
Yunnan0.3127 −85.80 −17.78 −54.93 −60.26 −67.73 −79.17 −67.05 −32.51 0.00 0.00 甘肃
Gansu0.3052 −81.06 −21.83 −54.37 −64.73 −48.98 −91.47 −68.80 0.00 0.00 0.00 北京
Beijing0.2346 −89.99 −14.31 −70.27 −76.57 −69.03 −90.96 −75.84 −60.83 0.00 0.00 海南
Hainan0.1610 −93.26 −32.08 −79.94 −92.81 −84.85 −91.99 −87.68 −30.27 0.00 0.00 青海
Qinghai0.1083 −47.39 35.71 −52.69 0.00 −25.08 −62.94 −41.98 0.00 0.00 0.00 总体
Nationwide0.4338 −62.98 −10.38 −48.00 −38.86 −50.72 −61.49 −55.91 −25.06 0.00 0.00 东北地区
Northeast China0.5704 −69.21 0.00 −15.69 −42.16 −18.69 −73.52 −38.23 −6.72 0.00 0.00 东部地区
Eastern China0.4234 −65.96 −8.55 −55.28 −47.33 −52.36 −64.33 −60.59 −36.39 0.00 0.00 中部地区
Central China0.6128 −44.39 −6.87 −31.57 −22.31 −46.88 −29.23 −39.46 −17.04 0.00 0.00 西部地区
Western China0.3421 −68.81 −17.74 −51.39 −29.03 −59.08 −70.52 −62.33 −19.88 0.00 0.00 本表只包含平均粮食绿色全要素生产率相对无效的19个省市; 东部地区包括北京、天津、河北、浙江、福建、山东、广东和海南; 中部地区包括山西、安徽和湖北; 西部地区包括内蒙古、广西、云南、陕西、甘肃、青海和新疆; 东北地区为辽宁。This table only includes 19 provinces and cities whose average grain green total factor productivity is relatively invalid; the eastern region includes Beijing, Tianjin, Hebei, Zhejiang, Fujian, Shandong, Guangdong and Hainan; the central region includes Shanxi, Anhui and Hubei; and the western region includes Inner Mongolia, Guangxi, Yunnan, Shaanxi, Gansu, Qinghai and Xinjiang; the northeast region is Liaoning.
下载: 导出CSV
表 6 1997—2019年中国粮食绿色全要素生产率莫兰全局自相关指数和检验值
Table 6. Moran’s I global autocorrelation index and test value of grain green total factor productivity in China from 2005 to 2019
年份 Year 莫兰指数 Moran’s I P Z 1997 −0.01 0.37 0.23 2001 0.11 0.09 1.33 2005 0.16 0.04 1.85 2009 0.19 0.02 2.19 2013 0.19 0.02 2.14 2019 0.25 0.01 2.75
下载: 导出CSV
表 7 2005—2019年中国粮食绿色全要素生产率LISA集聚类型
Table 7. LIAS agglomeration types of grain green total factor productivity of China from 2005 to 2019
集聚类型 Agglomeration type 2005 2009 2013 2019 高-高集聚 High-high 重庆、贵州 Chongqing, Guizhou 重庆、贵州 Chongqing, Guizhou 贵州 Guizhou 重庆、湖北 Chongqing, Hubei 低-高集聚 Low-high 云南、湖北 Yunnan, Hubei 湖北 Hubei 湖北 Hubei — 低-低集聚 Low-low — 海南 Hainan 海南 Hainan 海南 Hainan
下载: 导出CSV
-
[1] 贾娟琪, 孙致陆, 李先德. 粮食价格支持政策提高了我国粮食全要素生产率吗?−以小麦最低收购价政策为例[J]. 农村经济, 2019, (1): 67−72JIA J Q, SUN Z L, LI X D. Has the grain price support policy increased China’s grain total factor productivity? — Take the lowest purchase price policy for wheat as an example[J]. Rural Economy, 2019, (1): 67−72 [2] STEFAN S. Economics of life cycle assessment: inefficiency of the present approach[J]. Business Strategy and the Environment, 1997, 6(1): 1−8 doi: 10.1002/(SICI)1099-0836(199702)6:1<1::AID-BSE84>3.0.CO;2-D [3] 李金算. 国内外绿色生产力的理论与实践综述[J]. 中国科技论坛, 2005, (5): 109−113 doi: 10.3969/j.issn.1002-6711.2005.05.026LI J S. Theory and practice of green productivity at home and abroad[J]. China Science and Technology Forum, 2005, (5): 109−113 doi: 10.3969/j.issn.1002-6711.2005.05.026 [4] 李学林, 李隆伟, 董晓波, 等. 云南省粮食全要素生产率分解研究[J]. 农业技术经济, 2019, (10): 102−113LI X L, LI L W, DONG X B, et al. A study on decomposition of total factor productivity of grain in Yunnan Province[J]. Journal of Agrotechnical Economics, 2019, (10): 102−113 [5] 魏琦, 张斌, 金书秦. 中国农业绿色发展指数构建及区域比较研究[J]. 农业经济问题, 2018, 39(11): 11−20WEI Q, ZHANG B, JIN S Q. A study on construction and regional comparison of agricultural green development index in China[J]. Issues in Agricultural Economy, 2018, 39(11): 11−20 [6] 龚斌磊, 张书睿, 王硕, 等. 新中国成立70年农业技术进步研究综述[J]. 农业经济问题, 2020, 41(6): 11−29GONG B L, ZHANG S R, WANG S, et al. 70 years of technological progress in China’s agricultural sector[J]. Issues in Agricultural Economy, 2020, 41(6): 11−29 [7] CHARNES A W, COOPER W W, RHODES E. Measuring the efficiency of decision making units[J]. North-Holland, 1978, 2(6): 429−444 [8] CAVES D W, CHRISTENSEN L R, DIEWERT W E. Multilateral comparisons of output, input, and productivity using superlative index numbers[J]. Economic Journal, 2002, 92(365): 73−86 [9] NKAMLEU G B. Productivity growth, technical progress and efficiency change in African agriculture[J]. African Development Review, 2004, 16(1): 203−222 doi: 10.1111/j.1467-8268.2004.00089.x [10] 侯琳, 冯继红. 基于超效率DEA和Malmquist指数的中国农业生产效率分析[J]. 河南农业大学学报, 2019, 53(2): 316−324HOU L, FENG J H. Analysis of Chinese agricultural production efficiency based on super-efficiency DEA and Malmquist index[J]. Journal of Henan Agricultural University, 2019, 53(2): 316−324 [11] 王璐, 杨汝岱, 吴比. 中国农户农业生产全要素生产率研究[J]. 管理世界, 2020, 36(12): 77−93 doi: 10.3969/j.issn.1002-5502.2020.12.008WANG L, YANG R D, WU B. Research on total factor productivity of Chinese farmers’ agricultural production[J]. Management World, 2020, 36(12): 77−93 doi: 10.3969/j.issn.1002-5502.2020.12.008 [12] 陈鸣, 邓荣荣. 农业R& D投入与农业全要素生产率−一个空间溢出视角的解释与证据[J]. 江西财经大学学报, 2020, (2): 86−97CHEN M, DENG R R. Agricultural R & D input and agricultural total factor productivity: an explanation and evidence from the perspective of spatial spillover[J]. Journal of Jiangxi University of Finance and Economics, 2020, (2): 86−97 [13] 张红丽, 李洁艳. 农业技术进步、农村劳动力转移与城乡收入差距−基于农业劳动生产率的分组研究[J]. 华东经济管理, 2020, 34(1): 67−75ZHANG H L, LI J Y. The impact of agricultural technology progress, rural labor transfer and the income gap between urban and rural areas: study and analysis on the grouping of agricultural labor productivity[J]. East China Economic Management, 2020, 34(1): 67−75 [14] HAILU A, VEEMAN T S. Environmentally sensitive productivity analysis of the Canadian pulp and paper industry, 1959–1994: an input distance function approach[J]. Journal of Environmental Economics and Management, 2000, 40(3): 251−274 doi: 10.1006/jeem.2000.1124 [15] TONE K. A slacks-based measure of super-efficiency in data envelopment analysis[J]. European Journal of Operational Research, 2002, 143(1): 32−41 doi: 10.1016/S0377-2217(01)00324-1 [16] CHUNG Y, FARE R. Productivity and undesirable outputs: A directional distance function approach[J]. Microeconomics, 1997, 51(3): 229−240 [17] RAMANATHAN R, BLACK A, NATH P, et al. Impact of environmental regulations on innovation and performance in the UK industrial sector[J]. Management Decision, 2010, 48(10): 1493−1513 [18] 李欠男, 李谷成, 尹朝静. 农业绿色全要素生产率增长的分布动态演进[J]. 统计与信息论坛, 2020, 35(10): 119−128 doi: 10.3969/j.issn.1007-3116.2020.10.014LI Q N, LI G C, YIN C J. Dynamic evolution of agricultural green total factor productivity growth[J]. Statistics & Information Forum, 2020, 35(10): 119−128 doi: 10.3969/j.issn.1007-3116.2020.10.014 [19] 孟祥海, 周海川, 杜丽永, 等. 中国农业环境技术效率与绿色全要素生产率增长变迁−基于种养结合视角的再考察[J]. 农业经济问题, 2019, 40(6): 9−22MENG X H, ZHOU H C, DU L Y, et al. The change of agricultural environmental technology efficiency and green total factor productivity growth in China: Re-examination based on the perspective of combination of planting and breeding[J]. Issues in Agricultural Economy, 2019, 40(6): 9−22 [20] 熊鹰, 何鹏. 绿色防控技术采纳行为的影响因素和生产绩效研究−基于四川省水稻种植户调查数据的实证分析[J]. 中国生态农业学报(中英文), 2020, 28(1): 136−146XIONG Y, HE P. Impact factors and production performance of adoption of green control technology: an empirical analysis based on the survey data of rice farmers in Sichuan Province[J]. Chinese Journal of Eco-Agriculture, 2020, 28(1): 136−146 [21] 杜江, 罗珺, 王锐, 等. 粮食主产区种植业碳功能测算与时空变化规律研究[J]. 生态与农村环境学报, 2019, 35(10): 1242−1251DU J, LUO J, WANG R, et al. The estimation and analysis of spatio-temporal change patterns of carbon functions in major grain producing area[J]. Journal of Ecology and Rural Environment, 2019, 35(10): 1242−1251 [22] 刘钦普, 濮励杰. 中国粮食主产区化肥施用时空特征及生态经济合理性分析[J]. 农业工程学报, 2019, 35(23): 142−150 doi: 10.11975/j.issn.1002-6819.2019.23.018LIU Q P, PU L J. Spatiotemporal variation of fertilizer utilization and its eco-economic rationality in major grain production areas of China[J]. Transactions of the Chinese Society of Agricultural Engineering, 2019, 35(23): 142−150 doi: 10.11975/j.issn.1002-6819.2019.23.018 [23] 谭术魁, 韩思雨, 张路. 粮食安全视角下粮食主产区耕地休耕规模及动态仿真研究[J]. 中国土地科学, 2020, 34(2): 9−17TAN S K, HAN S Y, ZHANG L. Study on fallow scale and dynamical simulation of major grain producing areas in China from the food security perspective[J]. China Land Science, 2020, 34(2): 9−17 [24] 王雪蕾, 王新新, 朱利, 等. 巢湖流域氮磷面源污染与水华空间分布遥感解析[J]. 中国环境科学, 2015, 35(5): 1511−1519 doi: 10.3969/j.issn.1000-6923.2015.05.031WANG X L, WANG X X, ZHU L, et al. Remote sensing analysis of nitrogen and phosphorus non-point source pollution and spatial distribution of water bloom in Chaohu Lake Basin[J]. China Environmental Science, 2015, 35(5): 1511−1519 doi: 10.3969/j.issn.1000-6923.2015.05.031 [25] 尚杰, 吉雪强, 陈玺名. 中国城镇化对农业生态效率的影响−基于中国13个粮食主产区2009—2018年面板数据[J]. 中国生态农业学报(中英文), 2020, 28(8): 1265−1276SHANG J, JI X Q, CHEN X M. Study on the impact of China’s urbanization on agricultural ecological efficiency: Based on panel data of 13 major grain-producing regions in China from 2009 to 2018[J]. Chinese Journal of Eco-Agriculture, 2020, 28(8): 1265−1276 [26] 高鸣, 宋洪远, Michael Carter. 补贴减少了粮食生产效率损失吗?−基于动态资产贫困理论的分析[J]. 管理世界, 2017, (9): 85−100 doi: 10.3969/j.issn.1002-5502.2017.09.008GAO M, SONG H Y, CARTER M. Does subsidies reduce the loss of food production efficiency? — An analysis based on the theory of dynamic asset poverty[J]. Management World, 2017, (9): 85−100 doi: 10.3969/j.issn.1002-5502.2017.09.008 [27] 胡雪枝, 钟甫宁. 农村人口老龄化对粮食生产的影响−基于农村固定观察点数据的分析[J]. 中国农村经济, 2012, (7): 29−39HU X Z, ZHONG F N. The impact of rural population aging on food production: An analysis based on rural fixed observation point data[J]. Chinese Rural Economy, 2012, (7): 29−39 [28] 罗海平, 朱勤勤, 潘柳欣, 等. 粮食主产区农田生态系统服务价值动态演化与空间分异[J]. 统计与决策, 2020, 36(4): 49−52LUO H P, ZHU Q Q, PAN L X, et al. The dynamic evolution and spatial differentiation of farmland ecosystem service value in main grain producing areas[J]. Statistics & Decision, 2020, 36(4): 49−52 [29] COSTANZA R, D’ARGE R, DE GROOT R, et al. The value of the world’s ecosystem services and natural capital[J]. Nature, 1997, 387(6630): 253−260 doi: 10.1038/387253a0 [30] 谢高地, 张彩霞, 张雷明, 等. 基于单位面积价值当量因子的生态系统服务价值化方法改进[J]. 自然资源学报, 2015, 30(8): 1243−1254 doi: 10.11849/zrzyxb.2015.08.001XIE G D, ZHANG C X, ZHANG L M, et al. Improvement of the evaluation method for ecosystem service value based on per unit area[J]. Journal of Natural Resources, 2015, 30(8): 1243−1254 doi: 10.11849/zrzyxb.2015.08.001 [31] 潘丹. 考虑资源环境因素的中国农业生产率研究[D]. 南京: 南京农业大学, 2012PAN D. Research on China’s agricultural productivity considering resource and environmental factors[D]. Nanjing: Nanjing Agricultural University, 2012 [32] 谭忠昕, 郭翔宇. 基于超效率DEA模型的中国粮食生产用水效率评价[J]. 农业机械学报, 2019, 50(8): 280−288 doi: 10.6041/j.issn.1000-1298.2019.08.031TAN Z X, GUO X Y. Evaluation of water use efficiency for grain production in China based on super efficiency DEA model[J]. Journal of Agricultural Machinery, 2019, 50(8): 280−288 doi: 10.6041/j.issn.1000-1298.2019.08.031 [33] 石华平, 易敏利. 环境规制、非农兼业与农业面源污染−以化肥施用为例[J]. 农村经济, 2020, (7): 127−136SHI H P, YI M L. Environmental regulation, non-agricultural concurrent operations and agricultural non-point source pollution: Taking chemical fertilizer application as an example[J]. Rural Economy, 2020, (7): 127−136 [34] 陈柔, 何艳秋, 朱思宇, 等. 我国农业碳排放双重性及其与经济发展的协调性研究[J]. 软科学, 2020, 34(1): 132−138CHEN R, HE Y Q, ZHU S Y, et al. Duality of agricultural carbon emissions and coordination with economic development in China[J]. Soft Science, 2020, 34(1): 132−138 [35] 田旭, 王善高. 中国粮食生产环境效率及其影响因素分析[J]. 资源科学, 2016, 38(11): 2106−2116TIAN X, WANG S G. Environmental efficiency and its determinants regarding China’s grain production[J]. Resources Science, 2016, 38(11): 2106−2116 [36] 张利国, 鲍丙飞. 我国粮食主产区粮食全要素生产率时空演变及驱动因素[J]. 经济地理, 2016, 36(3): 147−152ZHANG L G, BAO B F. Empirical analysis on spatio-temporal evolution and driving forces of food total factor production in major grain producing areas of our country[J]. Economic Geography, 2016, 36(3): 147−152 [37] 望晓东. 广东农地非农化效率测度及其影响因素研究[D]. 广州: 华南农业大学, 2018WANG X D. The research on measurement and analysis of influence factors of agricultural land conversion efficiency in Guangdong Province[D]. Guangzhou: South China Agricultural University, 2018 -


 下载:
下载:


 点击查看大图

计量
- 文章访问数: 235
- HTML全文浏览量: 33
- PDF下载量: 53
- 被引次数: 0
