

Regional differences, dynamic evolution, and convergence of the carbon compensation rate of planting industry in China
-
摘要: 农业碳排放阻碍绿色农业转型, 探索种植业碳补偿率区域差异、动态演进及收敛性, 可为低碳农业良性发展提供有益指导。本文同时考虑碳源和碳汇, 测算2002—2018年中国31省、市、自治区种植业碳补偿率, 采用Dagum基尼系数分解法考察地区差异, 采用非参数估计中的核密度估计动态演进过程, 借助σ收敛、绝对β收敛及条件β收敛检视收敛性特征。结果表明: 1)种植业碳补偿率整体相对差异扩大趋势明显。东部地区相对差异扩大, 中部地区和西部地区变化较小; 东—西部、东—中部地区之间增加, 中—西部地区之间减小; 地区间差距是造成种植业碳补偿率差异的主要原因。2)中国种植业碳补偿率整体呈逐年增大的变动态势, 碳补偿率高值省份有所增多, 省域种植业碳补偿率差异有先减后增的趋势。东部各省种植业碳补偿率在逐渐上升, 绝对差距有所减少, 从两极分化演变为单极化; 中部各省种植业碳补偿率在逐渐上升, 绝对差距有所减小; 西部各省种植业碳补偿率变化较为稳定。3)全国及东、西部地区的种植业碳补偿率不存在σ收敛, 而中部地区不甚明显; 全国、东、中及西部地区绝对和条件β收敛均显著。本文的结论强调, 中国种植业碳补偿率的区域异质性凸显, 其时序变化趋势总体上升; 省域间的“追赶效应”显现, 地区间碳补偿率增长的趋同态势明显。因此, 合理制定区域农业绿色发展策略, 积极发挥区域减排潜力是提高种植业碳补偿率的关键。Abstract: Global warming is an increasingly serious problem. Carbon emissions from agriculture had hindered its transition to green agriculture, and carbon emissions from the planting industry cannot be ignored. Reducing the regional differences and clarifying dynamic evolution and convergence of the carbon compensation rates in the planting industry are conducive to the benign development of low-carbon agriculture. At present, few studies consider both agricultural carbon sources and carbon sinks, and an in-depth analysis of the carbon compensation rate of the planting industry is lacking. Existing studies on the agricultural carbon compensation rate focus only on the spatial effect of agricultural carbon but do not effectively analyze the sources and convergence of regional differences in the carbon compensation rate of the planting industry. Therefore, this study considered both the carbon sources and the carbon sinks and estimated the carbon compensation rate of the planting industry in 31 Chinese provinces (municipalities and autonomous districts) from 2002 to 2018. The Dagum Gini coefficient decomposition method was used to measure and decompose the regional differences, the dynamic evolution process of kernel density with non-parametric estimation was investigated, and the σ-convergence, absolute β-convergence, and conditional β-convergence models were used to test the convergence characteristics of the carbon compensation rate. The results were as follows: (1) The overall relative difference in the carbon compensation rate of the planting industry tended to expand. The relative differences in the eastern region expanded, while the relative differences in the central and western regions showed only little change. The relative differences between the eastern and western regions and the eastern and central regions increased, whereas that between the central and western regions decreased. The regional differences were the main reasons for the differences in the carbon compensation rates of the planting industry. (2) The carbon compensation rate of the planting industry in China increased annually, and the number of provinces with high carbon compensation rates increased. The provincial difference in carbon compensation rate first decreased and then increased. The carbon compensation rate in the eastern provinces increased gradually, and the inter-provincial absolute gap decreased, changing from polarization to unipolarization. The carbon compensation rate in the central provinces increased gradually, and the absolute gap decreased. The carbon compensation rate in the western provinces was relatively stable and showed little change. (3) There was no σ-convergence in the carbon compensation rate of the planting industry in the whole country and the eastern and western regions, but it was not obviously observed in the central region. The absolute and conditional β-convergences were significant in the whole country and the eastern, central, and western regions. The results of this study emphasize that regional heterogeneity in the carbon compensation rate of China’s planting industry is prominent and that the temporal trend of carbon compensation rate is generally increasing. The “catch-up effect” among provinces and the convergence trend of the carbon compensation rate growth among regions are apparent. In the future, it will be important to improve the carbon compensation rate of the planting industry to better formulate a green development strategy for regional agriculture and actively reduce regional emissions.
-

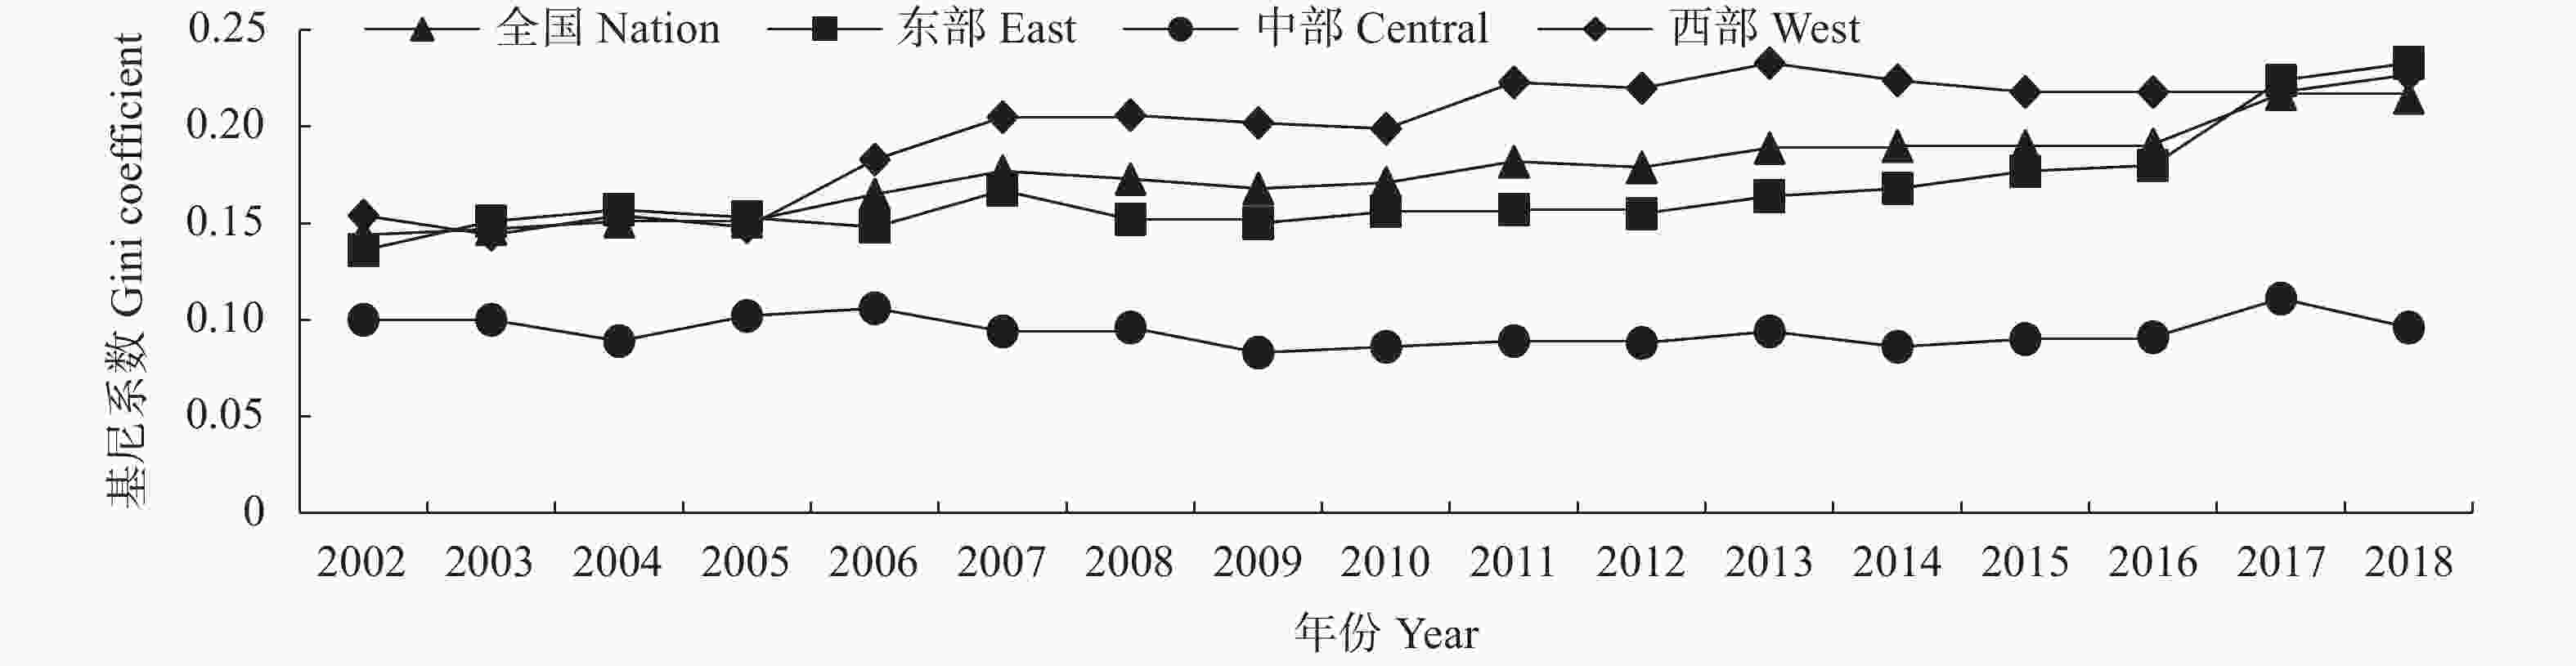
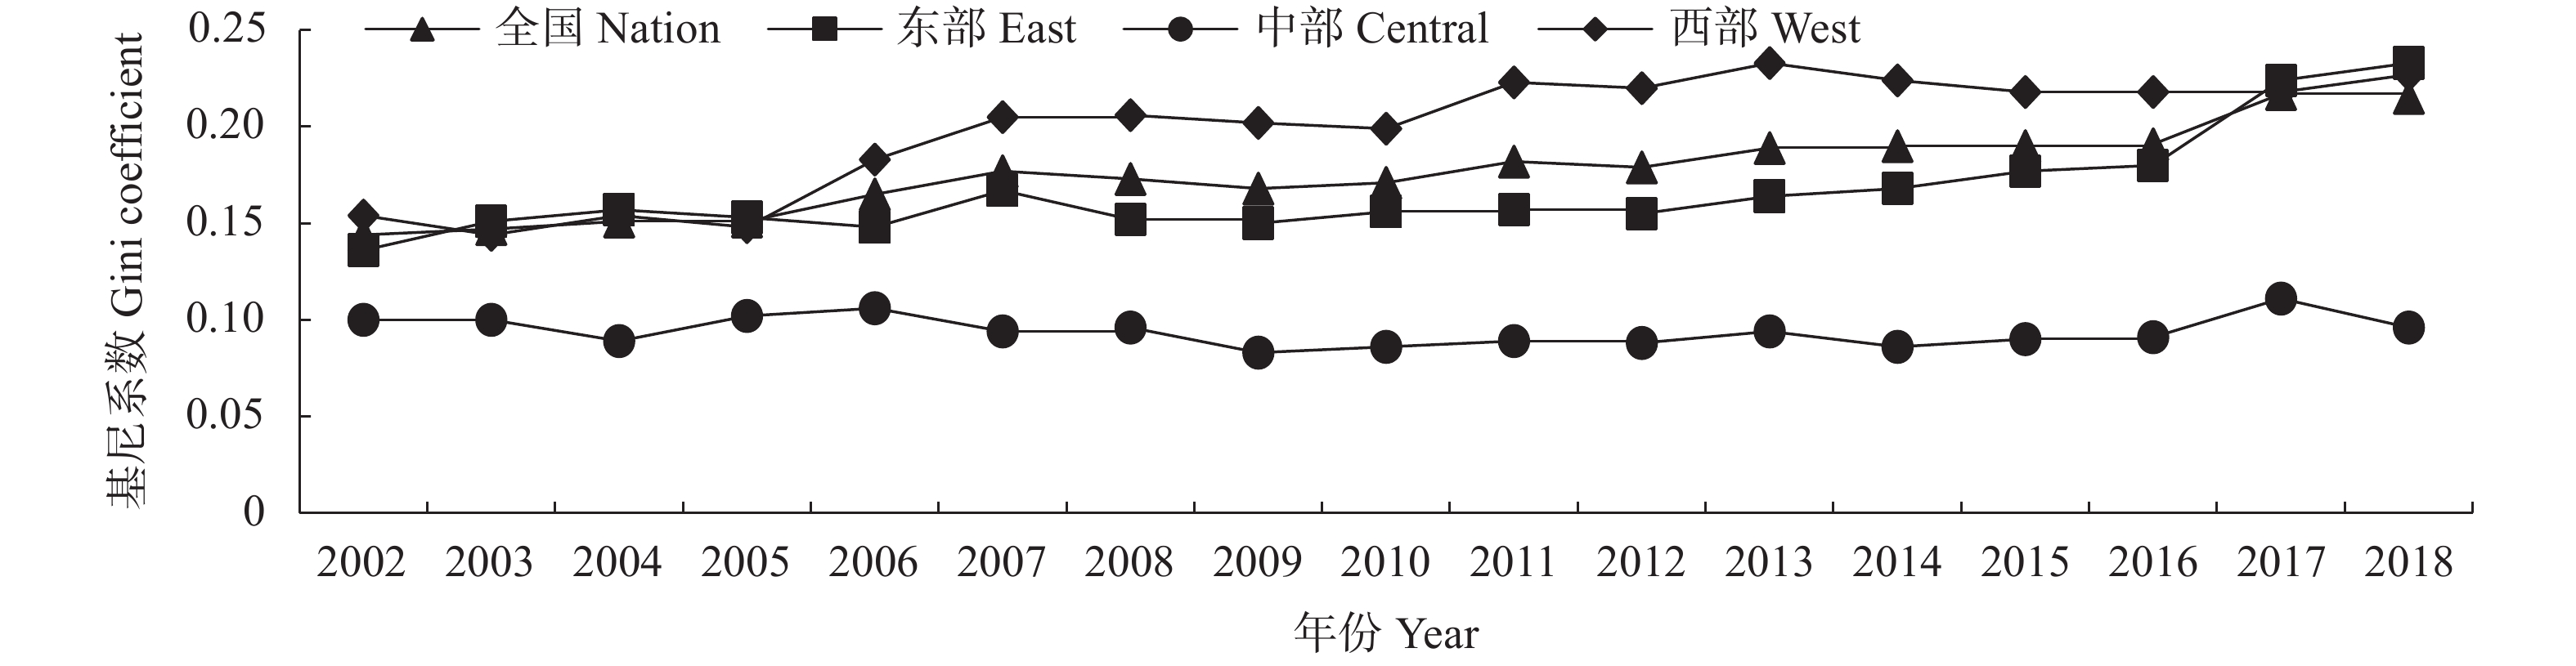
图 1 2002—2018年中国种植业碳补偿率地区内基尼系数的变化趋势
Figure 1. Trends in the Gini coefficient within the region of carbon compensation rate of crops production in China from 2002 to 2018
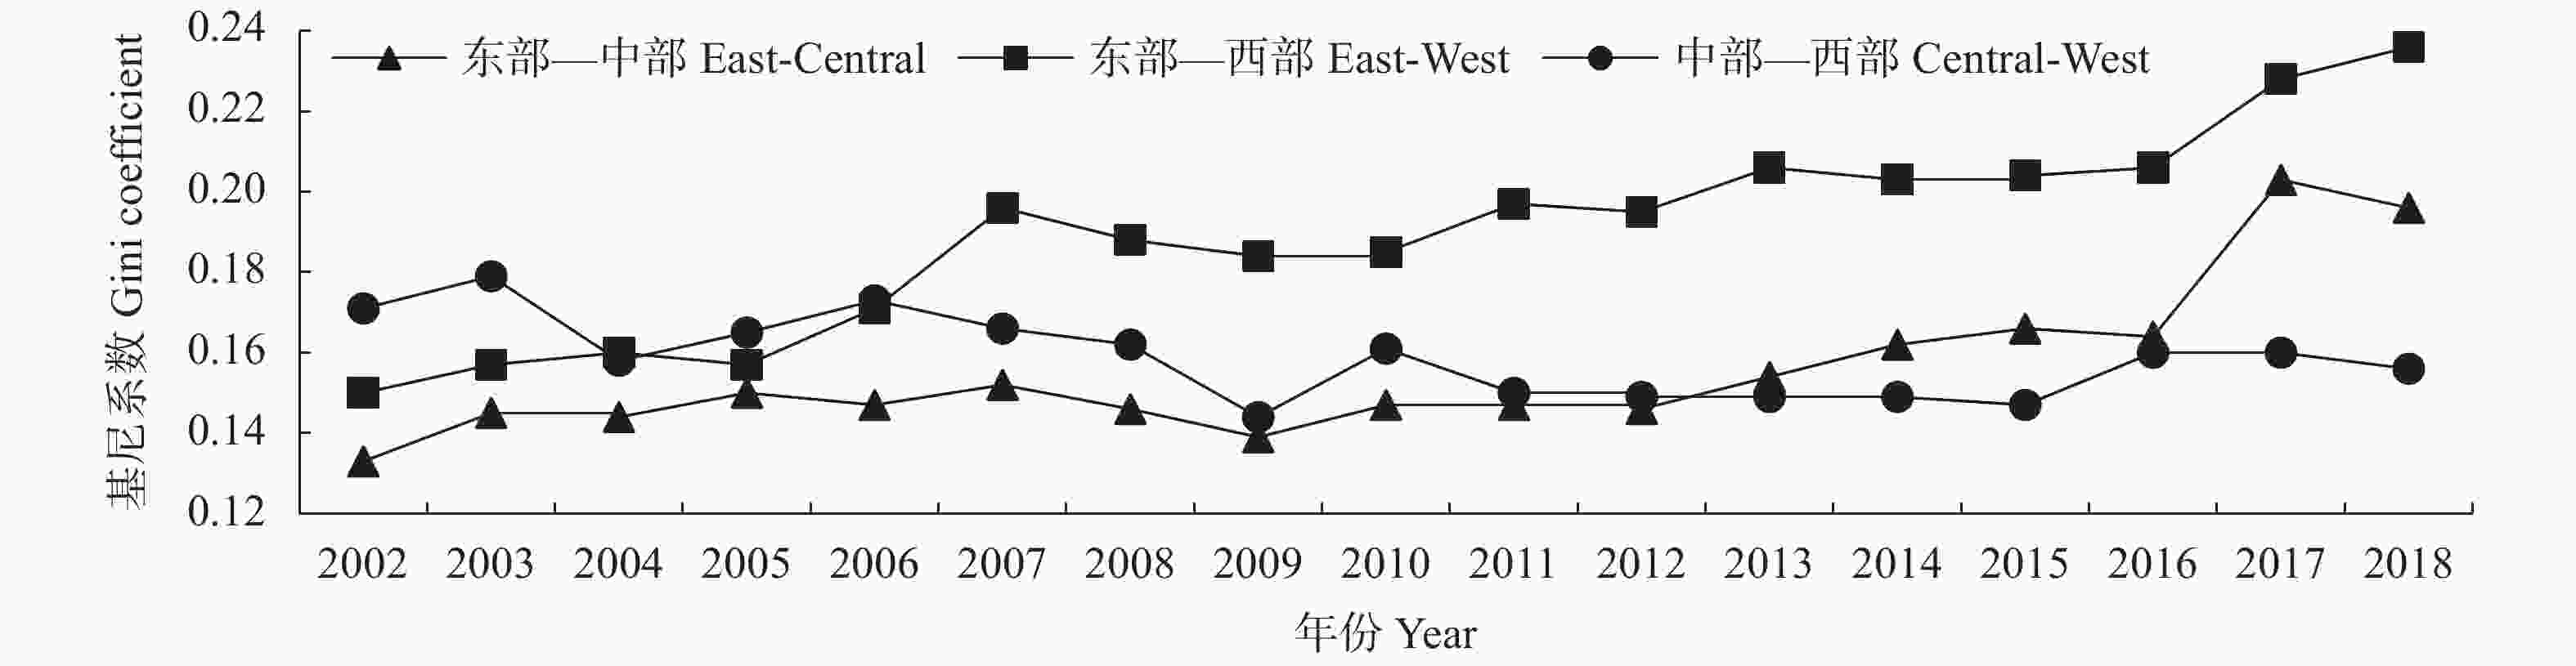
图 2 2002—2018年中国种植业碳补偿率地区间基尼系数变化趋势
Figure 2. Trends in interregional Gini coefficients of carbon compensation rate of crops production in China from 2002 to 2018
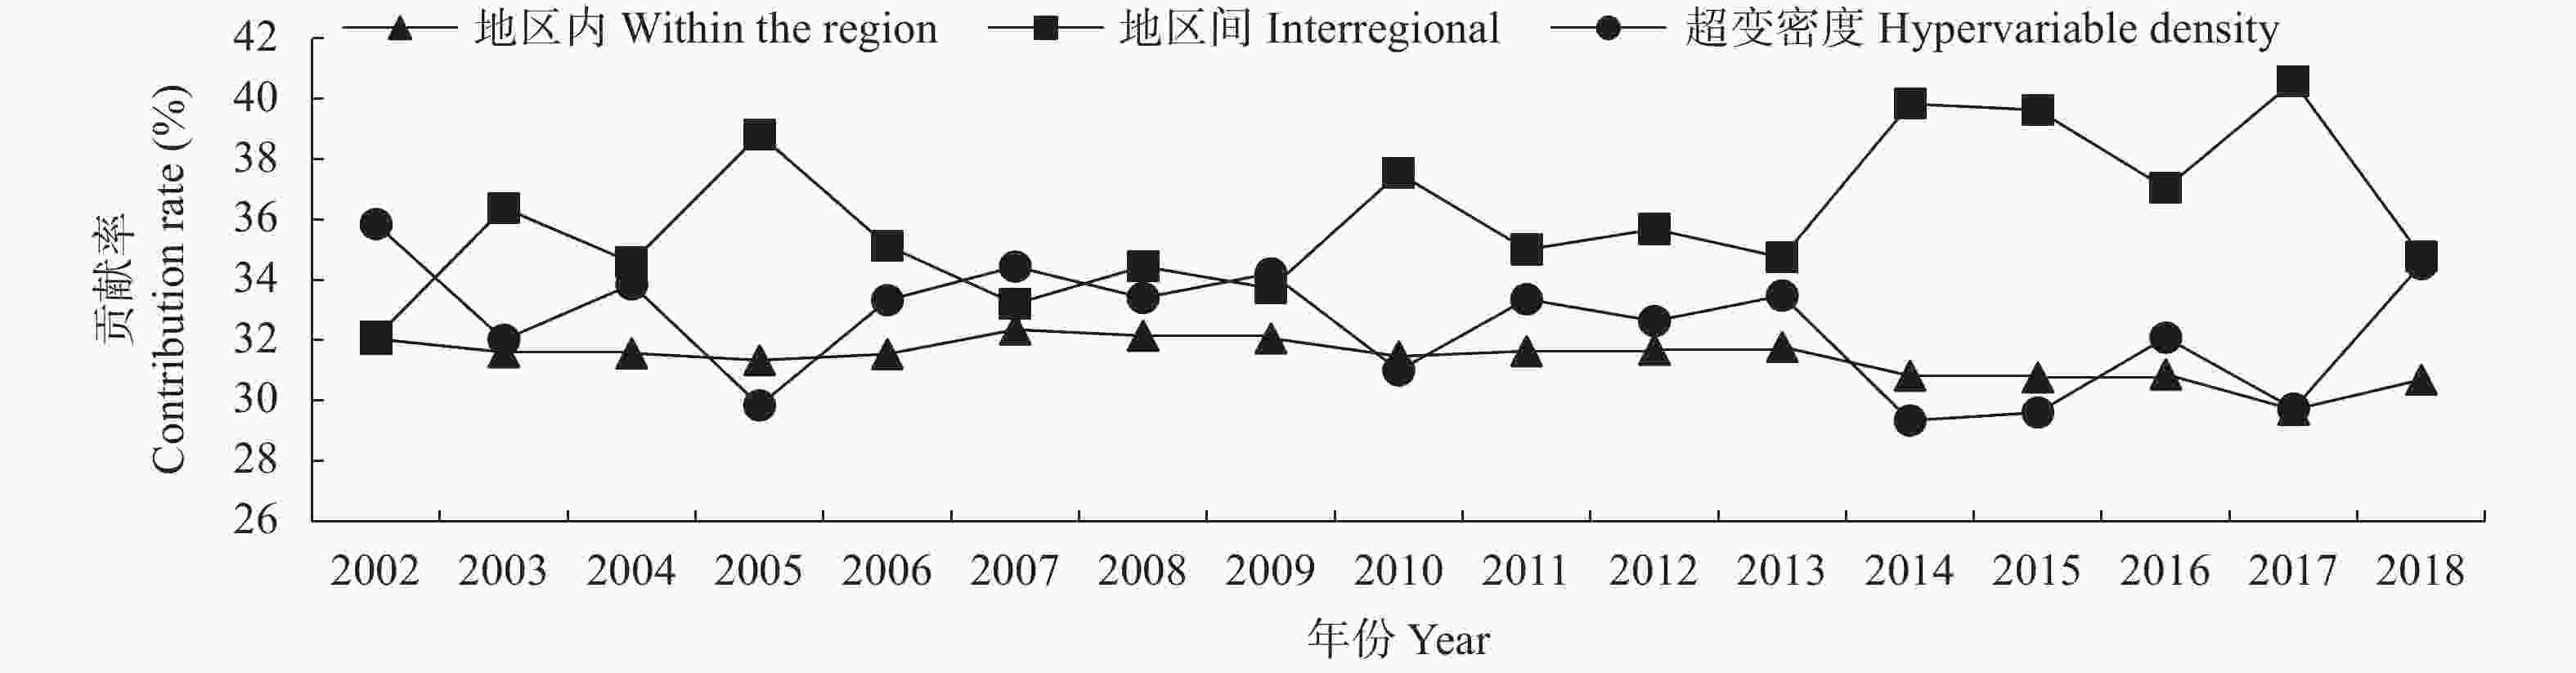
图 3 2002—2018年种植业碳补偿率地区差距来源贡献率变化趋势
Figure 3. Trends in the contribution rate in sources of regional disparities of the planting industry from 2002 to 2018
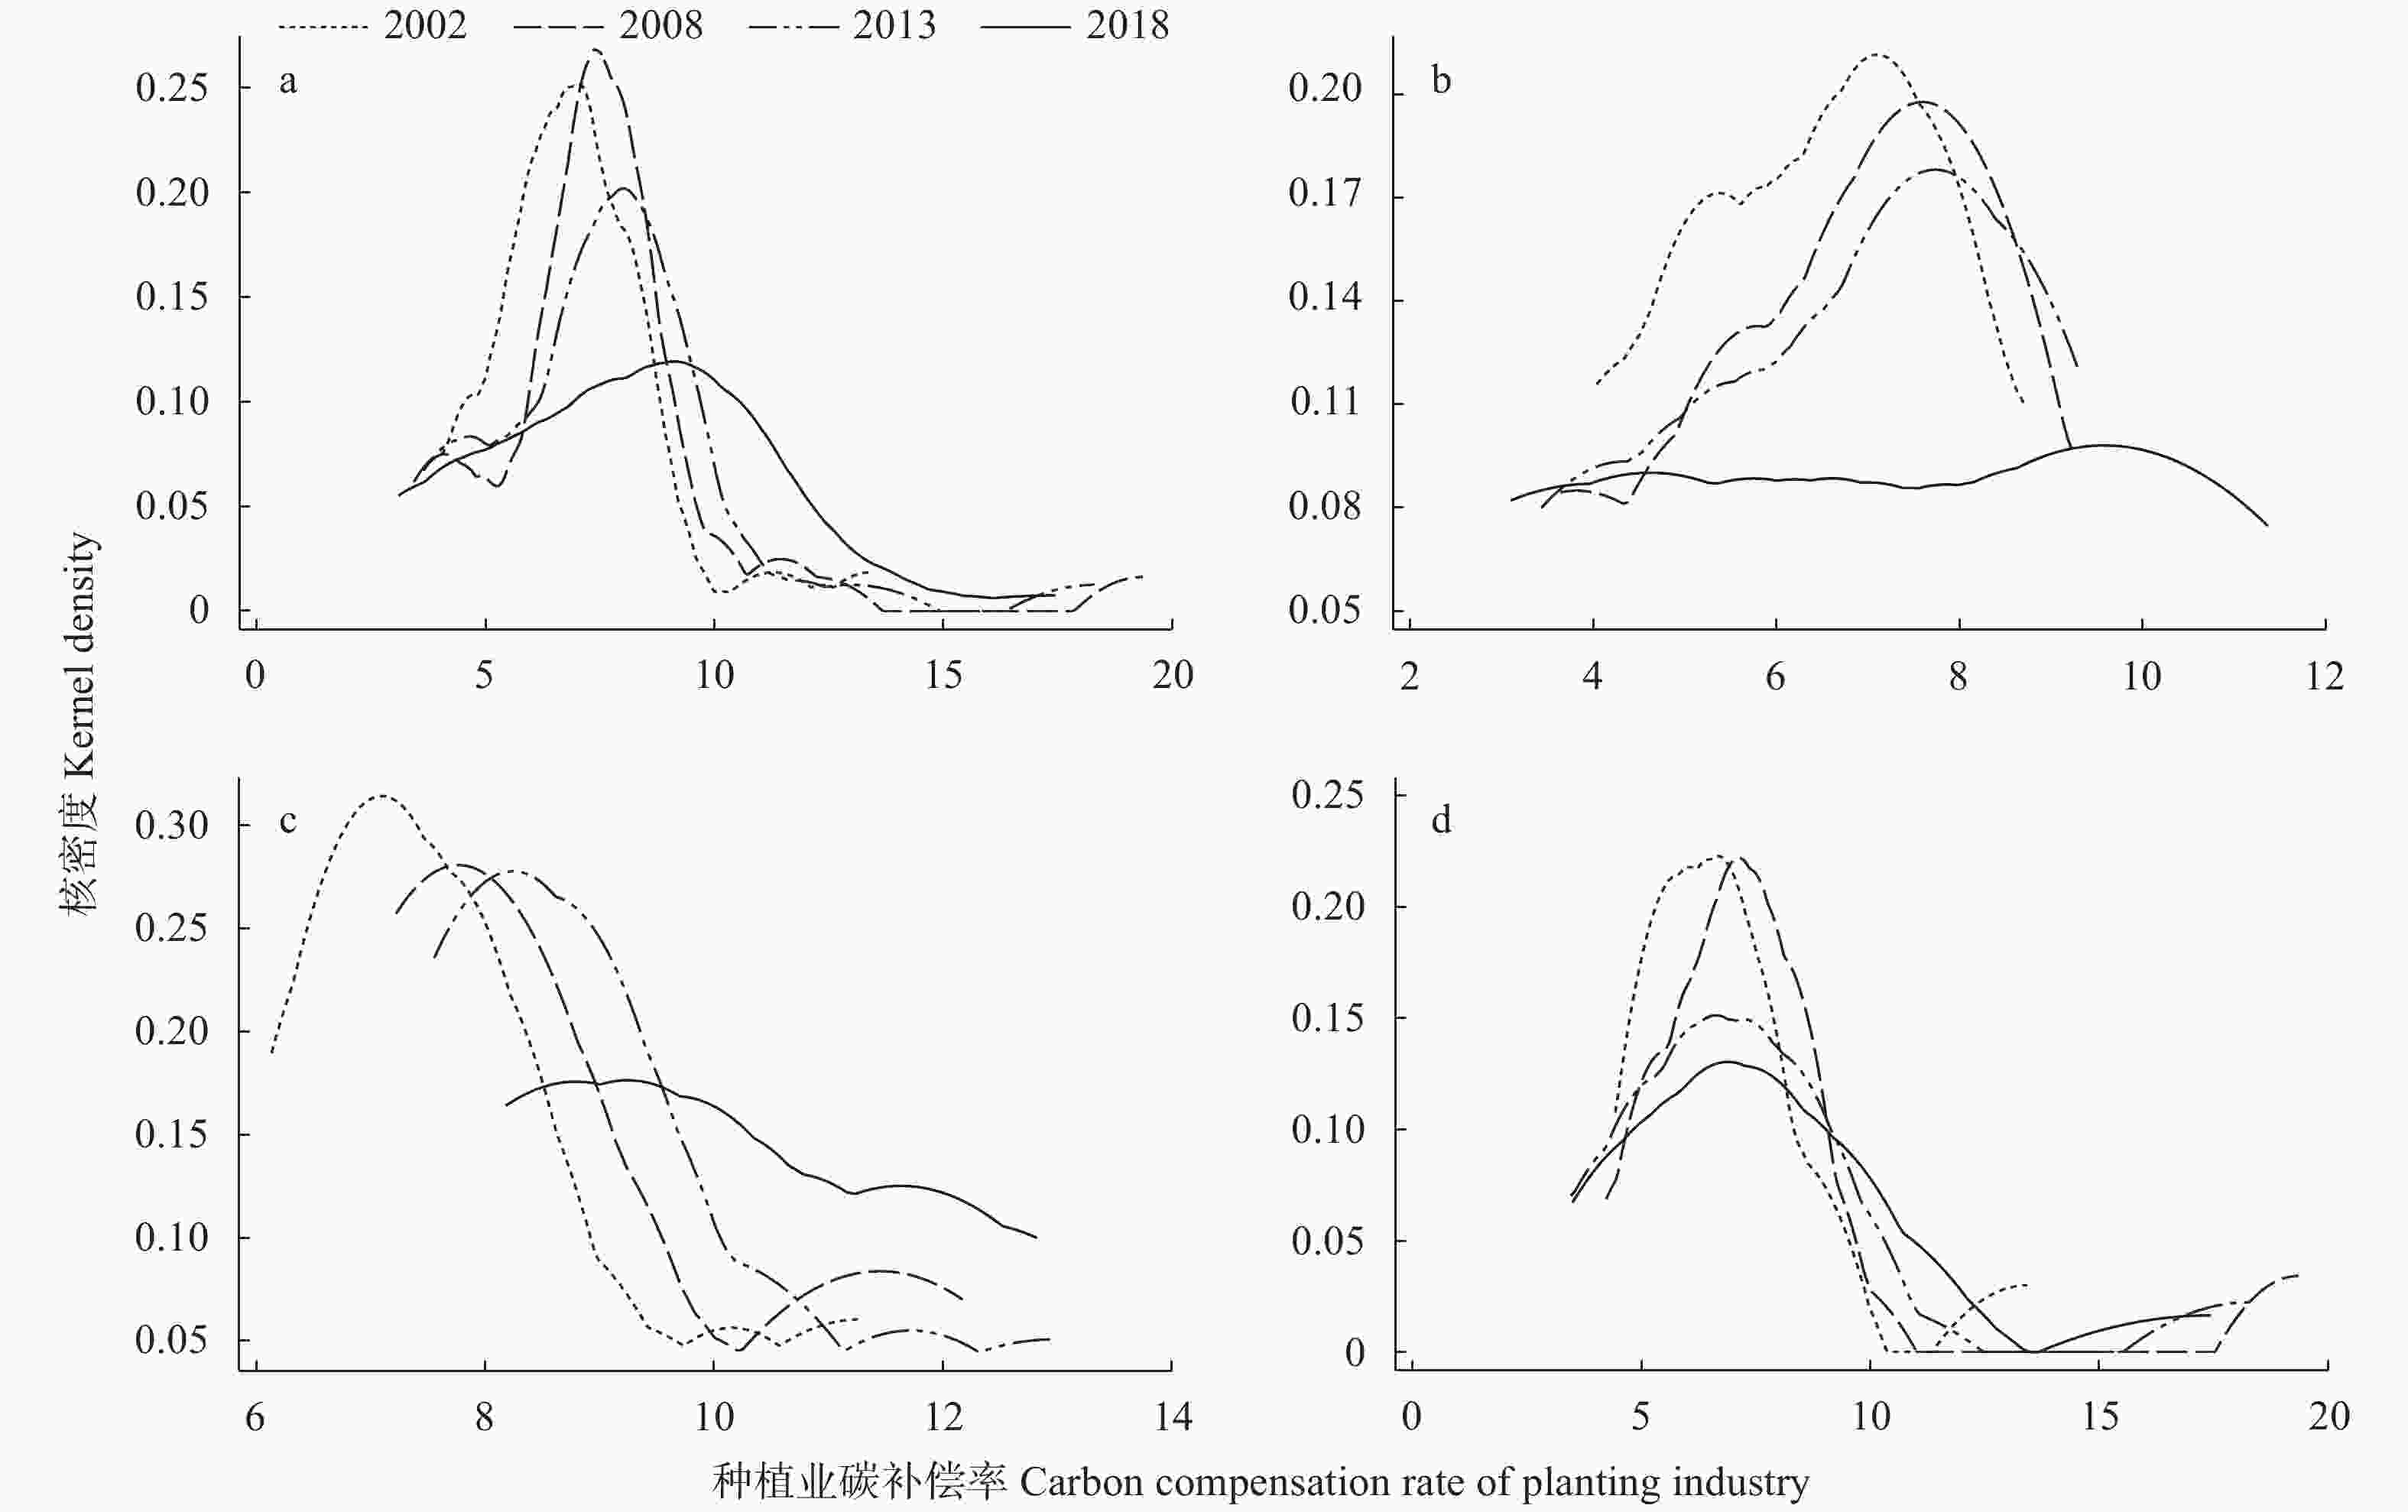
图 4 2002—2018年全国(a)及东部(b)、中部(c)、西部(d)地区种植业碳补偿率核密度变化
Figure 4. Changes of kernel density of carbon compensation rate of crops prodcution of the nation (a), and east (b), central (c), and west (d) regions of China from 2002 to 2018
表 1 主要农作物碳吸收率、平均含水量、经济系数和单位碳吸收量
Table 1. Carbon absorption rates, average water contents, economic coefficients and carbon absorption rates of major crops
作物种类
Crop species主要农作物
Main crop碳吸收率
Carbon absorption rate平均含水率
Average moisture content (%)经济系数
Economic coefficient粮食作物
Food crops水稻 Rice 0.414 12 0.45 小麦 Wheat 0.485 12 0.40 玉米 Corn 0.471 13 0.40 高粱 Sorghum 0.450 13 0.35 谷子 Millet 0.450 14 0.40 薯类 Tubers 0.423 70 0.70 豆类 Beans 0.450 13 0.34 经济作物
Grops棉花 Cotton 0.450 8 0.10 油菜籽 Rapeseed 0.450 10 0.25 花生 Peanut 0.450 10 0.43 甘蔗 Sugarcane 0.450 50 0.50 甜菜 Beetroots 0.407 75 0.70 烟草 Tobacco 0.450 85 0.55 园艺作物
Garden crops蔬菜 Vegetables 0.450 90 0.60 瓜果 Fruits 0.450 90 0.70  下载: 导出CSV
表 2 2002—2018年中国省域种植业碳补偿率
Table 2. Carbon compensation rate of crops production in each province (city, autonomous region) of China from 2002 to 2018
区域
Region省份
Province (city, autonomous region)年份 Year 2002 2004 2006 2008 2010 2012 2014 2016 2018 东部 East 北京 Beijing 5.56 5.51 6.68 7.28 6.98 7.38 5.70 5.73 4.80 天津 Tianjin 6.33 6.58 6.92 6.73 6.75 6.74 7.03 7.56 11.37 河北 Hebei 6.50 5.50 5.83 6.80 6.95 7.45 7.54 8.26 9.08 上海 Shanghai 4.27 4.08 4.02 3.90 3.82 4.25 4.03 3.81 4.33 江苏 Jiangsu 8.70 8.84 9.07 9.25 9.05 9.20 9.40 9.30 9.83 浙江 Zhejiang 4.04 3.81 3.98 3.64 3.57 3.58 3.49 3.52 3.09 辽宁 Liaoning 7.60 8.68 8.26 8.33 7.32 8.30 6.80 8.13 9.19 福建 Fujian 4.31 4.30 4.12 3.91 3.99 4.07 4.16 4.13 3.55 山东 Shandong 6.62 7.41 7.70 8.28 8.15 8.45 8.62 8.91 10.20 广东 Guangdong 7.88 7.34 8.05 7.32 7.55 8.05 8.10 8.17 7.78 海南 Hainan 7.60 8.12 7.03 6.78 5.33 5.92 5.53 4.52 4.16 平均 Mean 6.31 6.38 6.51 6.56 6.32 6.67 6.40 6.55 7.04 中部 Central 山西 Shanxi 6.13 7.25 7.54 7.22 7.27 8.07 8.32 8.22 8.76 吉林 Jilin 11.29 11.91 12.71 12.17 11.20 12.46 12.51 12.75 12.82 黑龙江 Heilongjiang 7.40 7.24 6.83 8.08 8.56 9.13 9.49 9.09 11.48 安徽 Anhui 7.87 7.78 8.16 8.28 8.07 8.47 8.64 8.94 10.04 江西 Jiangxi 6.66 6.88 7.27 7.31 7.12 7.53 7.68 7.65 8.18 河南 Henan 9.02 9.11 10.32 10.73 10.47 10.57 10.45 10.75 12.18 湖北 Hubei 7.07 7.70 7.83 7.79 7.80 8.00 8.23 8.02 8.69 湖南 Hunan 7.43 7.46 7.99 7.90 7.93 8.10 7.92 8.00 8.30 平均 Mean 7.86 8.17 8.58 8.69 8.55 9.04 9.16 9.18 10.06 西部 Weast 内蒙古 Inner Mongolia 6.30 6.36 6.67 7.47 7.01 7.81 7.94 7.33 9.55 广西 Guangxi 13.43 13.70 16.67 19.35 17.09 17.95 18.41 17.08 17.45 重庆 Chongqing 6.55 6.98 6.27 7.41 7.30 7.01 7.05 7.23 6.92 四川 Sichuan 7.90 8.02 7.31 8.05 8.18 8.18 8.30 8.48 8.98 贵州 Guizhou 6.19 6.67 6.80 6.29 6.09 5.68 5.69 5.72 5.39 云南 Yunnan 8.30 8.04 8.06 8.20 7.39 8.02 8.01 7.67 8.37 西藏 Tibet 5.21 5.16 5.12 4.83 4.15 3.79 3.46 3.26 3.49 陕西 Shaanxi 6.31 6.83 7.33 7.33 7.03 7.27 6.99 7.03 6.97 甘肃 Gansu 4.43 4.55 4.33 4.23 4.20 4.33 4.27 4.07 4.81 青海 Qinghai 5.45 5.69 5.18 6.29 5.71 5.42 5.03 4.78 4.71 宁夏 Ningxia 6.15 5.80 6.20 5.95 6.06 6.39 6.68 6.64 6.85 新疆 Xinjiang 8.27 8.33 8.32 9.19 8.96 9.97 8.82 8.52 9.71 平均 Mean 7.04 7.18 7.35 7.88 7.43 7.65 7.55 7.32 7.77 鉴于数据的可获得性, 未包括港澳台地区。In view of the availability of the data, Hong Kong, Macao and Taiwan are not included.
下载: 导出CSV
表 3 2002—2018年中国种植业碳补偿率基尼系数及其分解
Table 3. Gini coefficient and decomposition of carbon compensation rate of crops production of China from 2002 to 2018
年份
Year全国
Nation地区内 Within the region 地区间 Interregional 贡献率 Contribution rate (%) 东部
East中部
Central西部
West东部—中部
East-Central东部—西部
East-West中部—西部
Central-West地区内
Within the region地区间
Interregional超变密度
Hypervariable density2002 0.144 0.136 0.100 0.154 0.133 0.150 0.171 32.045 32.105 35.851 2003 0.147 0.151 0.100 0.144 0.145 0.157 0.179 31.603 36.380 32.017 2004 0.151 0.157 0.089 0.154 0.144 0.160 0.158 31.570 34.580 33.850 2005 0.151 0.153 0.102 0.148 0.150 0.157 0.165 31.339 38.818 29.843 2006 0.165 0.148 0.106 0.183 0.147 0.171 0.173 31.543 35.130 33.327 2007 0.177 0.167 0.094 0.205 0.152 0.196 0.166 32.352 33.207 34.441 2008 0.173 0.152 0.096 0.206 0.146 0.188 0.162 32.150 34.446 33.404 2009 0.168 0.150 0.083 0.202 0.139 0.184 0.144 32.065 33.719 34.216 2010 0.171 0.156 0.086 0.199 0.147 0.185 0.161 31.469 37.530 31.001 2011 0.182 0.157 0.089 0.223 0.147 0.197 0.150 31.639 35.003 33.359 2012 0.179 0.155 0.088 0.220 0.146 0.195 0.149 31.683 35.681 32.636 2013 0.189 0.164 0.094 0.233 0.154 0.206 0.149 31.779 34.741 33.480 2014 0.190 0.168 0.086 0.224 0.162 0.203 0.149 30.826 39.833 29.341 2015 0.190 0.177 0.090 0.218 0.166 0.204 0.147 30.767 39.627 29.606 2016 0.191 0.180 0.091 0.218 0.164 0.206 0.160 30.872 37.040 32.087 2017 0.217 0.224 0.111 0.218 0.203 0.228 0.160 29.702 40.566 29.732 2018 0.215 0.233 0.096 0.227 0.196 0.236 0.156 30.693 34.784 34.523 均值 Mean 0.176 0.166 0.094 0.199 0.155 0.190 0.159 31.417 36.070 32.513
下载: 导出CSV
表 4 2002—2018年中国不同区域种植业碳补偿率σ收敛系数
Table 4. σ convergence coefficient of carbon compensation rate of crops production in different regions of China from 2002 to 2018
年份 Year 全国 Nation 东部 East 中部 Central 西部 West 2002 0.2805 0.2533 0.2069 0.3323 2003 0.2805 0.2847 0.2076 0.2953 2004 0.2907 0.2897 0.2023 0.3296 2005 0.2983 0.2824 0.2262 0.3277 2006 0.3412 0.2776 0.2292 0.4307 2007 0.3832 0.3113 0.1938 0.4936 2008 0.3767 0.2938 0.2054 0.4924 2009 0.3544 0.2824 0.1666 0.4685 2010 0.3507 0.2942 0.1746 0.4526 2011 0.3647 0.2994 0.1880 0.4839 2012 0.3633 0.2920 0.1849 0.4809 2013 0.3807 0.3074 0.1991 0.5057 2014 0.3834 0.3089 0.1776 0.5034 2015 0.3731 0.3294 0.1833 0.4743 2016 0.3746 0.3399 0.1901 0.4782 2017 0.4034 0.4217 0.2213 0.4598 2018 0.3968 0.4365 0.1854 0.4702
下载: 导出CSV
表 5 2002—2018年中国种植业碳补偿率绝对β收敛结果
Table 5. Absolutely β convergence results of carbon compensation rate of crops prodcution in China from 2002 to 2018
变量 Variable 全国 Nation 东部 East 中部 Central 西部 West β −0.292***(−7.931) −0.140**(−2.449) −0.442***(−5.060) −0.400***(−6.252) 常数项 Constant term 0.671***(9.335) 0.319***(3.011) 1.006***(5.599) 0.927***(7.410) 样本量 Sample size 496 176 128 192 R2 0.0307 0.0648 0.1764 0.0568 ***、**和*分别表示在P<1%、P<5%和P<10%水平上显著。括号内为t统计量。***, ** and * represent significance at the levels of P<1%, P<5%, and P<10%, respectively. Inside parentheses is the t statistic.
下载: 导出CSV
表 6 2002—2018年中国种植业碳补偿率条件β收敛结果
Table 6. Conditions β convergence results of crops prodcution in China from 2002 to 2018
变量 Variable 全国 Nation 东部 East 中部 Central 西部 West β −0.413*** (−10.401) −0.409***(−5.813) −0.791***(−7.986) −0.445***(−6.496) 农业财政支出 Agricultural financial expenditure 0.003(0.932) 0.012**(2.193) −0.001(−0.206) −0.000(−0.051) 城镇化率 Urbanization rate −0.000(−0.201) 0.003(1.574) 0.000(0.040) −0.002(−0.700) 产业结构 Industrial structure 0.009***(3.395) 0.007(1.015) 0.011***(2.417) 0.003(0.351) 农业机械化 Agriculture mechanization 0.012(0.958) 0.027(0.582) 0.075***(3.387) 0.016(0.786) 农户文化程度 Farmer education level −0.112(−0.933) 0.089(0.367) −0.010(−0.036) −0.058 (−0.285) 劳动力非农转移 Non-agricultural transfer of labor force −0.047* (−1.669) −0.134** (−2.467) −0.014(−0.484) −0.051 (−0.602) 农业经营规模 Agricultural operation scale 0.247***(5.381) 0.399***(6.229) 0.078(0.619) 0.125(1.000) 农业经济发展水平 Agricultural economic development −0.096** (−2.476) −0.280***(−3.841) 0.076(0.988) 0.029(0.289) 常数项 Constant term 1.908***(5.236) 3.037***(3.966) 0.552(0.760) 1.306(1.444) 样本量 Sample size 496 176 128 192 R2 0.0193 0.0080 0.1068 0.0440 ***、**和*分别表示在P<1%、P<5%和P<10%水平上显著。括号内为 t 统计量。***, ** and * represent significance at the levels of P<1%, P<5%, and P<10%, respectively. Inside parentheses is the t statistic.
下载: 导出CSV
-
[1] 熊爱华, 丁友强, 胡玉凤. 低碳门槛下绿色创新补贴对全要素生产率的影响[J]. 资源科学, 2020, 42(11): 2184−2195 doi: 10.18402/resci.2020.11.11XIONG A H, DING Y Q, HU Y F. Impact of low-carbon subsidies and green innovation on total factor productivity in view of the threshold effect of carbon emission reduction[J]. Resources Science, 2020, 42(11): 2184−2195 doi: 10.18402/resci.2020.11.11 [2] 张金鑫, 王红玲. 中国畜牧业碳排放地区差异、动态演进与收敛分析−基于全国31个省(市)1997—2017年畜牧业数据[J]. 江汉论坛, 2020, (9): 41−48 doi: 10.3969/j.issn.1003-854X.2020.09.006ZHANG J X, WANG H L. Regional difference, dynamic evolutionary and convergence analysis on the Chinese animal husbandry—based on the animal husbandry data in 31 provinces from 1997 to 2007[J]. Jianghan Tribune, 2020, (9): 41−48 doi: 10.3969/j.issn.1003-854X.2020.09.006 [3] 陈菡, 陈文颖, 何建坤. 实现碳排放达峰和空气质量达标的协同治理路径[J]. 中国人口·资源与环境, 2020, 30(10): 12−18CHEN H, CHEN W Y, HE J K. Pathway to meet carbon emission peak target and air quality standard for ChinaFull text replacement[J]. China Population, Resources and Environment, 2020, 30(10): 12−18 [4] 胡志坚, 刘如, 陈志. 中国“碳中和”承诺下技术生态化发展战略思考[J]. 中国科技论坛, 2021, (5): 14−20HU Z J, LIU R, CHEN Z. Strategic thinking on the ecological development of technology under China’s “carbon neutrality” commitment[J]. Forum on Science and Technology in China, 2021, (5): 14−20 [5] 谢淑娟, 匡耀求, 黄宁生. 中国发展碳汇农业的主要路径与政策建议[J]. 中国人口·资源与环境, 2010, 20(12): 46−51 doi: 10.3969/j.issn.1002-2104.2010.12.010XIE S J, KUANG Y Q, HUANG N S. Main paths and policy proposals for the development of carbon-sinking agriculture in China[J]. China Population, Resources and Environment, 2010, 20(12): 46−51 doi: 10.3969/j.issn.1002-2104.2010.12.010 [6] 杨滨键, 孙红雨. 低碳绩效测度与动态效应研究−以山东省种植业为例[J]. 中国生态农业学报(中英文), 2021, 29(3): 581−589YANG B J, SUN H Y. Low carbon performance measurement and dynamic effects: A case study of the planting industry in Shandong Province[J]. Chinese Journal of Eco-Agriculture, 2021, 29(3): 581−589 [7] 张金鑫, 王红玲. 环境规制、农业技术创新与农业碳排放[J]. 湖北大学学报: 哲学社会科学版, 2020, 47(4): 147−156ZHANG J X, WANG H L. Analysis on environmental planning, agricultural technological innovation and agricultural carbon emission[J]. Journal of Hubei University: Philosophy and Social Science, 2020, 47(4): 147−156 [8] 张广胜, 王珊珊. 中国农业碳排放的结构、效率及其决定机制[J]. 农业经济问题, 2014, 35(7): 18−26, 110ZHANG G S, WANG S S. China’s agricultural carbon emission: structure, efficiency and its determinants[J]. Issues in Agricultural Economy, 2014, 35(7): 18−26, 110 [9] 陈炜, 殷田园, 李红兵. 1997—2015年中国种植业碳排放时空特征及与农业发展的关系[J]. 干旱区资源与环境, 2019, 33(2): 37−44CHEN W, YIN T Y, LI H B. Spatiotemporal distribution characteristics of carbon emission from plant industry and the relationship with agriculture development in China from 1997 to 2015[J]. Journal of Arid Land Resources and Environment, 2019, 33(2): 37−44 [10] 陈罗烨, 薛领, 雪燕. 中国农业净碳汇时空演化特征分析[J]. 自然资源学报, 2016, 31(4): 596−607 doi: 10.11849/zrzyxb.20150430CHEN L Y, XUE L, XUE Y. Spatial-temporal characteristics of China’s agricultural net carbon sink[J]. Journal of Natural Resources, 2016, 31(4): 596−607 doi: 10.11849/zrzyxb.20150430 [11] 李波, 张俊飚, 李海鹏. 中国农业碳排放时空特征及影响因素分解[J]. 中国人口·资源与环境, 2011, 21(8): 80−86 doi: 10.3969/j.issn.1002-2104.2011.08.013LI B, ZHANG J B, LI H P. Research on spatial-temporal characteristics and affecting factors decomposition of agricultural carbon emission in China[J]. China Population, Resources and Environment, 2011, 21(8): 80−86 doi: 10.3969/j.issn.1002-2104.2011.08.013 [12] 孙立成, 程发新, 李群. 区域碳排放空间转移特征及其经济溢出效应[J]. 中国人口·资源与环境, 2014, 24(8): 17−23 doi: 10.3969/j.issn.1002-2104.2014.08.003SUN L C, CHENG F X, LI Q. Characteristics and economic spillover effect of the regional carbon emissions transfer[J]. China Population, Resources and Environment, 2014, 24(8): 17−23 doi: 10.3969/j.issn.1002-2104.2014.08.003 [13] 颜廷武, 田云, 张俊飚, 等. 中国农业碳排放拐点变动及时空分异研究[J]. 中国人口·资源与环境, 2014, 24(11): 1−8 doi: 10.3969/j.issn.1002-2104.2014.11.001YAN T W, TIAN Y, ZHANG J B, et al. Research on inflection point change and spatial and temporal variation of China’s agricultural carbon emissions[J]. China Population, Resources and Environment, 2014, 24(11): 1−8 doi: 10.3969/j.issn.1002-2104.2014.11.001 [14] 梁青青. 我国农地资源利用的碳排放测算及驱动因素实证分析[J]. 软科学, 2017, 31(1): 81−84LIANG Q Q. Study on the scale and factor decomposition of carbon emissions of agricultural land resource utilization in China[J]. Soft Science, 2017, 31(1): 81−84 [15] 胡婉玲, 张金鑫, 王红玲. 中国农业碳排放特征及影响因素研究[J]. 统计与决策, 2020, 36(5): 56−62HU W L, ZHANG J X, WANG H L. Characteristics and influencing factors of agricultural carbon emission in China[J]. Statistics & Decision, 2020, 36(5): 56−62 [16] 程琳琳, 张俊飚, 田云, 等. 中国省域农业碳生产率的空间分异特征及依赖效应[J]. 资源科学, 2016, 38(2): 276−289CHENG L L, ZHANG J B, TIAN Y, et al. The spatial variation characteristics and dependency of agricultural carbon productivity in China[J]. Resources Science, 2016, 38(2): 276−289 [17] 伍国勇, 孙小钧, 于福波, 等. 中国种植业碳生产率空间关联格局及影响因素分析[J]. 中国人口·资源与环境, 2020, 30(5): 46−57WU G Y, SUN X J, YU F B, et al. Spatial correlation pattern and influencing factors of China’s crop production carbon productivity[J]. China Population, Resources and Environment, 2020, 30(5): 46−57 [18] 宋博, 穆月英, 侯玲玲. 农户专业化对农业低碳化的影响研究−来自北京市蔬菜种植户的证据[J]. 自然资源学报, 2016, 31(3): 468−476 doi: 10.11849/zrzyxb.20150214SONG B, MU Y Y, HOU L L. Study on the effect of farm households’ specialization on low-carbon agriculture: evidence from vegetable growers in Beijing, China[J]. Journal of Natural Resources, 2016, 31(3): 468−476 doi: 10.11849/zrzyxb.20150214 [19] 王钰乔, 濮超, 赵鑫, 等. 中国小麦、玉米碳足迹历史动态及未来趋势[J]. 资源科学, 2018, 40(9): 1800−1811WANG Y Q, PU C, ZHAO X, et al. Historical dynamics and future trends of carbon footprint of wheat and maize in China[J]. Resources Science, 2018, 40(9): 1800−1811 [20] 尚杰, 杨滨键. 区域农业碳足迹动态影响效应研究−以潍坊市种植业为例[J]. 农村经济, 2020, (5): 75−82SHANG J, YANG B J. The dynamic effect of regional agricultural carbon footprint: A case of Weifang’s planting industry[J]. Rural Economy, 2020, (5): 75−82 [21] 张灿强, 王莉, 华春林, 等. 中国主要粮食生产的化肥削减潜力及其碳减排效应[J]. 资源科学, 2016, 38(4): 790−797ZHANG C Q, WANG L, HUA C L, et al. Potentialities of fertilizer reduction for grain produce and effects on carbon emissions[J]. Resources Science, 2016, 38(4): 790−797 [22] 周迪, 郑楚鹏, 华诗润, 等. 公平与效率协调视角下的中国碳减排潜力与路径[J]. 自然资源学报, 2019, 34(1): 80−91 doi: 10.31497/zrzyxb.20190107ZHOU D, ZHENG C P, HUA S R, et al. The potentialities and paths of China’s carbon emission reduction based on the coordination of fairness and efficiency[J]. Journal of Natural Resources, 2019, 34(1): 80−91 doi: 10.31497/zrzyxb.20190107 [23] 鲁丰先, 张艳, 秦耀辰, 等. 中国省级区域碳源汇空间格局研究[J]. 地理科学进展, 2013, 32(12): 1751−1759 doi: 10.11820/dlkxjz.2013.12.004LU F X, ZHANG Y, QIN Y C, et al. Spatial patterns of provincial carbon source and sink in China[J]. Progress in Geography, 2013, 32(12): 1751−1759 doi: 10.11820/dlkxjz.2013.12.004 [24] 杨果, 陈瑶. 中国农业源碳汇估算及其与农业经济发展的耦合分析[J]. 中国人口·资源与环境, 2016, 26(12): 171−176YANG G, CHEN Y. China’s agriculture carbon sink estimation and its coupling analysis with agricultural economy development[J]. China Population, Resources and Environment, 2016, 26(12): 171−176 [25] 田云, 张俊飚, 吴贤荣, 等. 中国种植业碳汇盈余动态变化及地区差异分析−基于31个省(市、区)2000—2012年的面板数据[J]. 自然资源学报, 2015, 30(11): 1885−1895 doi: 10.11849/zrzyxb.2015.11.009TIAN Y, ZHANG J B, WU X R, et al. Research on dynamic change and regional differences of China’s planting industry carbon sink surplus[J]. Journal of Natural Resources, 2015, 30(11): 1885−1895 doi: 10.11849/zrzyxb.2015.11.009 [26] 尚杰, 杨滨键. 种植业碳源、碳汇测算与净碳汇影响因素动态分析: 山东例证[J]. 改革, 2019, (6): 123−134SHANG J, YANG B J. Estimation of carbon source and carbon sequestration in planting industry and dynamic analysis of influencing factors of net carbon sequestration: a case study of Shandong Province[J]. Reform, 2019, (6): 123−134 [27] 张巍. 陕西省重点生态功能区碳汇/碳源核算与生态补偿研究[J]. 生态经济, 2018, 34(10): 191−194ZHANG W. The study of carbon sink and carbon source accounting and ecological compensation in key ecological functional areas of Shaanxi Province[J]. Ecological Economy, 2018, 34(10): 191−194 [28] 赵荣钦, 张帅, 黄贤金, 等. 中原经济区县域碳收支空间分异及碳平衡分区[J]. 地理学报, 2014, 69(10): 1425−1437 doi: 10.11821/dlxb201410003ZHAO R Q, ZHANG S, HUANG X J, et al. Spatial variation of carbon budget and carbon balance zoning of Central Plains Economic Region at county-level[J]. Acta Geographica Sinica, 2014, 69(10): 1425−1437 doi: 10.11821/dlxb201410003 [29] 赵荣钦, 刘英, 马林, 等. 基于碳收支核算的河南省县域空间横向碳补偿研究[J]. 自然资源学报, 2016, 31(10): 1675−1687 doi: 10.11849/zrzyxb.20151291ZHANG R Q, LIU Y, MA L, et al. County-level carbon compensation of Henan Province based on carbon budget estimation[J]. Journal of Natural Resources, 2016, 31(10): 1675−1687 doi: 10.11849/zrzyxb.20151291 [30] 王刚, 张华兵, 薛菲, 等. 成都市县域土地利用碳收支与经济发展关系研究[J]. 自然资源学报, 2017, 32(7): 1170−1182WANG G, ZHANG H B, XUE F, et al. Relations between land use carbon budget and economic development at county level in Chengdu City[J]. Journal of Natural Resources, 2017, 32(7): 1170−1182 [31] 魏燕茹, 陈松林. 福建省土地利用碳排放空间关联性与碳平衡分区[J/OL]. 生态学报, 2021(14): 1−11. [2021-05-21]. http://kns.cnki.net/kcms/detail/11.2031.Q.20210512.0920.036.htmlWEI Y R, CHEN S L. Spatial correlation and carbon balance zoning of land use carbon emissions in Fujian Province[J/OL]. Acta Ecologica Sinica, 2021(14): 1−11. [2021-05-21]. http://kns.cnki.net/kcms/detail/11.2031.Q.20210512.0920.036.html [32] 吴昊玥, 何艳秋, 陈文宽, 等. 中国农业碳补偿率空间效应及影响因素研究−基于空间Durbin模型[J]. 农业技术经济, 2020, (3): 110−123WU H Y, HE Y Q, CHEN W K, et al. Spatial effect and influencing factors of China’s agricultural carbon compensation rate based on spatial durbin model[J]. Journal of Agrotechnical Economics, 2020, (3): 110−123 [33] 王梁, 赵杰, 陈守越. 山东省农田生态系统碳源、碳汇及其碳足迹变化分析[J]. 中国农业大学学报, 2016, 21(7): 133−141WANG L, ZHAO J, CHEN S Y. Analysis of ecosystem carbon sources/sinks and carbon footprint in farmland ecosystem of Shandong Province[J]. Journal of China Agricultural University, 2016, 21(7): 133−141 [34] DAGUM C. A new approach to the decomposition of the Gini income inequality ratio[J]. Empirical Economics, 1997, 22(4): 515−531 doi: 10.1007/BF01205777 [35] 刘帅. 中国经济增长质量的地区差异与随机收敛[J]. 数量经济技术经济研究, 2019, 36(9): 24−41LIU S. Research on the regional differences decomposition and convergence mechanism of economic quality in China[J]. The Journal of Quantitative & Technical Economics, 2019, 36(9): 24−41 -

 下载:
下载:


 点击查看大图

计量
- 文章访问数: 436
- HTML全文浏览量: 152
- PDF下载量: 106
- 被引次数: 0
