

Research progress of greenhouse gas emissions and sequestration of the Chinese food system
-
摘要: 我国食物系统温室气体核算研究相对缺乏, 相关研究多散见于农业和畜牧业部门, 难以满足碳达峰、碳中和背景下减排和固碳的需求。本文提出了一个涵盖土地利用、土地利用变化和林业(LULUCF)、农业生产、产后食物供应部门的食物系统温室气体排放与吸收的核算框架; 通过文献综述、温室气体排放量收集和排放参数推算, 剖析了各环节排放核算方法的差异和排放参数的不确定性。结果表明, 粪尿和秸秆还田、农药和农膜生产、食物加工、批发和零售以及草地的碳排放(或吸收)参数的变异系数(CVs)在35%以上。未来食物系统温室气体核算研究需: 1)在农业生产部门, 细化农业活动排放参数, 整合基于终端能源消费和农业生产过程的温室气体核算方法, 并加强农业投入品能耗研究; 2)在LULUCF部门, 建立适用于全球变化研究的土地利用分类体系, 识别食物系统相关的土地利用过程, 将实地调查核算法和基于过程模型的核算方法相互校验; 3)在产后食物供应部门, 明确各环节排放的核算范围, 有针对性地选择投入产出-生命周期评价法(EIO-LCA)、基于过程的生命周期评价法(PLCA)与终端能源消费核算法等。本文可进一步为食物系统温室气体减排提供科学依据。Abstract: Studies on the country’s food system and greenhouse gas (GHG) accounting are still lacking in China. Most of previous studies have focused on crop and livestock production, which are hard to meet the demands of both GHG reduction and sequestration, against the backdrop of the “carbon peak and neutrality” policy. In this study, we proposed a food system GHG accounting framework that covers land use, land use change, and forests (LULUCF); agricultural production; and post-production food supply sectors. Through literatures review, collecting emission data, and reverse-calculating emission factors, we analyzed the differences in accounting methods and the uncertainties of emission parameters for various GHG emission (or sequestration) segments in the Chinese food system. Results showed that the coefficients of variables (CVs) of the emission or storage parameters of manure and crop straw application, pesticides and film production, food processing, food retail and wholesale, and grassland sinks were above 35%. Our suggestions for future studies are as follows: 1) in the agricultural production sector: refine emission factors of agricultural activities, harmonize different energy use accounting methods (e.g., final energy consumption accounting and process-based accounting methods), and reinforce research on energy consumption of agricultural input manufacturing enterprises; 2) in the LULUCF sector: establish the land use classification dedicated to global change research, identify the land use processes associated with the food system, and cross-check the field measure-based accounting method and the process-based accounting method; 3) in the post-production food supply sector: clarify the accounting scopes of each stage and select the environmental input-output life cycle assessment method, the process-based life cycle assessment method, or the final energy consumption accounting method. This study could further provide scientific basis for GHG reduction in food systems.
-
Key words:
- Food system /
- Greenhouse gas emission /
- Accounting methods comparison /
- Carbon neutrality
-

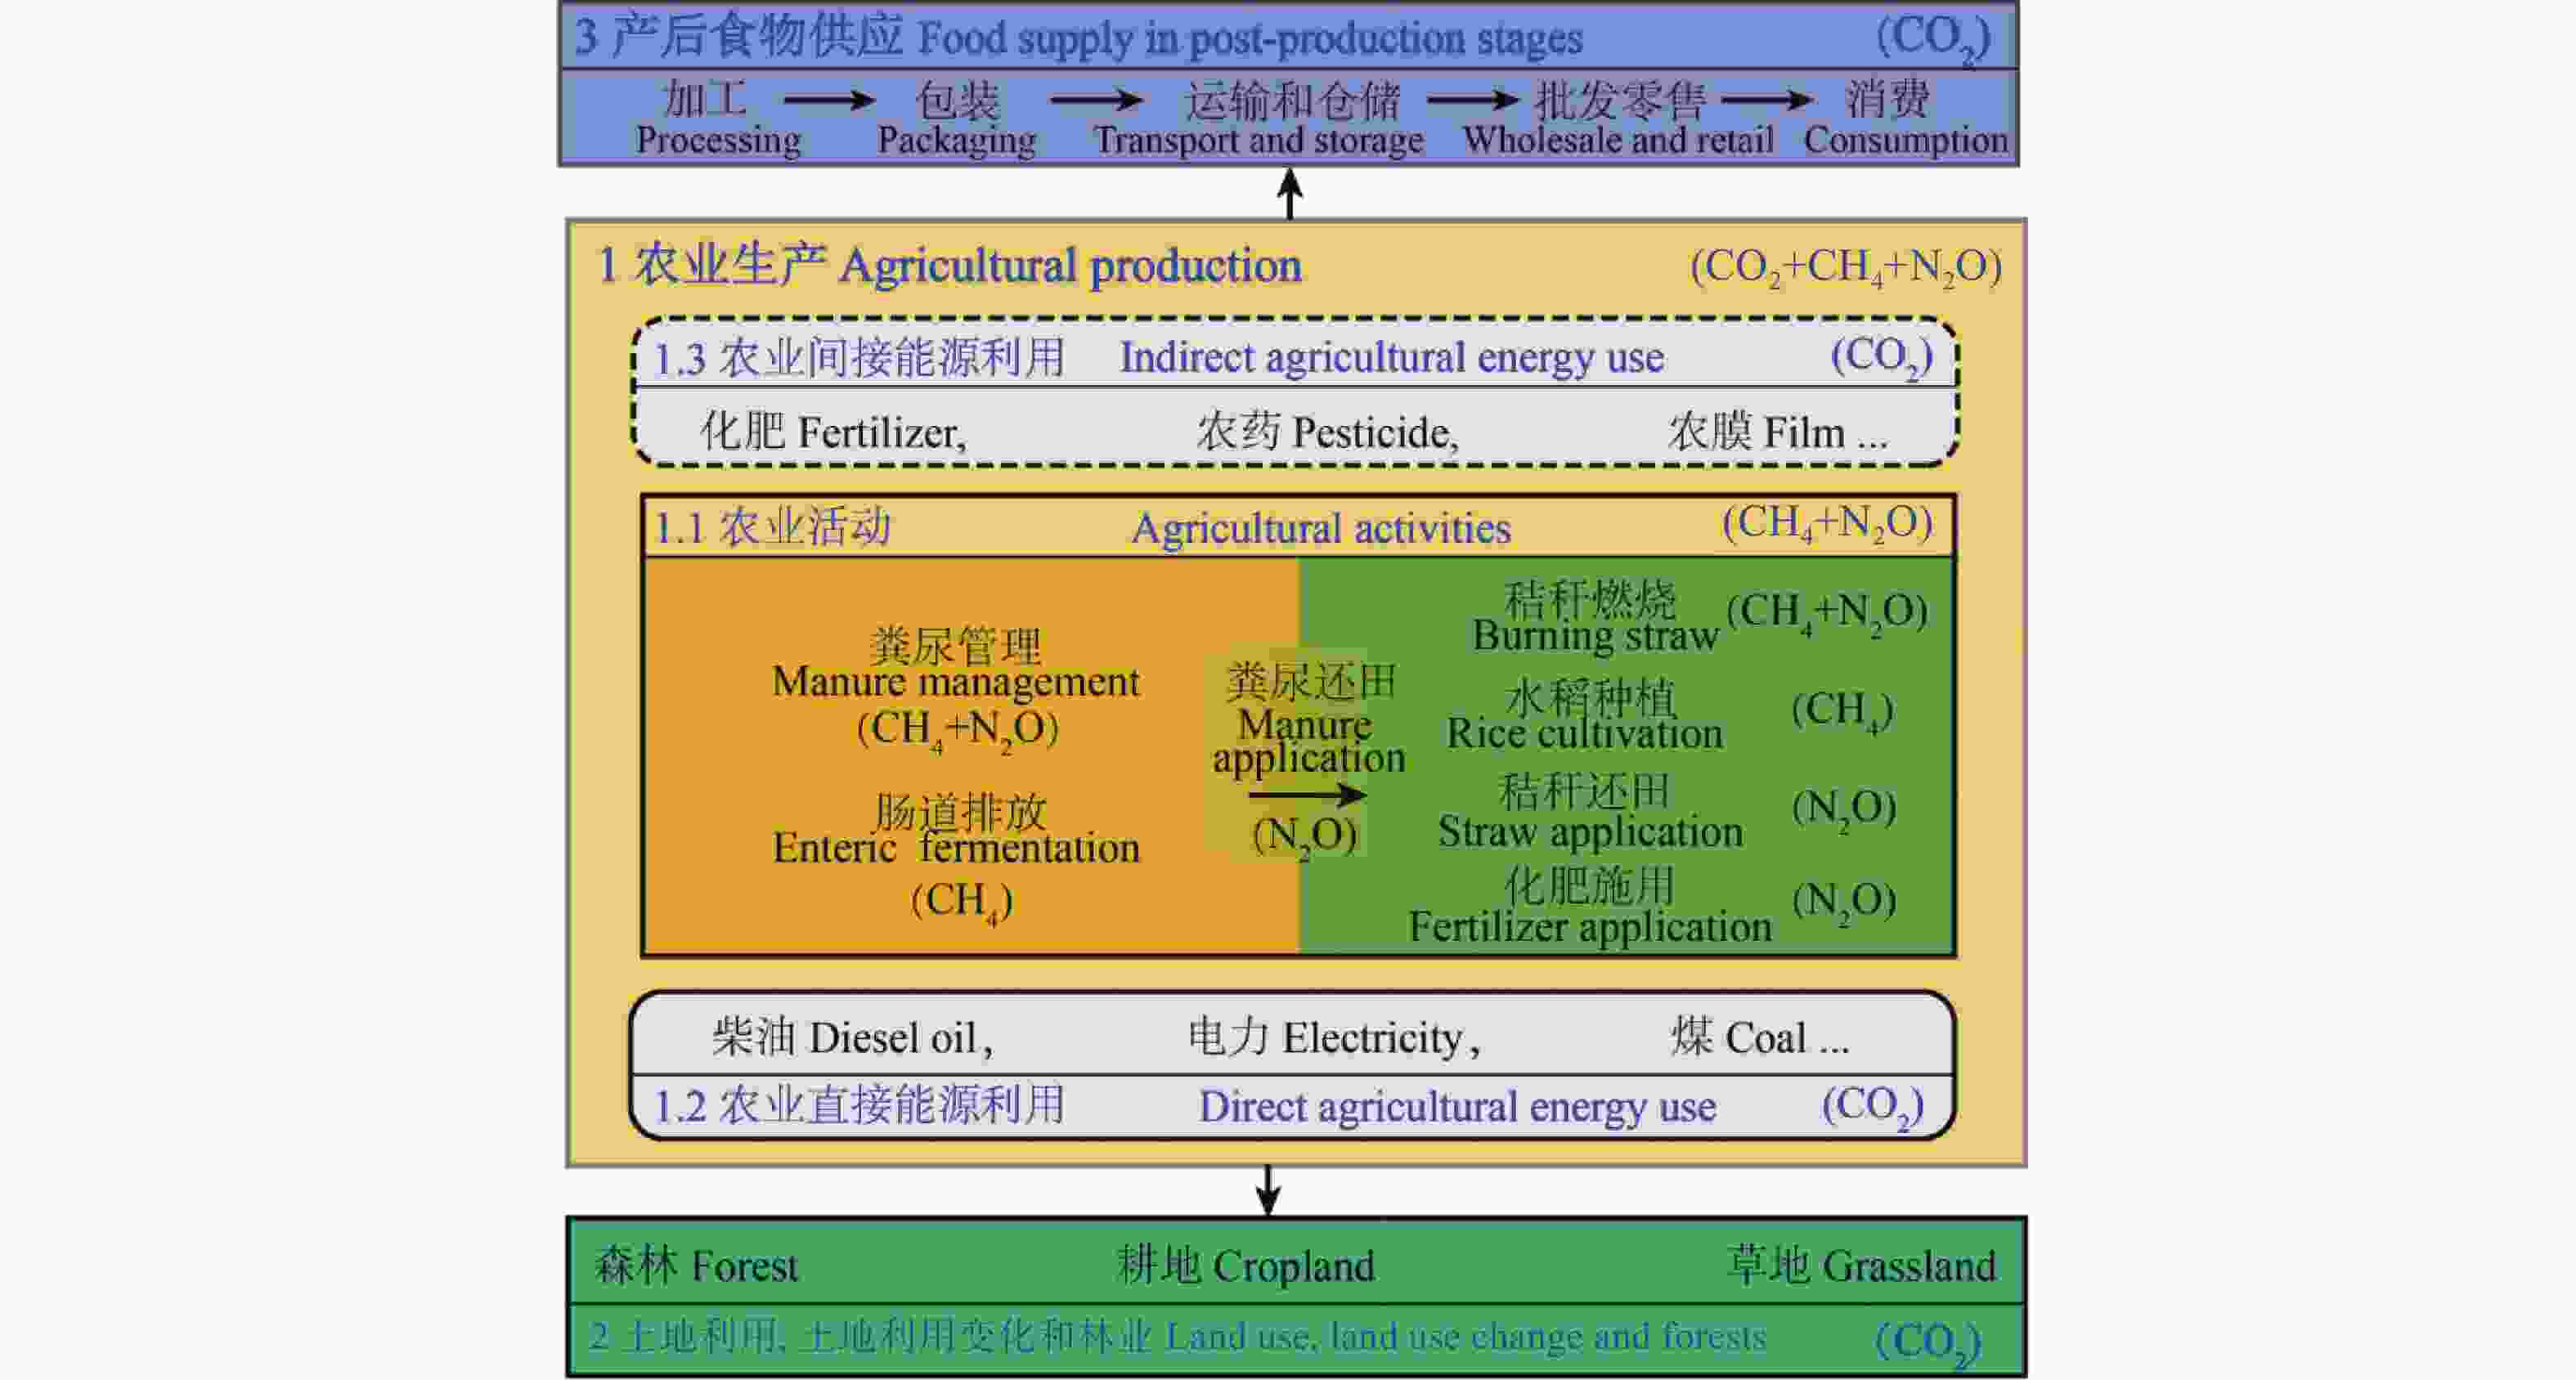
图 1 食物系统温室气体核算边界
Figure 1. Accounting framework of food system greenhouse gas (GHG) emission
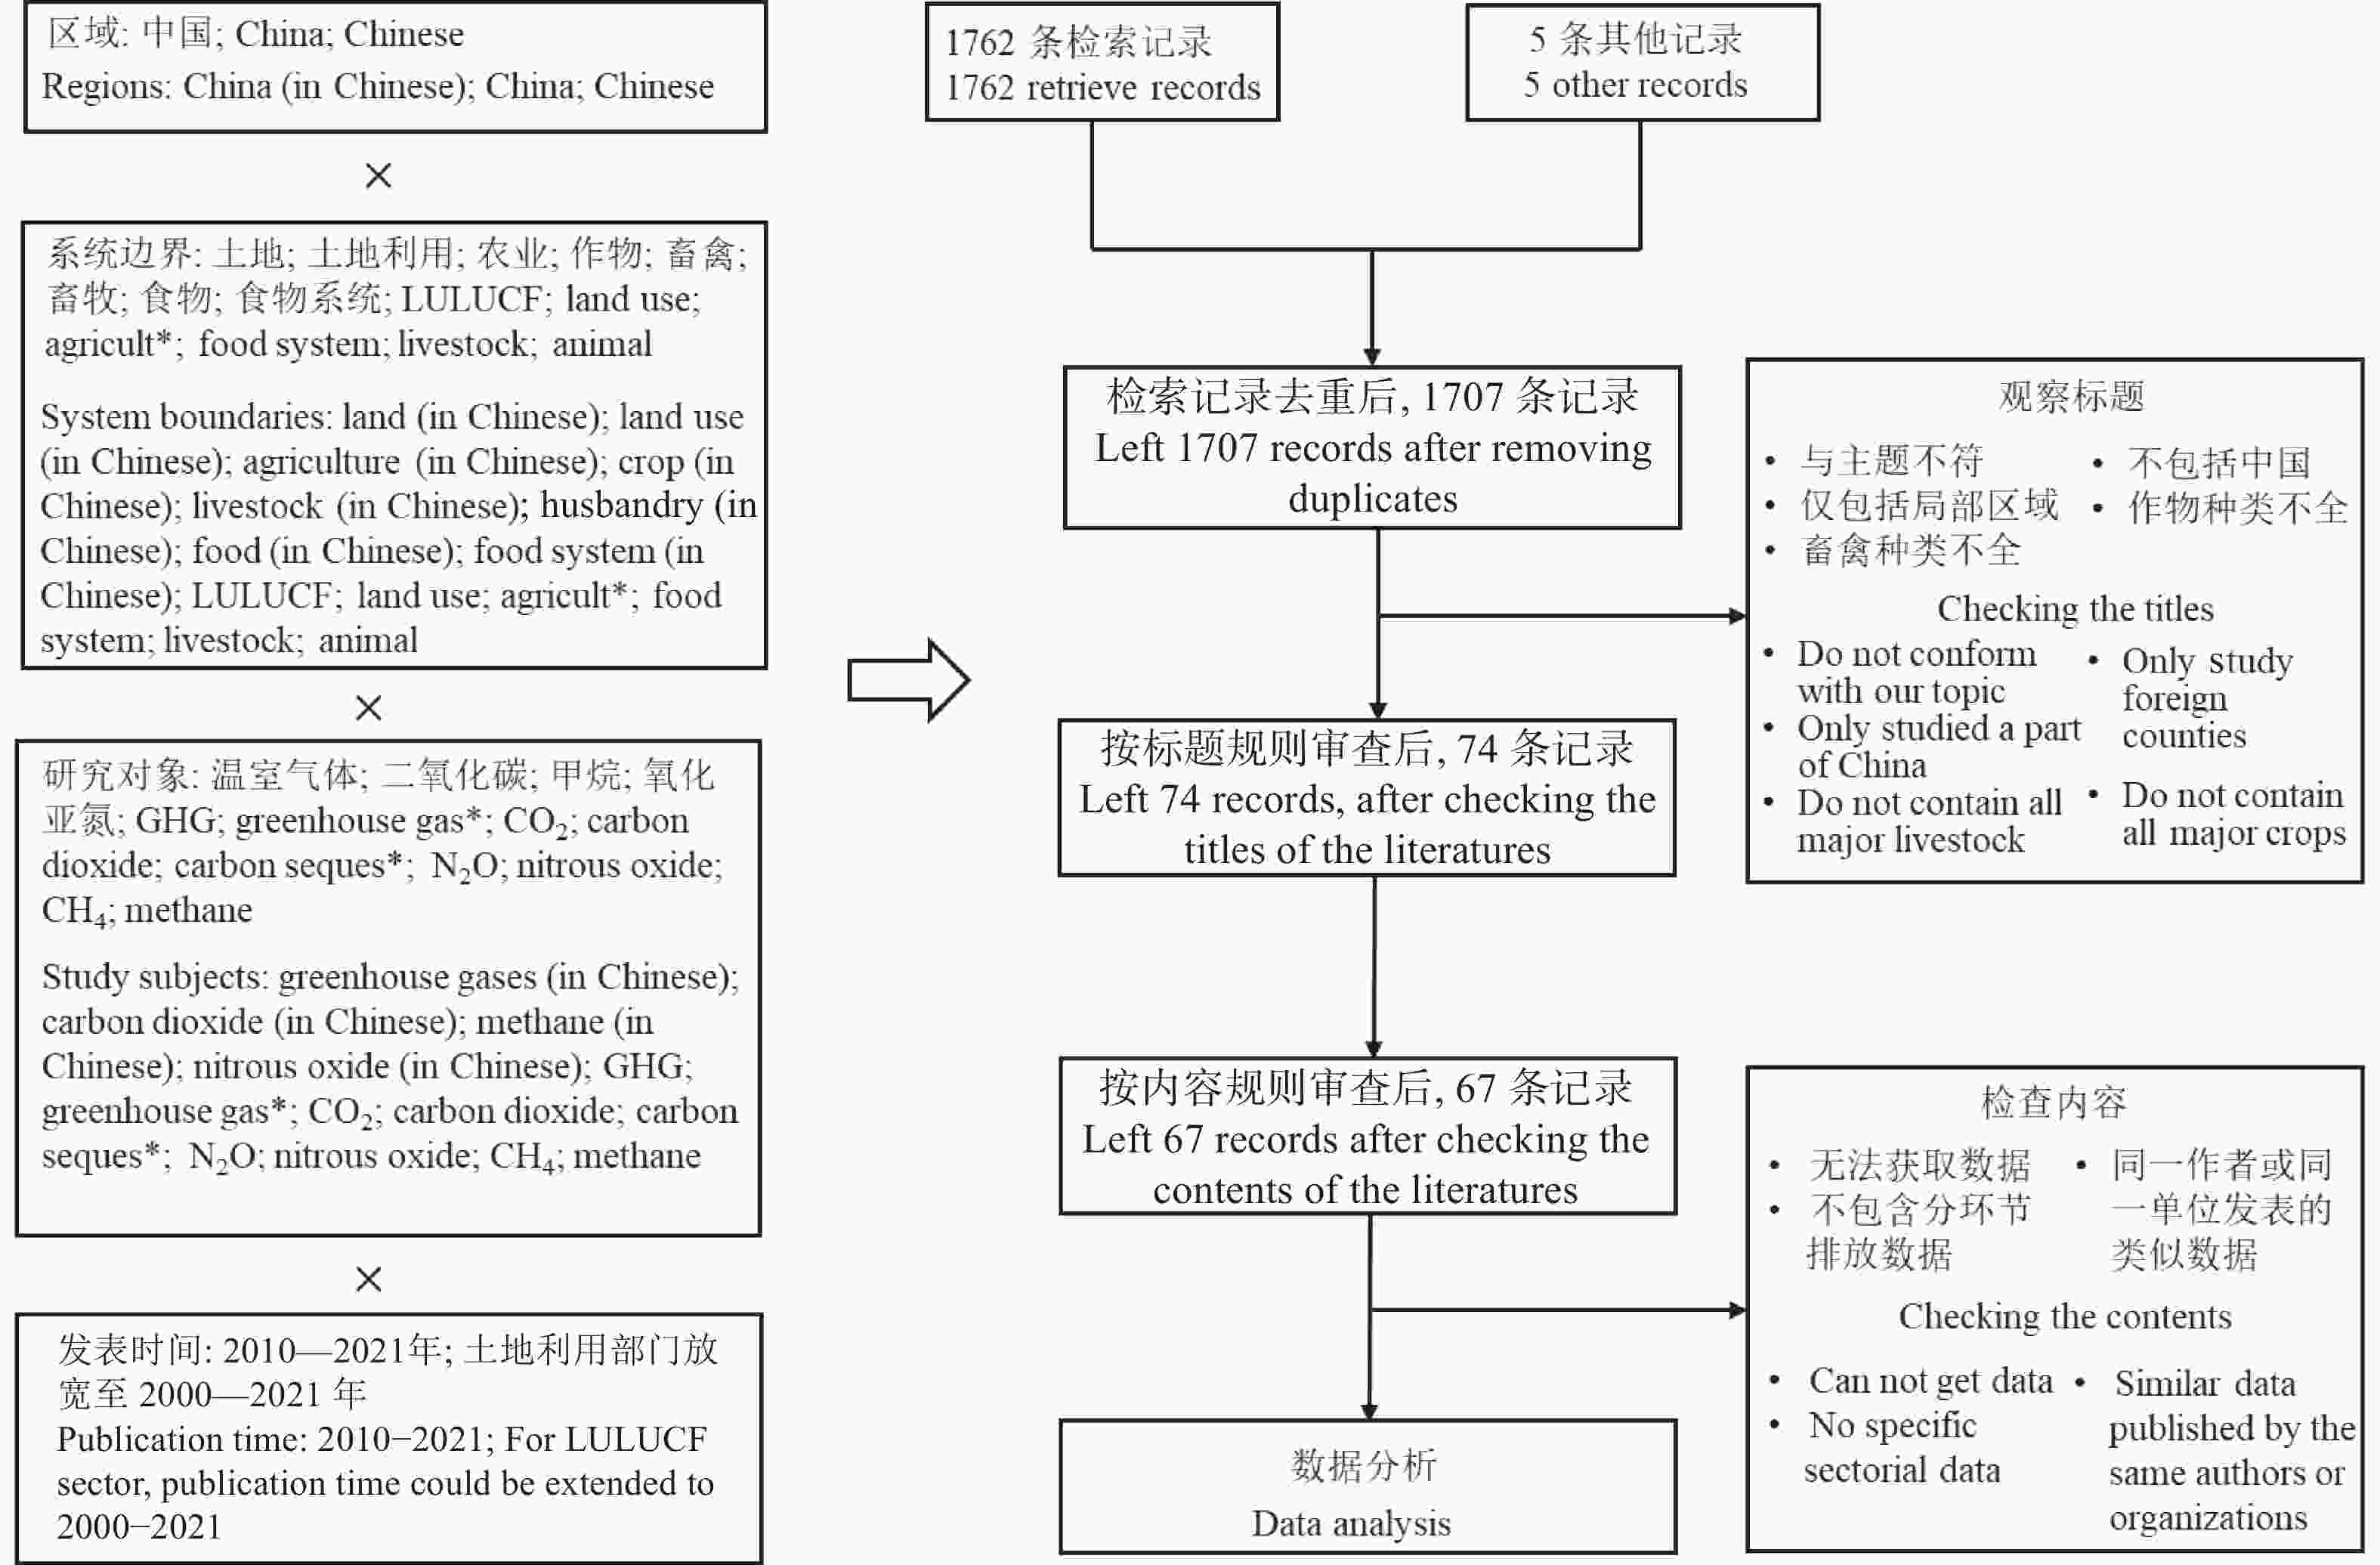
图 2 文献数据收集流程
LULUCF: 土地利用、土地利用变化和林业。LULUCF: land use, land use change and forests.
Figure 2. Process of literature data collection
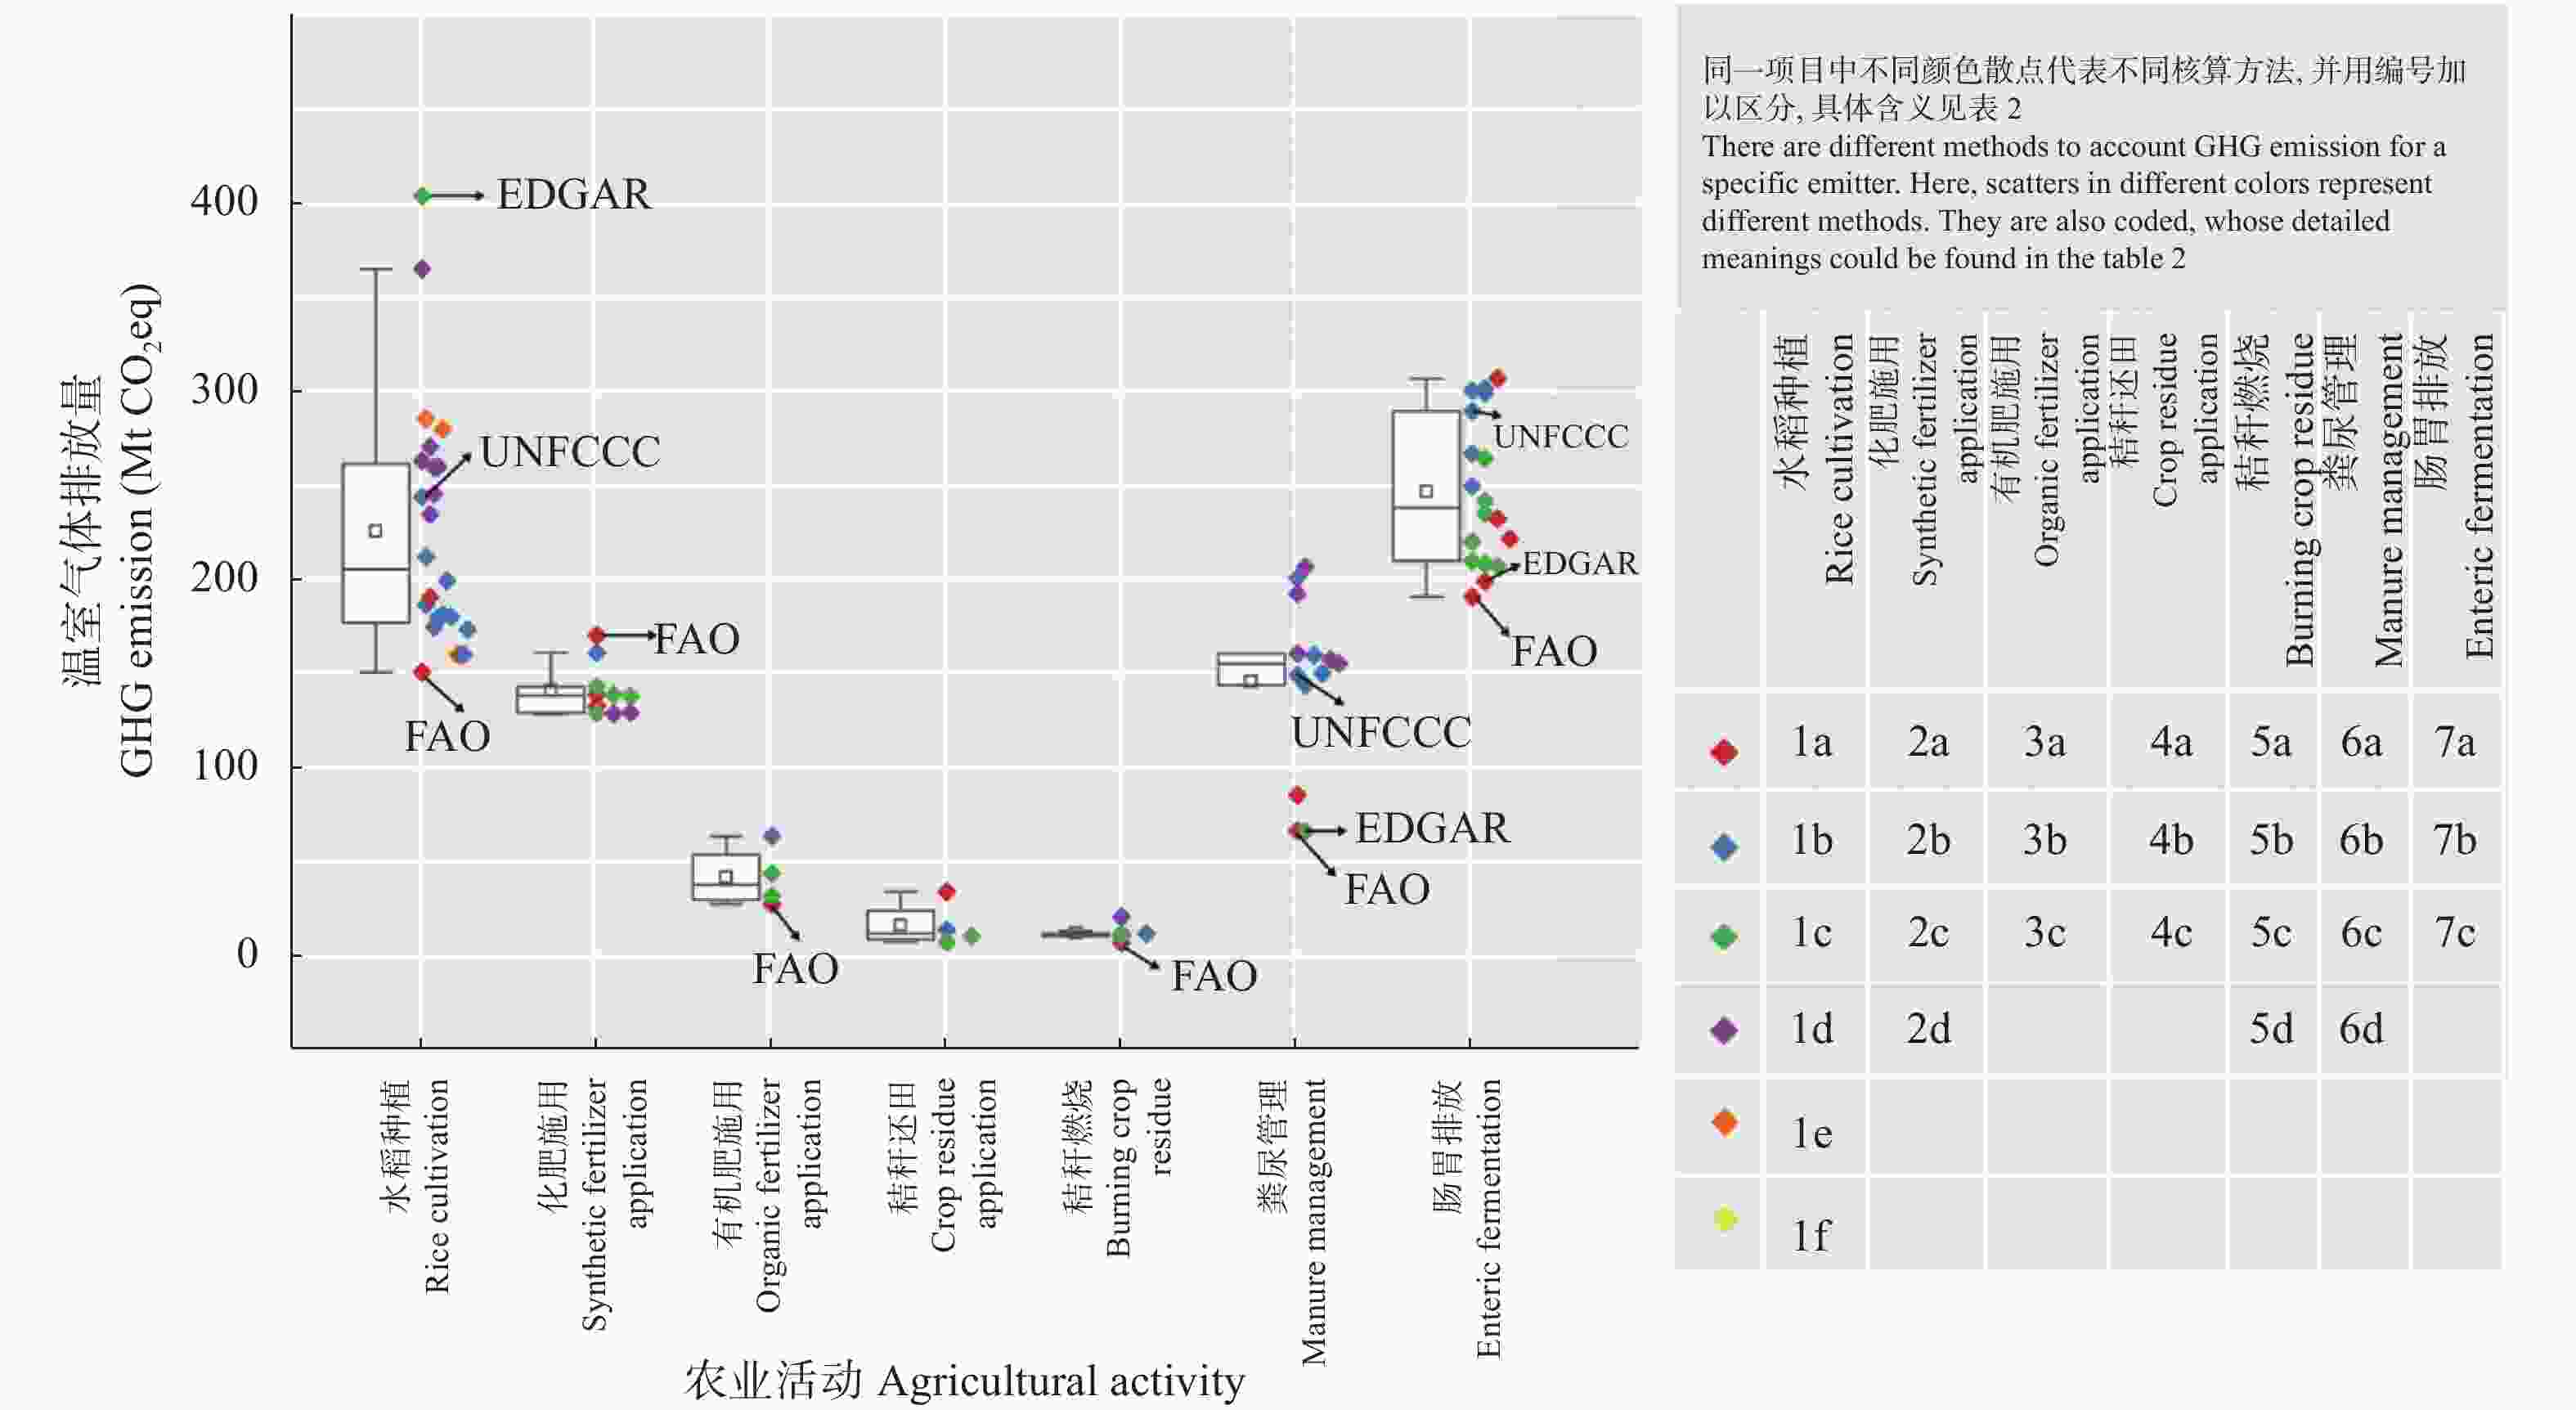
图 3 2005—2015年农业活动导致的年均温室气体排放
图3中的箭头单独指出了UNFCCC、EDGAR和FAO等权威数据库的温室气体核算值, 可相互进行比较或作为基准与其他核算结果比较; 图例中对不同核算方法进行了编号, 且该编号与表2中和文中的方法编号相对应, 便于比较和说明不同核算方法间的差异。Accounting values from authoritative database (including UNFCCC, EDGAR, FAO) are pointed out with arrows, which could compare with each other or with other accounting results as reference values. Different methods are coded in legends. And the codes are consistent with those in the table 2 and in text, which are used to compare and illustrate the differences between methods.
Figure 3. Annual greenhouse gas (GHG) emission induced by agricultural activities during 2005−2015
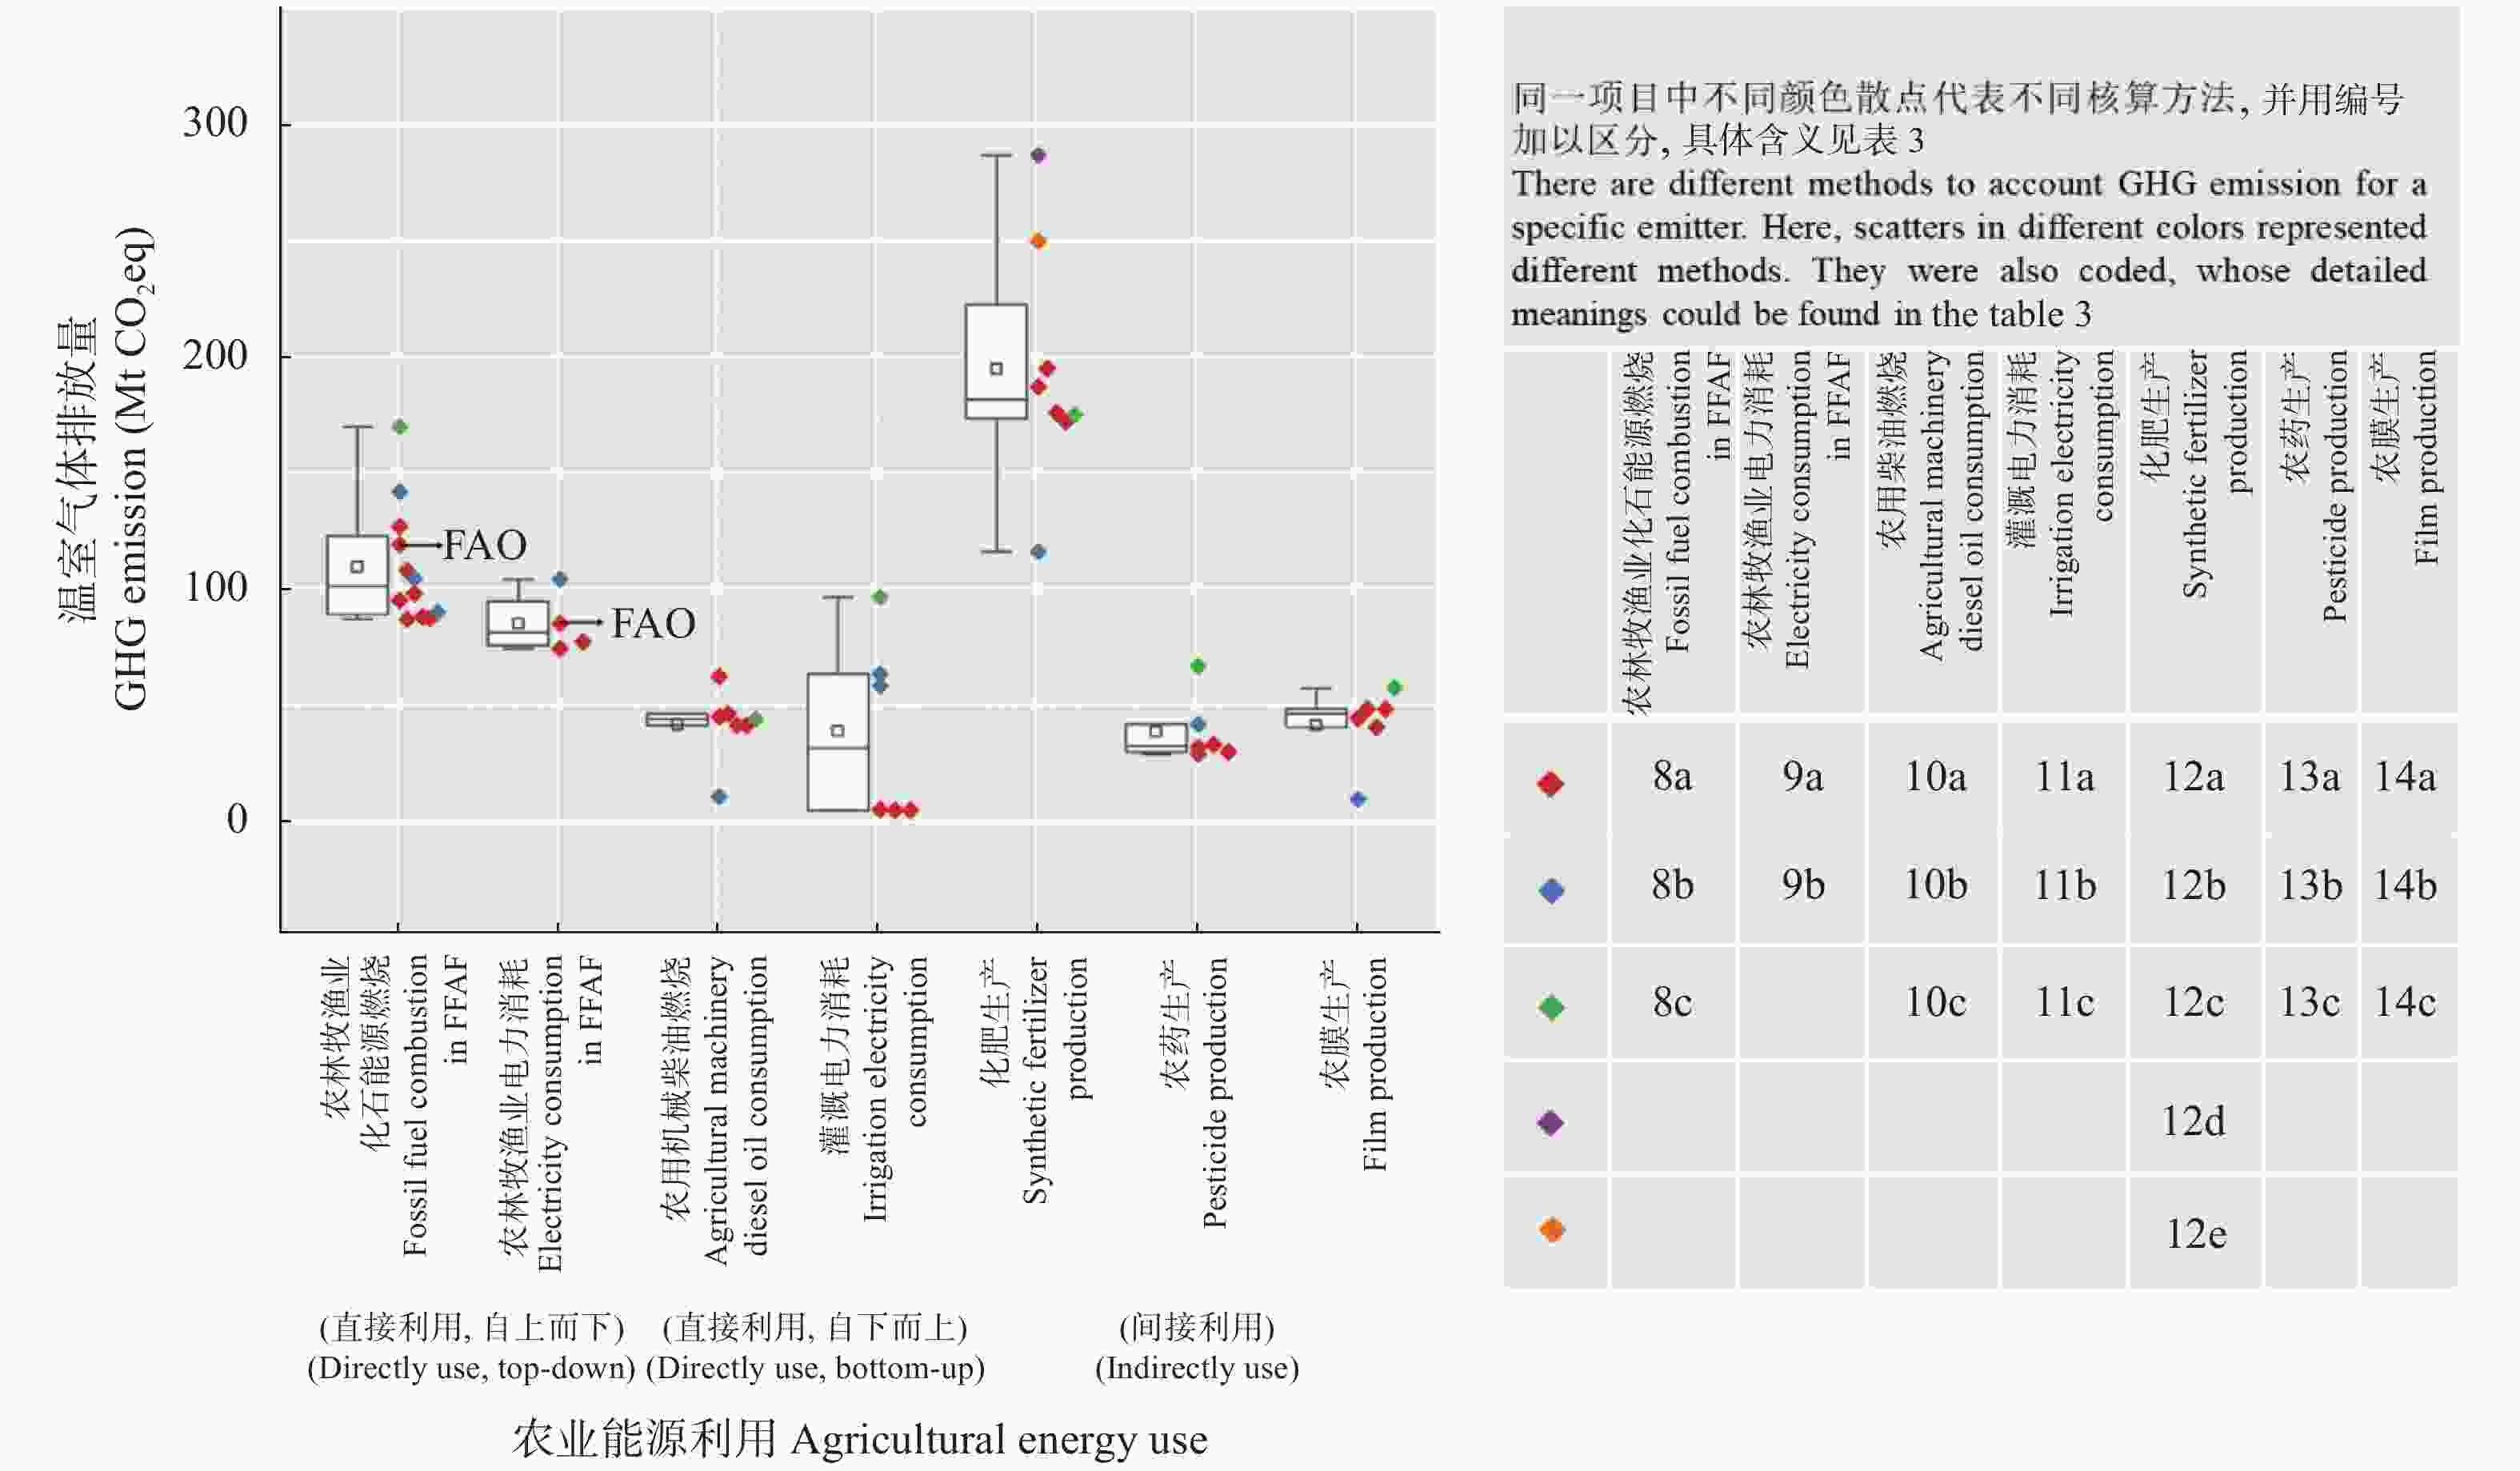
图 4 2005—2015年农业生产中能源消耗造成的年均温室气体排放量
图4中的箭头单独指出了UNFCCC、EDGAR和FAO等权威数据库的温室气体核算值, 可相互进行比较或作为基准与其他核算结果比较; 图例中对不同核算方法进行了编号, 且该编号与表3中和文中的方法编号相对应, 便于比较和说明不同核算方法间的差异。FFAF: farming, forestry, animal husbandy and fishery. Accounting values from authoritative database (including UNFCCC, EDGAR, FAO) are pointed out with arrows, which could compare with each other or with other accounting results as reference values. Different methods are coded in legends. And the codes are consistent with those in the table 3 and in text, which are used to compare and illustrate the differences between methods.
Figure 4. Annual greenhouse gas (GHG) emission induced by agricultural energy use during 2005−2015
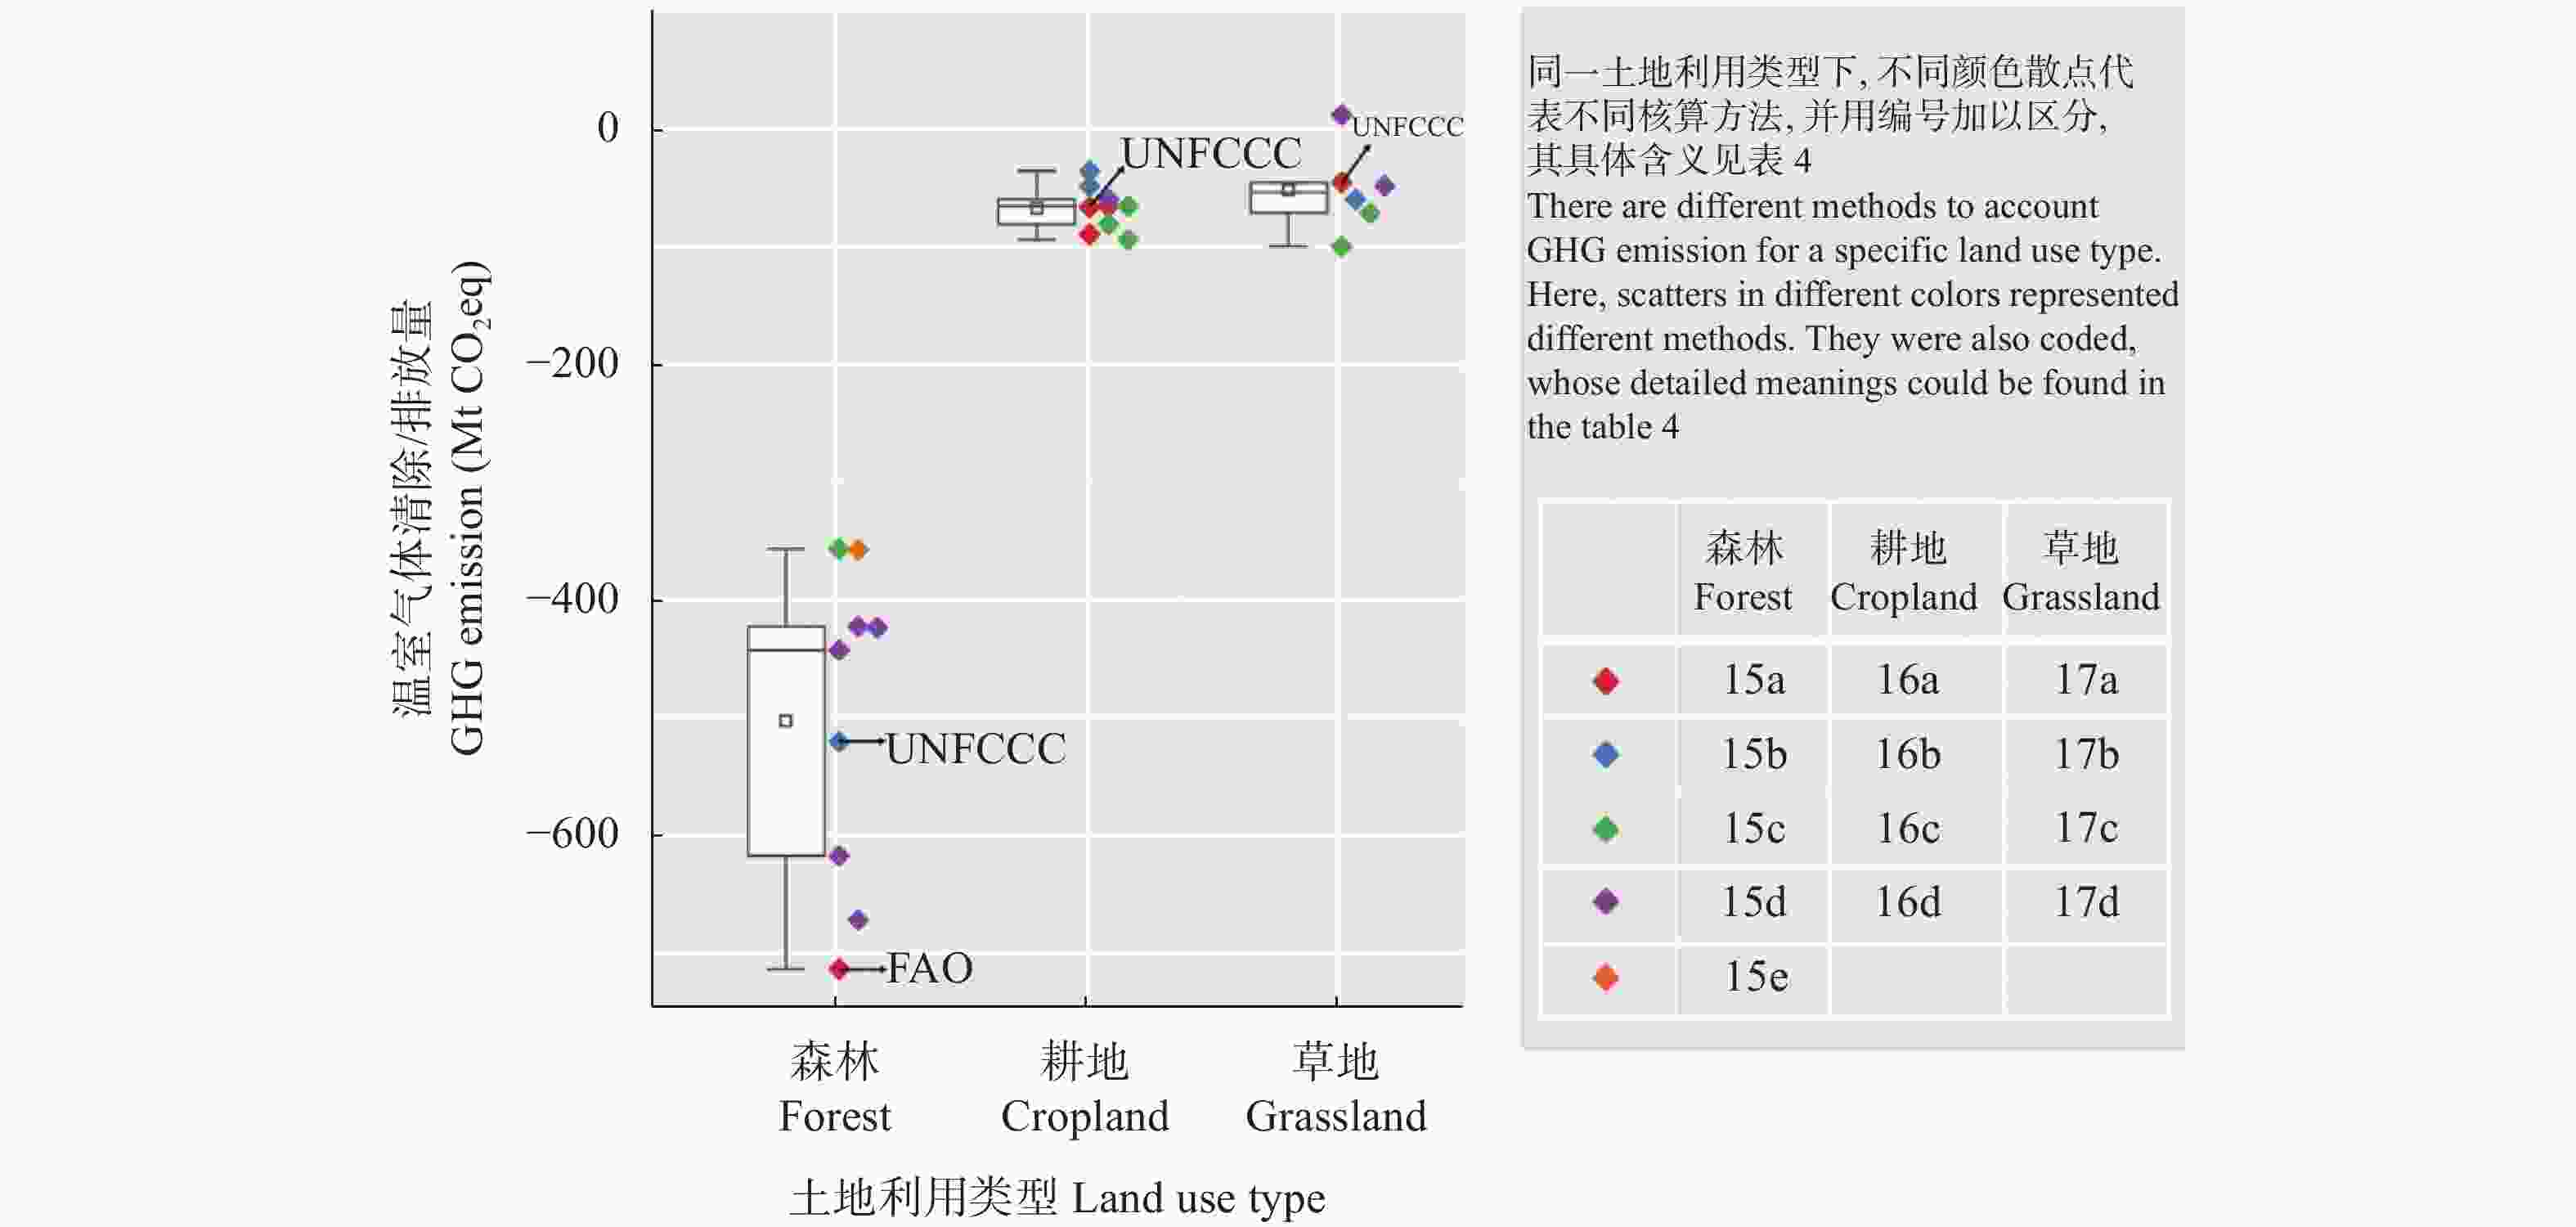
图 5 1980s—2010s年均土地利用、土地利用变化和林业的温室气体吸收量
图5中的箭头单独指出了UNFCCC、EDGAR和FAO等权威数据库的温室气体核算值, 可相互进行比较或作为基准与其他核算结果比较; 图例中对不同核算方法进行了编号, 且该编号与表4中和文中的方法编号相对应, 便于比较和说明不同核算方法间的差异。Accounting values from authoritative database (including UNFCCC, EDGAR, FAO) are pointed out with arrows, which could compare with each other or with other accounting results as reference values. Different methods are coded in legends. And the codes are consistent with those in the table 4 and in text, which are used to compare and illustrate the differences between methods.
Figure 5. Annual greenhouse gas (GHG) removed by land use, land use change and forests (LULUCF) between 1980s and 2010s
表 1 中国食物系统各环节排放核算的活动数据缺省值
Table 1. Default activity data for different emission segments in the food system in China
环节
Emission source or sink活动数据
Activity data in 2015单位
Unit缺省活动数据来源及说明
Default data source and remarks水稻种植
Rice cultivation水田面积
Rice paddy areaMhm2 FAOSTAT[22] 化肥施用
Synthetic fertilizer application氮肥和复合肥的氮量
N in straight and compound fertilizerMt N FAOSTAT[22] 有机肥施用
Organic fertilizer application畜禽粪尿和饼肥的还田氮量
N in applied livestock manure and cake fertilizerMt N 有机肥资源量为牛新胜等[27]、Zhou等[20]估算的2005—2010年各类有机肥资源量的平均值, 还田比例为Zhou等[20]和Ma等[28]报告的平均值
The amount of organic fertilizer resource originates from Niu et al.[27] and Zhou et al.[20], whose study period is between 2005 and 2010 (in average). And the rate of organic fertilizer returning originates from Zhou et al.[20] and Ma et al.[28] (in average).粪尿管理
Manure management畜禽存栏量, 转换为标准动物单位(LU), 转换方法见Eurostat[29]
Stock number of livestock, measured in standard livestock unit (LU). The method of unit conversion is available in Eurostat[29].MLU FAOSTAT[22] 肠道排放
Enteric fermentation牲畜存栏量(不包括家禽数量), 转换为标准动物头数(LU)
Stock number of large livestock (excluding poultries), measured in LU.MLU FAOSTAT[22] 秸秆燃烧
Burning crop residue用于燃烧的秸秆生物量(DM, 干重)
Amount of burned crop residue, measured in dry matter (DM)Mt DM 秸秆资源量参考牛新胜等[27]估算的2005—2010年秸秆资源平均值, 干重比参考省级温室气体清单编制指南[30], 秸秆燃烧比例为Zhou等[20]、刘晓永[31]和Ma等[28]报告的燃烧比例平均值
The amount of crop residue resource originates from Niu et al.[27], whose study period is 2005−2010. The ratio of dry weight to fresh weight originates from Guideline for Provincial Greenhouse Gas Emission Inventories[30]. And the crop residue burning ratio originates from Zhou et al.[20], Liu[31] and Ma et al.[28] (in average).秸秆还田
Crop residue application秸秆还田氮量
N in applied crop residueMt N 秸秆资源量参考牛新胜等[27]估算的2005—2010年秸秆资源平均值, 秸秆还田比例为Zhou 等[20]、刘晓永[31]和Ma等[28]报告的还田比例平均值
The amount of crop residue resource originates from Niu et al.[27], whose reported time was 2005−2010. And the rate of crop residue returning originates from Zhou et al.[20], Liu[31] and Ma et al.[28] (in average).农业化石能源消耗
Agricultural fossil fuel consumption农林牧渔业化石能源终端消费量, 以标准煤当量计(ce)
Fossil fuel consumed by farming, forestry, animal husbandry and fishery (FFAF), measured in standard coal equivalent (ce)Mt ce 中国能源年鉴[32]
China Energy Statistic Yearbook [32]农业电力消耗
Agricultural electricity consumption农林牧渔业电力终端消费量, 以标准煤计(ce)
Electricity consumed by FFAF, measured in standard coal equivalent (ce)Mt ce 中国能源年鉴[32]
China Energy Statistic Yearbook [32]化肥生产
Synthetic fertilizer production化肥施用量(折纯), 包括氮、磷、钾肥和复合肥
Amount of synthetic fertilizer, including straight N, P, K fertilizer and compound fertilizerMt 国家统计局[33]
National Bureau of Statistics of China[33]农药生产
Pesticide production农药用量
Amount of pesticideMt 国家统计局[33]
National Bureau of Statistics of China[33]农膜生产
Film production农膜用量
Amount of filmMt 国家统计局[33]
National Bureau of Statistics of China[33]食物加工
Food processing活动数据不确定。将不同文献的该环节排放量按Crippa等[9]的排放增长比例推算至2015年, 再求取平均排放量和标准差
No specific activity data. Synthesize all literatures reported values for food processing, then extrapolate the values to the base year (2015) according to the rate of emission change provided by Crippa et al.[9], and finally calculate the average emission and standard deviation/ 见表5
See the table 5食物包装
Food packaging活动数据不确定, 直接采用Crippa等[9]包含包装间接碳排放的结果, 排放年为2015年
No specific activity data. Use the value in 2015 reported by Crippa et al.[9] (including the indirect packaging emission)/ Crippa等[9]
Refer to Crippa et al.[9]运输和仓储
Food transport and storage活动数据不确定。将不同文献的该环节排放量按Crippa等[9]的排放增长比例推算至2015年, 再求取平均排放量和标准差
No specific activity data. Synthesize all literatures reported values for food consumption, then extrapolate the values to the base year (2015) according to the rate of emission change provided by Crippa et al.[9], and finally calculate the average emission and standard deviation/ 见表5
See the table 5批发和零售
Food wholesale and retail活动数据不确定。将不同文献的该环节排放量按Crippa等[9]的排放增长比例推算至2015年, 再求取平均排放量和标准差
No specific activity data. Synthesize all literatures reported values for food wholesale and retail, then extrapolate the values to the base year (2015) according to the rate of emission change provided by Crippa et al.[9], and finally calculate the average emission and standard deviation/ 见表5
See the table 5食物消费
Food consumption活动数据不确定。将不同文献的该环节排放量按Crippa等[9]的排放增长比例推算至2015年, 再求取平均排放量和标准差
No specific activity data. Synthesize all literatures reported values for food transport and storage, then extrapolate the values to the base year (2015) according to the rate of emission change provided by Crippa et al.[9], and finally calculate the average emission and standard deviation/ 见表5
See the table 5森林
Forest森林面积
Forest areaMhm2 国家统计局[33]
National Bureau of Statistics of China[33]耕地
Cropland耕地面积
Cropland areaMhm2 中国统计年鉴[34]
China Statistic Yearbook[34]草地
Grassland草地面积
Grassland areaMhm2 国家统计局[33]
National Bureau of Statistics of China[33] 下载: 导出CSV
表 2 农业活动温室气体核算方法及其参数变异范围
Table 2. Accounting methods for agricultural activities greenhouse gas emission and their re-calculated emission factors
代码
Code1水稻种植
Rice cultivation2化肥施用
2 Synthetic fertilizer application3有机肥施用
3 Organic fertilizer application4秸秆还田
4 Crop residue application方法
Method参数范围
Range of the parameter
[t(CO2eq)∙hm−2]方法
Method参数范围
Range of the parameter
[t(CO2eq)∙t−1(N)]方法
Method参数范围
Range of the parameter
[t(CO2eq)∙t−1(N)]方法
Method参数范围
Range of the parameter
[t(CO2eq)∙t−1(N)]a FAO-IPCC TIER1[22] 4.8~6.4 FAO-IPCC TIER1[22] 4.3~5.5 FAO-IPCC TIER1[22] 5.9 FAO-IPCC TIER1[22] 8.0~15.6 b UNFCCC-省级温室气体清单[30]
UNFCCC- Guide for Provincial GHG Inventory (GPGI)[30]5.3~8.2 UNFCCC-省级温室气体清单[30]
UNFCCC- GPGI[30]5.5 UNFCCC-省级温室气体清单[30]
UNFCCC- GPGI[30]11.7 UNFCCC-省级温室气体清单[30]
UNFCCC- GPGI[30]3.2~6.2 c EDGAR-GAINS[24] 13.1 区分作物品种和背景/施氮排放[35]
Based on the parameters by crops and by background emissions[35]4.6~4.8 PKU-N2O高分辨率排放清单[20]
PKU-N2O high resolution inventory[20]3.1~4.3 PKU-N2O高分辨率排放清单[20]
PKU-N2O high resolution inventory[20]1.8~4.7 d 王明星等[37],
分区排放参数
Regional emission parameters from Wang et al.[37]8.0~11.9 PKU-N2O高分辨率排放清单[20]
PKU-N2O high resolution inventory[20]4.5~4.6 e 王效科等[38], DNDC模型模拟
Wang et al.[38], based on DNDC model9.5~9.6 f 其他方法
Others5.5 代码
Code5秸秆燃烧
5 Burning crop residue6粪尿管理
6 Manure management7肠胃排放
7 Enteric fermentation方法
Method参数范围
Range of the parameter
[t(CO2eq)∙t−1(DM)]方法
Method参数范围
Range of the parameter
[t(CO2eq)∙LU−1)方法
Method参数范围
Range of the parameter
[t(CO2eq)∙LU−1)a FAO-IPCC TIER1[22] 0.11 FAO-IPCC TIER1[22] 0.2~0.3 FAO-IPCC TIER1[22] 0.6~0.9 b UNFCCC-省级温室气体清单[30]
UNFCCC- GPGI[30]0.05~0.09 EDGAR-CAPRI[24] 0.2 UNFCCC-省级温室气体清单[30]
UNFCCC- GPGI[30]1.0~1.2 c EDGAR[24] 0.06~0.09 UNFCCC-省级温室气体清单[30]
UNFCCC- GPGI[30]0.5~0.7 胡向东等 [39], 简化的FAO-IPCC TIER1方法
Hu et al.[39], simplified method based on FAO-IPCC TIER10.9~1.1 d 其他方法
Others0.11~0.15 胡向东等[39], 简化的FAO-IPCC TIER1方法
Hu et al.[39], simplified method based on FAO-IPCC TIER10.6~0.7 表2的编号与图3相对应, 以便进一步比较同一环节下不同核算方法的排放参数差异。The codes in the table 2 are consistent with those in the figure 3, which enable us to compare the differences of emission parameters in different methods.
下载: 导出CSV
表 3 农业生产中能源消耗的温室气体核算方法及其参数范围
Table 3. Accounting methods for agricultural energy use greehouse gas (GHG) emission and their re-calculated emission factors
代码
Code8农林牧渔业化石燃烧
8 Fossil fuel combustion in FFAF9农林牧渔业电力消耗
9 Electricity consumption in FFAF10农用机械柴油燃烧
10 Agricultural machinery diesel oil combustion11灌溉电力消耗
11 Irrigation electricity consumption方法
Method参数范围
Range of the parameter
[t(CO2eq)∙t−1(ce)]方法
Method参数范围
Range of the parameter
[t(CO2eq)∙t−1(ce)]方法
Method参数范围
Range of the parameter
[t(CO2eq)∙t−1(ce)]方法
Method参数范围
Range of the parameter
[t(CO2eq)∙t−1(ce)]a FAO-IPCC TIER1[22] 1.8~3.3 FAO-IPCC TIER1[22] 6.2~6.7 IPCC TIER1[40] 2.1~2.8 Dubey等[43]提供参数
Parameters provided by Dubey et al.[43]0.07~0.08 b UNFCCC-省级温室气体清单[30]
UNFCCC- Guide for Provincial GHG Inventory (GPGI)[30]2.2~3.1 UNFCCC-省级温室气体清单[30]
UNFCCC- GPGI[30]7.8 West et al.[42]提供参数
Parameters provided by West et al.[42]0.5 West et al.[42]提供参数
Parameters provided by West et al.[42]1.0 c 环境投入-产出模型-生命周期法 Environment input-output model-life cycle approch (EIO-LCA)[41] 4.5 BP China提供参数[51]
Parameters provided by BP China[51]2.4 BP China提供参数[51]
Parameters provided by BP China[51]1.7 代码
Code12化肥生产
12 Synthetic fertilizer production13农药生产
13 Pesticide production14农膜生产
14 Film production方法
Method参数范围
Range of the parameter
[t(CO2eq)∙t−1]方法
Method参数范围
Range of the parameter
[t(CO2eq)∙t−1]方法
Method参数范围
Range of the parameter
[t(CO2eq)∙t−1]a West et al.[42]提供参数
Parameters provided by West et al.[42]3.2~3.3 West et al.[42]提供参数
Parameters provided by West et al.[42]13.8~18.3 南京农业大学提供参数
Parameters provided by Nanjing Agricultural University18.5~24.0 b EIO-LCA[46] 2.2 EIO-LCA[46] 24.7 EIO-LCA[46] 4.3 c Zhang等[52]和IFA提供参数[53]
Parameters provided by Zhang et al.[52] and IFA[53]3.0 国家发展和改革委员会提供参数[54]
Parameters provided by the National Development and Reform Commission of China[54]22.8 d 齐晔[44]提供参数
Parameters provided
by Qi[44]5.2 e 逯非等[45]和Dubey et al.[43]提供参数
Parameters provided by Lu et al.[45] and Dubey et al.[43]4.9 表3的编号与图4相对应, 以便进一步比较同一环节下不同核算方法的排放参数差异。FFAF: farming, forestry, animal husbandy and fishery. The codes in the table 3 are consistent with those in the figure 4, which enables us to compare the differences of emission parameters in different methods.
下载: 导出CSV
表 4 不同土地利用类型碳汇核算方法及其参数范围
Table 4. Accounting methods greenhouse gas (GHG) removal of land use, land use change and forests (LULUCF) and their re-calculated removal factors
代码 Code 15森林
15 Forest16耕地
16 Cropland17草地
17 Grassland方法
Method参数范围
Range of the parameter
[t(CO2eq)∙hm−2]方法
Method参数范围
Range of the parameter
[t(CO2eq)∙hm−2]方法
Method参数范围
Range of the parameter
[t(CO2eq)∙hm−2]a FAO-IPCC TIER3[22] −3.4 过程模型
Process based model−0.5~−0.7 UNFCCC-IPCC TIER2[40] −0.2 b UNFCCC-IPCC TIER2[40] −2.1 实测数据推算
Estimation based on measured data−0.2~−0.3 空间明晰的估算方法[55]
Spatially explicit accounting method[55]−0.2 c 空间明晰的估算方法[55]
Spatially explicit accounting method[55]−1.6 文献数据推算
Estimation based on literature data−0.5~−0.6 过程模型估算
Process based model−0.2~−0.3 d 实测数据推算
Estimation based on measured data−1.7~−4.7 空间明晰的估算方法[55]
Spatially explicit accounting method[55]−0.3 实测数据与遥感反演结合
Measure-satellite combined method0.04~−0.14 e 实测数据与遥感反演结合
Measure-satellite combined method−1.0 表4的编号与图5相对应, 以便进一步比较同一环节下不同核算方法的排放参数差异。The codes in the table 4 are consistent with thoes in the figure 5, which enables us to compare the differences of emission parameters in different methods.
下载: 导出CSV
表 5 食物供应部门的年均温室气体排放
Table 5. Annual greenhouse gas (GHG) emission induced by postharvest food supply activities
文献来源
Referred literature排放环节
Emission segment数值
Value
[Mt(CO2eq)∙a−1]说明
RemarkCrippa, et al[9]
(2015)*加工
Processing153 EDGAR各部门排放×食物供应链各环节相关比例, 其中包装环节还包括包装物质生产排放
EDGAR reported emission by sectors×the proportion of food related emission in each reported sectors. The packaging emission in this study includes the embodied emission of packaging material production.包装
Packaging440 运输和仓储
Transport and storage78 批发和零售
Wholesale and retail49 消费
Consumption119 CEADs database[25]
(2016—2018)*加工
Processing57 仅包含食物加工的终端能源消费
Only including the emission from energy consumption in food processing sectorLi , et al[17]
(2010)*加工
Processing121 加工按终端能源消费计算; 运输仓储按环境投入-产出模型-生命周期法(EIO-LCA)方法计算; 食物消费按建筑面积×单位建筑耗能计算
The emission of food processing only included its energy consumption induced emission. The emission of food transport and storage was calculated by EIO-LCA method. And the emission of food consumption was calculated as the floor area × energy consumption per unit area.运输和仓储
Transport and storage36 消费
Consumption78 Vermeulen, et al[57]
(2007)*加工
Processing48 加工、批发和零售环节按终端能源消费计算, 包装、运输和仓储、消费等按EIO-LCA方法计算(投入产出表包含26个部门)
The emission of food processing, wholesale and retail were calculated based on their terminal energy consumption. The emission of food packaging, transport and storage and consumption were calculated by environment input-output model-life cycle approch (EIO-LCA) method (input-output table included 26 sectors).包装
Packaging53 运输和仓储
Transport and storage46 批发和零售
Wholesale and retail18 消费
Consumption81 Song, et al[58]**
(2012)*加工
Processing187 投入-产出(IO)-生命周期(IO-LCA)方法, 包括各环节直接和间接能源利用(投入产出表含12个部门)
Calculation was based on input-output model-life cycle approch (IO-LCA) method which included both direct and indirect energy consumption (input-output table included 12 sectors).包装
Packaging39 运输和仓储
Transport and storage33 批发和零售
Wholesale and retail17 消费
Consumption39 *括号中年份为各文献中温室气体排放的年份; **温室气体排放按能源用量×油品排放因子计算。* Values in brackets are the reported year of the emissions. ** The GHG emission in this literature was further estimated as energy consumption × emission factors (based on the average emission factor of oil products).
下载: 导出CSV
表 6 中国食物系统各环节排放(或吸收)参数及其变异系数
Table 6. Emission (or sequestration) factors and their coefficients of variations of the Chinese food system
排放或吸收环节
Emission source or sink参数平均值
Average value of parameter参数单位
Unit of parameter参数变异系数
Coefficient of variable of parameter水稻种植
Rice cultivation7.27 t(CO2eq)∙hm−2 0.29 化肥施用
Synthetic fertilizer application4.79 t(CO2eq)∙t−1(N) 0.09 粪尿施用
Manure application6.24 t(CO2eq)∙t−1(N) 0.60 粪尿管理
Manure management0.49 t(CO2eq)∙LU−1 0.35 动物肠道排放
Enteric fermentation0.96 t(CO2eq)∙LU−1 0.18 秸秆燃烧
Burning crop residue0.09 t(CO2eq)∙t−1(DM) 0.30 秸秆还田
Crop residue application5.68 t(CO2eq)∙t−1(N) 0.73 农业化石能源消耗
Agricultural fossil fuel consumption2.60 t(CO2eq)∙t−1(ce) 0.29 农业电力消耗
Agricultural electricity consumption6.70 t(CO2eq)∙t−1(ce) 0.11 化肥生产
Synthetic fertilizer production3.53 t(CO2eq)∙t−1 0.28 农药生产
Pesticide production22.12 t(CO2eq)∙t−1 0.36 农膜生产
Film production17.95 t(CO2eq)∙t−1 0.39 食物加工*
Food processing— — 0.44 食物包装**
Food packaging— — — 运输和仓储*
Food transport and storage— — 0.33 批发和零售*
Food wholesale and retail— — 0.50 食物消费*
Food consumption— — 0.36 森林
Forest−2.86 t(CO2eq)∙hm−2 0.41 耕地
Cropland−0.49 t(CO2eq)∙hm−2 0.32 草地
Grassland−0.16 t(CO2eq)∙hm−2 0.70 *相关环节难以确定活动数据, 因此假设同一环节不同研究中的活动数据一致, 其参数变异系数等同于排放量变异系数; **基于Crippa et al. (2021)单篇文章的数据, 不能计算排放参数及其变异系数。* The activity data is unavailable in these emission segments, hence the coefficients of emission parameters are the same as that of total emission amount, under the assumption that the activity data is the same in different studies for the same emission segment. ** This value is based on a single study by Crippa et al. (2021), so the emission parameter and its coefficient of variable is not available.
下载: 导出CSV
-
[1] PROGRAMME U N E. Emissions Gap Report 2020[M]. Nairobi: United Nations, 2021 [2] United Nations. Paris Agreement[EB/OL]. [2022-01-09]. https://unfccc.int/sites/default/files/chinese_paris_agreement.pdf. [3] HÖHNE N, GIDDEN M J, DEN ELZEN M, et al. Wave of net zero emission targets opens window to meeting the Paris Agreement[J]. Nature Climate Change, 2021, 11(10): 820−822 doi: 10.1038/s41558-021-01142-2 [4] Net Zero Tracker. Net Zero Tracker Database[EB/OL]. [2021-01-09]. https://zerotracker.net/ [5] 习近平. 在第七十五届联合国大会一般性辩论上发表的讲话[EB/OL]. [2022-01-09]. http://www.gov.cn/xinwen/2020-09/22/content_5546168.htmXI J P. The speech at the general debate of the 75th Session of the United Nation General Assembly[EB/OL]. [2022-01-09]. http://www.gov.cn/xinwen/2020-09/22/content_5546168.htm. [6] 新华社. 中美关于在21世纪20年代强化气候行动的格拉斯哥联合宣言[EB/OL]. [2022-01-09]. http://www.gov.cn/xinwen/2021-11/11/content_5650318.htmXinhua News Agency. China-U. S. Joint Glasgow Declaration on enhancing climate action in the 2020s[EB/OL]. [2022-01-09]. http://www.gov.cn/xinwen/2021-11/11/content_5650318.htm [7] NGUYEN H. Sustainable food systems: concept and framework[M/OL]. Rome: FAO, 2018. [2022-01-09]. https://www.fao.org/policy-support/tools-and-publications/resources-details/en/c/1160811/ [8] Global Carbon Project. Global budgets for carbon dioxide, methane and nitrous oxide[EB/OL]. [2022-01-09]. https://www.globalcarbonproject.org/index.htm [9] CRIPPA M, SOLAZZO E, GUIZZARDI D, et al. Food systems are responsible for a third of global anthropogenic GHG emissions[J]. Nature Food, 2021, 2(3): 198−209 doi: 10.1038/s43016-021-00225-9 [10] CLARK M A, DOMINGO N G G, COLGAN K, et al. Global food system emissions could preclude achieving the 1.5° and 2 ℃ climate change targets[J]. Science, 2020, 370(6517): 705−708 doi: 10.1126/science.aba7357 [11] ROE S, STRECK C, OBERSTEINER M, et al. Contribution of the land sector to a 1.5 ℃ world[J]. Nature Climate Change, 2019, 9(11): 817−828 doi: 10.1038/s41558-019-0591-9 [12] 农业农村部. 中国农业统计资料2017[M]. 北京: 中国农业出版社, 2018Ministry of Agriculture and Rural Affairs of China. China Agriculture Statistical Report[M]. Beijing: China Agriculture Press, 2018 [13] Statista. Supply of daily per capita calories in China, Germany, UK, and the U.S. from 1961 to 2013[EB/OL]. [2022-01-09]. https://www.statista.com/statistics/1094250/daily-per-capita-calories-supply/. [14] 中国营养学会. 中国居民膳食指南科学研究报告2021[R/OL]. [2022-01-09]. http://dg.cnsoc.org/upload/affix/20210301174345895.pdf.Chinese Nutrition Society. Scientific Research Report on Dietary Guidelines for Chinese Residents 2021[R/OL]. [2022-01-09]. http://dg.cnsoc.org/upload/affix/20210301174345895.pdf. [15] HU Y C, CUI S H, BAI X M, et al. Transboundary environmental footprints of the urban food supply chain and mitigation strategies[J]. Environmental Science & Technology, 2020, 54(17): 10460−10471 [16] XUE L, LIU X, LU S, et al. China’s food loss and waste embodies increasing environmental impacts[J]. Nature Food, 2021, 2(7): 519−528 doi: 10.1038/s43016-021-00317-6 [17] LI H M, WU T, WANG X, et al. The greenhouse gas footprint of China’s food system: an analysis of recent trends and future scenarios[J]. Journal of Industrial Ecology, 2016, 20(4): 803−817 doi: 10.1111/jiec.12323 [18] 金书秦, 林煜, 牛坤玉. 以低碳带动农业绿色转型: 中国农业碳排放特征及其减排路径[J]. 改革, 2021(5): 29−37JIN S Q, LIN Y, NIU K Y. Driving green transformation of agriculture with low carbon: characteristics of agricultural carbon emissions and its emission reduction path in China[J]. Reform, 2021(5): 29−37 [19] ROSENZWEIG C, MBOW C, BARIONI L G, et al. Climate change responses benefit from a global food system approach[J]. Nature Food, 2020, 1(2): 94−97 doi: 10.1038/s43016-020-0031-z [20] ZHOU F, SHANG Z Y, CIAIS P, et al. A new high-resolution N2O emission inventory for China in 2008[J]. Environmental Science & Technology, 2014, 48(15): 8538−8547 [21] WANG Z, ZHANG X Y, LIU L, et al. Estimates of methane emissions from Chinese rice fields using the DNDC model[J]. Agricultural and Forest Meteorology, 2021, 303: 108368 doi: 10.1016/j.agrformet.2021.108368 [22] Food and Agriculture Organization of the United Nations. Food and agricultural organization statistical databases[EB/OL]. [2021-01-09]. https://www.fao.org/faostat/en/#data [23] United Nations Framework Convention on Climate Change. Greenhouse gas inventory data[EB/OL]. [2021-01-09]. https://di.unfccc.int/flex_non_annex1 [24] European Commission. Emissions database for global atmospheric research (EDGAR v6.0)[EB/OL]. [2021-01-09]. https://edgar.jrc.ec.europa.eu/emissions_data_and_maps. [25] 科学技术部, 国家自然科学基金, 中国21世纪议程管理中心, 等. 中国碳核算数据库[EB/OL]. [2022-01-09]. https://www. ceads. net. cn/Ministry of Sciences and Technology of China, National Natural Sciences Foundation of China, the Administrative Center for China’s Agenda 21, et al. China emission accounts and datasets[EB/OL]. [2022-01-09]. https://www.ceads.net.cn [26] Intergovernmental Panel on Climate Change. IPCC Fifth Assessment Report, Climate Change 2014[R]. Geneva: Intergovernmental Panel on Climate Change, 2014 [27] 牛新胜, 巨晓棠. 我国有机肥料资源及利用[J]. 植物营养与肥料学报, 2017, 23(6): 1462−1479 doi: 10.11674/zwyf.17430NIU X S, JU X T. Organic fertilizer resources and utilization in China[J]. Journal of Plant Nutrition and Fertilizer, 2017, 23(6): 1462−1479 doi: 10.11674/zwyf.17430 [28] MA L, MA W Q, VELTHOF G L, et al. Modeling nutrient flows in the food chain of China[J]. Journal of Environmental Quality, 2010, 39(4): 1279−1289 doi: 10.2134/jeq2009.0403 [29] Eurostat. Statistics explained glossary: livestock unit (LSU) [EB/OL]. [2022-01-09]. https://ec.europa.eu/eurostat/statistics-explained/index.php?title=Glossary:Livestock_unit_(LSU) [30] 国家发展和改革委员会应对气候变化司. 省级温室气体清单编制指南(试行) [EB/OL]. [2022-01-09]. http://cn.edcmee.org.cn/ptfb/zcbz/202106/P020210601177040314696.pdfDepartment of Climate Change, National Development and Reform Commission of China. Guideline for provincial greenhouse gas emission inventories (trial) [EB/OL]. [2022-01-09]. http://cn.edcmee.org.cn/ptfb/zcbz/202106/P020210601177040314696.pdf [31] 刘晓永. 中国农业生产中的养分平衡与需求研究[D]. 北京: 中国农业科学院, 2018LIU X Y. Study on nutrients balance and requirement in agricultural production in China[D]. Beijing: Chinese Academy of Agricultural Sciences, 2018 [32] 国家统计局能源统计司. 中国能源统计年鉴 [M]. 北京: 中国统计出版社, 2006—2016Department of Energy Statistics, National Bureau of Statistic of China. China Energy Statistical Yearbook[M]. Beijing: China Statistics Press, 2006—2016 [33] 国家统计局. 国家数据[EB/OL]. [2022-01-09]. https://data.stats.gov.cn/easyquery.htm?cn=C01National Bureau of Statistic of China. National data[EB/OL]. [2022-01-09]. https://data.stats.gov.cn/easyquery.htm?cn=C01 [34] 国家统计局. 中国统计年鉴[M]. 北京: 中国统计出版社, 2006—2016National Bureau of Statistic of China. China Statistical Yearbook[M]. Beijing: China Statistics Press, 2006−2016 [35] 闵继胜, 胡浩. 中国农业生产温室气体排放量的测算[J]. 中国人口·资源与环境, 2012, 22(7): 21−27 doi: 10.3969/j.issn.1002-2104.2012.07.004MIN J S, HU H. Calculation of greenhouse gases emission from agricultural production in China[J]. China Population, Resources and Environment, 2012, 22(7): 21−27 doi: 10.3969/j.issn.1002-2104.2012.07.004 [36] HUANG Y, SASS R L, FISHER F M. A semi-empirical model of methane emission from flooded rice paddy soils[J]. Global Change Biology, 1998, 4(3): 247−268 doi: 10.1046/j.1365-2486.1998.00129.x [37] 王明星, 李晶, 郑循华. 稻田甲烷排放及产生、转化、输送机理[J]. 大气科学, 1998, 22(4): 600–612WANG M X, LI J, ZHENG X H. Methane emission and mechanisms of methane production, oxidation, transportation in the rice fields[J]. Scientia Atmospherica Sinica, 1998, 22(4): 600–612 [38] 王效科, 李长生, 欧阳志云. 温室气体排放与中国粮食生产[J]. 生态环境, 2003, 12(4): 379–383WANG X K, LI C S, OUYANG Z Y. Greenhouse gases emission and crop production[J]. Ecology and Environmental Sciences, 2003, 12(4): 379–383 [39] 胡向东, 王济民. 中国畜禽温室气体排放量估算[J]. 农业工程学报, 2010, 26(10): 247–252HU X D, WANG J M. Estimation of livestock greenhouse gases discharge in China[J]. Transactions of the Chinese Society of Agricultural Engineering, 2010, 26(10): 247–252 [40] International Panel on Climate Change. 2006 IPCC Guidelines for National Greenhouse Gas Inventories[M/OL]. Hayama: Institute for Global Environmental Strategies, [2022-01-09]. https://www.ipcc-nggip.iges.or.jp/public/2006gl/vol4.html [41] WANG X C, KLEMEŠ J J, WANG Y T, et al. Water-Energy-Carbon emissions nexus analysis of China: an environmental input-output model-based approach[J]. Applied Energy, 2020, 261: 114431 doi: 10.1016/j.apenergy.2019.114431 [42] WEST T O, MARLAND G. A synthesis of carbon sequestration, carbon emissions, and net carbon flux in agriculture: comparing tillage practices in the United States[J]. Agriculture, Ecosystems & Environment, 2002, 91(1/2/3): 217−232 [43] DUBEY A, LAL R. Carbon footprint and sustainability of agricultural production systems in Punjab, India, and Ohio, USA[J]. Journal of Crop Improvement, 2009, 23(4): 332−350 doi: 10.1080/15427520902969906 [44] 齐晔. 2010中国低碳发展报告[M]. 北京: 科学出版社, 2011QI Y. Annual Review of Low-Carbon Development in China 2010[M]. Beijing: Science Press, 2011 [45] 逯非, 王效科, 韩冰, 等. 中国农田施用化学氮肥的固碳潜力及其有效性评价[J]. 应用生态学报, 2008, 19(10): 2239−2250 doi: 10.13287/j.1001-9332.2008.0381LU F, WANG X K, HAN B, et al. Assessment on the availability of nitrogen fertilization in improving carbon sequestration potential of China’s cropland soil[J]. Chinese Journal of Applied Ecology, 2008, 19(10): 2239−2250 doi: 10.13287/j.1001-9332.2008.0381 [46] LIN J Y, HU Y C, CUI S H, et al. Carbon footprints of food production in China (1979−2009)[J]. Journal of Clean Production, 2014, 90: 97−103 [47] 生态环境部. 中华人民共和国气候变化第三次国家信息通报[R]. 北京: 生态环境部, (2018-12). https://unfccc.int/sites/default/files/resource/China_NC3_Chinese_0.pdfMinistry of Ecology and Environment of China. The People’s Republic of China Third National Communication on Climate Change[R]. Beijing: Ministry of Ecology and Environment of China. (2018-12). https://unfccc.int/sites/default/files/resource/China_NC3_Chinese_0.pdf [48] FANG J Y, WANG Z M. Forest biomass estimation at regional and global levels, with special reference to China’s forest biomass[J]. Ecological Research, 2001, 16(3): 587−592 doi: 10.1046/j.1440-1703.2001.00419.x [49] 方精云, 郭兆迪, 朴世龙, 等. 1981—2000年中国陆地植被碳汇的估算[J]. 中国科学(D辑: 地球科学), 2007, 37(6): 804−812FANG J Y, GUO Z D, PIAO S L, et al. Terrestrial vegetation carbon sinks in China, 1981−2000[J]. Science in China (Series D: Earth Sciences), 2007, 37(6): 804−812 [50] 郭兆迪, 胡会峰, 李品, 等. 1977—2008年中国森林生物量碳汇的时空变化[J]. 中国科学: 生命科学, 2013, 43(5): 421−431 doi: 10.1360/zc2013-43-5-421GUO Z D, HU H F, LI P, et al. Spatio-temporal changes in biomass carbon sinks in China’s forests during 1977−2008[J]. Scientia Sinica (Vitae), 2013, 43(5): 421−431 doi: 10.1360/zc2013-43-5-421 [51] BP China. HSE charting tool — greenhouse gas emissions data[EB/OL]. [2022-01-09]. https://www.bp.com/en/global/corporate/sustainability/getting-to-net-zero/ghg-emissions.html.html#greenhouse-gas-emissions-data [52] ZHANG W F, DOU Z X, HE P, et al. New technologies reduce greenhouse gas emissions from nitrogenous fertilizer in China[J]. Proceeding of the National Academy of Sciences of the United States of America, 2013, 110(21): 8375−8380 doi: 10.1073/pnas.1210447110 [53] International Fertilizer Industry Association. Fertilizers, Climate Change and Enhancing Agricultural Productivity[M]. Paris: International Fertilizer Industry Association, 2009 [54] 国家发展和改革委员会. 解振华副主任就节能减排和应对气候变化问题答记者问[EB/OL]. (2010-03-11)[2022-01-09]. https://www.ndrc.gov.cn/xxgk/jd/jd/201003/t20100311_1183092.html?code=&state=123National Development and Reform Commission of China. Deputy director Xie Zhenhua answered reporters’ questions on energy conservation and emission reduction[EB/OL]. (2010-03-11)[2022-01-09]. https://www.ndrc.gov.cn/xxgk/jd/jd/201003/t20100311_1183092.html?code=&state=123 [55] LAI L, HUANG X J, YANG H, et al. Carbon emissions from land-use change and management in China between 1990 and 2010[J]. Science Advances, 2016, 2(11): e1601063 doi: 10.1126/sciadv.1601063 [56] ZHAO Y C, WANG M Y, HU S J, et al. Economics- and policy-driven organic carbon input enhancement dominates soil organic carbon accumulation in Chinese croplands[J]. Proceedings of the National Academy of Sciences of the United States of America, 2018, 115(16): 4045−4050 doi: 10.1073/pnas.1700292114 [57] VERMEULEN S J, CAMPBELL B M, INGRAM J S I. Climate change and food systems[J]. Annual Review of Environment and Resources, 2012, 37: 195−222 doi: 10.1146/annurev-environ-020411-130608 [58] SONG F, REARDON T, TIAN X, et al. The energy implication of China’s food system transformation[J]. Applied Energy, 2019, 240: 617−629 doi: 10.1016/j.apenergy.2019.02.069 -

 下载:
下载:


 点击查看大图

计量
- 文章访问数: 223
- HTML全文浏览量: 78
- PDF下载量: 84
- 被引次数: 0
