

Spatiotemporal variation of dry-wet climate during wheat growing seasons from 1961 to 2020 in China
-
摘要: 基于1961—2020年全国524个气象台站逐日数据, 以有效降水量、作物需水量和水分盈缺量(有效降水量与作物需水量的差值)为干湿指标, 从年际和年代际尺度(P1: 1961—1990年, P2: 1991—2020年)分析了全国小麦主产区(春麦区: 东北、蒙北、西北、北疆; 冬麦区: 北部、华北、西南、长江中下游、华南、新疆)生长季内气候干湿状况时空分布和演变趋势, 并利用SPEI指数评估了小麦种植区的干旱风险。结果表明: 1) 1961—2020年华南、长江中下游、西南冬麦区小麦生长季降水量大于作物需水量, 其他麦区生长季内水分亏缺, 新疆冬麦区(443 mm)和北疆春麦区(495 mm)为缺水量高值区。2)近60年全国小麦生长季干旱频率为35.2%~59.6%, 四大春麦区、长江中下游冬麦区干旱发生频率较高, 均大于50.0%。3) 1961—2020年全国小麦生长季有效降水量波动增加, 作物需水量呈先降后升的趋势, 华北、北部冬麦区表现为气候暖干化, 其他麦区均呈气候暖湿化趋势。小麦种植区暖湿化的气候机制存在地域间差异, 春麦区(东北、蒙北、北疆)和新疆冬麦区为有效降水量增加且作物需水量减少; 而长江中下游冬麦区生长季内有效降水量和作物需水量均为增加的趋势, 但降水量增加幅度大于作物需水量。本文在全国尺度上对全国小麦生长季干湿状况时空变化进行了探究, 对农业正确应对气候变化具有重要的参考意义。Abstract: As the intensity of climate change increases, global warming continues to affect the hydrological cycle and precipitation characteristics. Changes occur at various locations owing to interregional differences in the intensity and distribution of precipitation and evapotranspiration. To determine the dry-wet climate distribution during the wheat growing season in wheat planting regions of China and the changes that have occurred over the past 60 years, we analyzed the temporal and spatial variation characteristics of China’s dry-wet climate over the inter-annual and inter-decadal periods from 1961 to 2020 (P1: 1961–1990; P2: 1991–2020). To explore how dry-wet climate changes, a series of dry-wet indices, such as effective precipitation, crop water demand, and water surplus and deficiency (difference between effective precipitation and crop water demand) were used. A Standardized Precipitation Evapotranspiration Index was used in this study for drought risk assessment in cropping regions. In this study, 524 meteorological stations with 60-year data records of China’s wheat planting regions were selected and divided into ten wheat planting regions. These regions are as follows. Spring wheat: Northeast China Spring Wheat Region, NES; Northern Inner Mongolia Spring Wheat Region, NIMS; Northwest China Spring Wheat Region, NWS; Northern Xinjiang Spring Wheat Region, NXJS. Winter wheat: Northern China Winter Wheat Region, NW; North China Plain Winter Wheat Region, NCW; Middle-Lower Reach of Yangtze River Winter Wheat Region, MLYRW; Southwest China Winter Wheat Region, SWS; South China Winter Wheat Region, SCW; Xinjiang Winter Wheat Region, XJW. The results showed that precipitation exceeded the crop water requirements during the wheat growing season in the SCW, SWW, and MLYRW regions over the past 60 years. Other regions experienced water deficits during wheat the growing season, with XJW (443 mm) and NXJS (495 mm) exhibiting the highest water deficit values. Estimates of effective precipitation, crop water demand, water surplus and deficit for the national wheat growing season ranged from 2.0–1320.0, 156.0–832.0, and 828.0–1081.0 mm, respectively. Both values showed a clear zonal distribution from southeast to northwest. In this study, drought frequency was calculated as 35.2%–59.6% for the national wheat growing season; it was more than 50.0% in the spring wheat regions and MLYRW regions. The frequencies of mild, moderate, and severe droughts during the wheat growing seasons were 18.7%–46.0%, 0–21.5%, and 1.7%–11.6%, respectively. The analysis showed that during the wheat growing season, effective precipitation volatility increased from 1961 to 2020, and crop water demand decreased and then increased again. The NCW and NW regions exhibited a drying climate, while the other regions showed a wetting climate trend. Further analysis revealed interregional differences in the climatic mechanisms of the wet-dry crisis in wheat planting regions. In NES, NIMS, NXJS, and XJW regions, effective precipitation increased and crop water demand decreased. Meanwhile, in MLYRW, effective precipitation and crop water demand increased, but the increase in precipitation was higher than that in crop water demand. Interdecadal variability in effective precipitation indicated a modest rising tendency; crop water demand declined in the P1 period and grew in the P2 period, whereas water surplus and deficit increased in the P1 period and decreased in the P2 period, respectively. This study makes an essential contribution to the research on the proper response of agriculture to climate change by showing the temporal and spatial variations of the dry-wet climate in China’s wheat regions.
-
Key words:
- Wheat planting region /
- Climate change /
- Dry-wet climate /
- Water surplus and deficiency /
- Drought
-

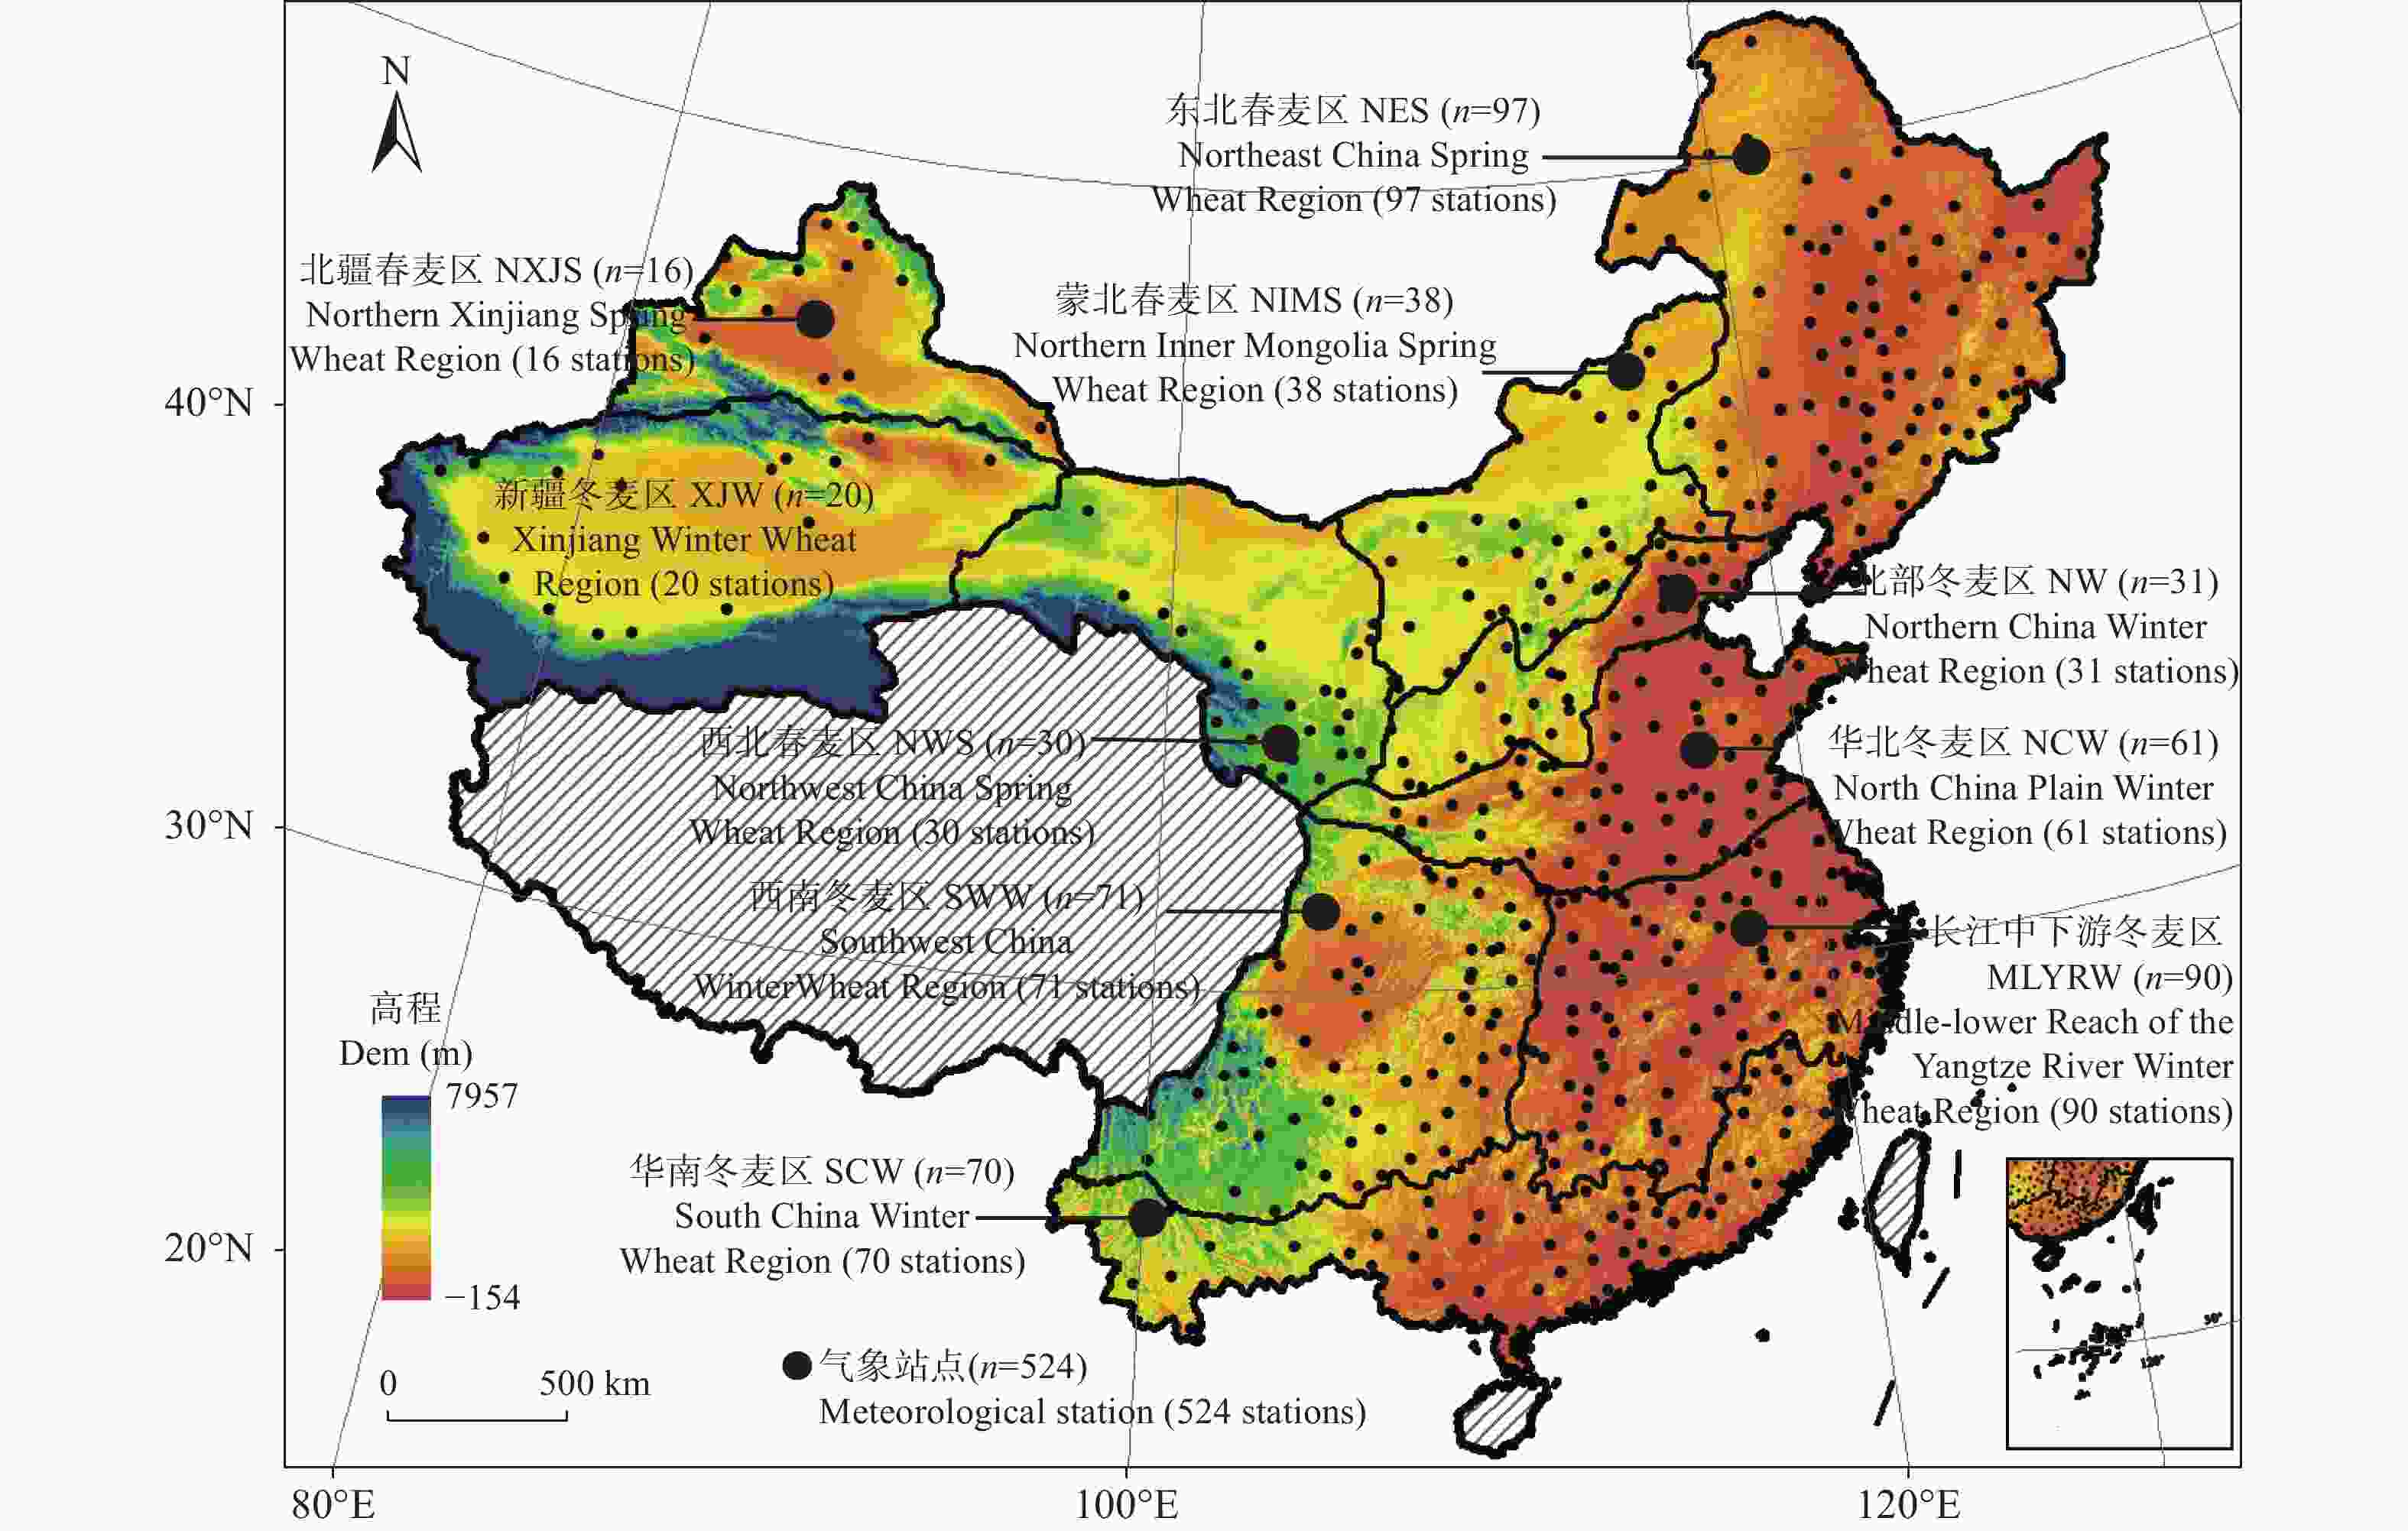
图 1 中国小麦种植区划及524个气象站点分布[图中斜杠区域为无数据区, 此文审图号:GS(2019)1822]
Figure 1. Distribution of wheat planting regions and 524 meteorological stations in China [the areas with black slashes are no data ares, the Map Approval Number of figures is GS(2019)1822]
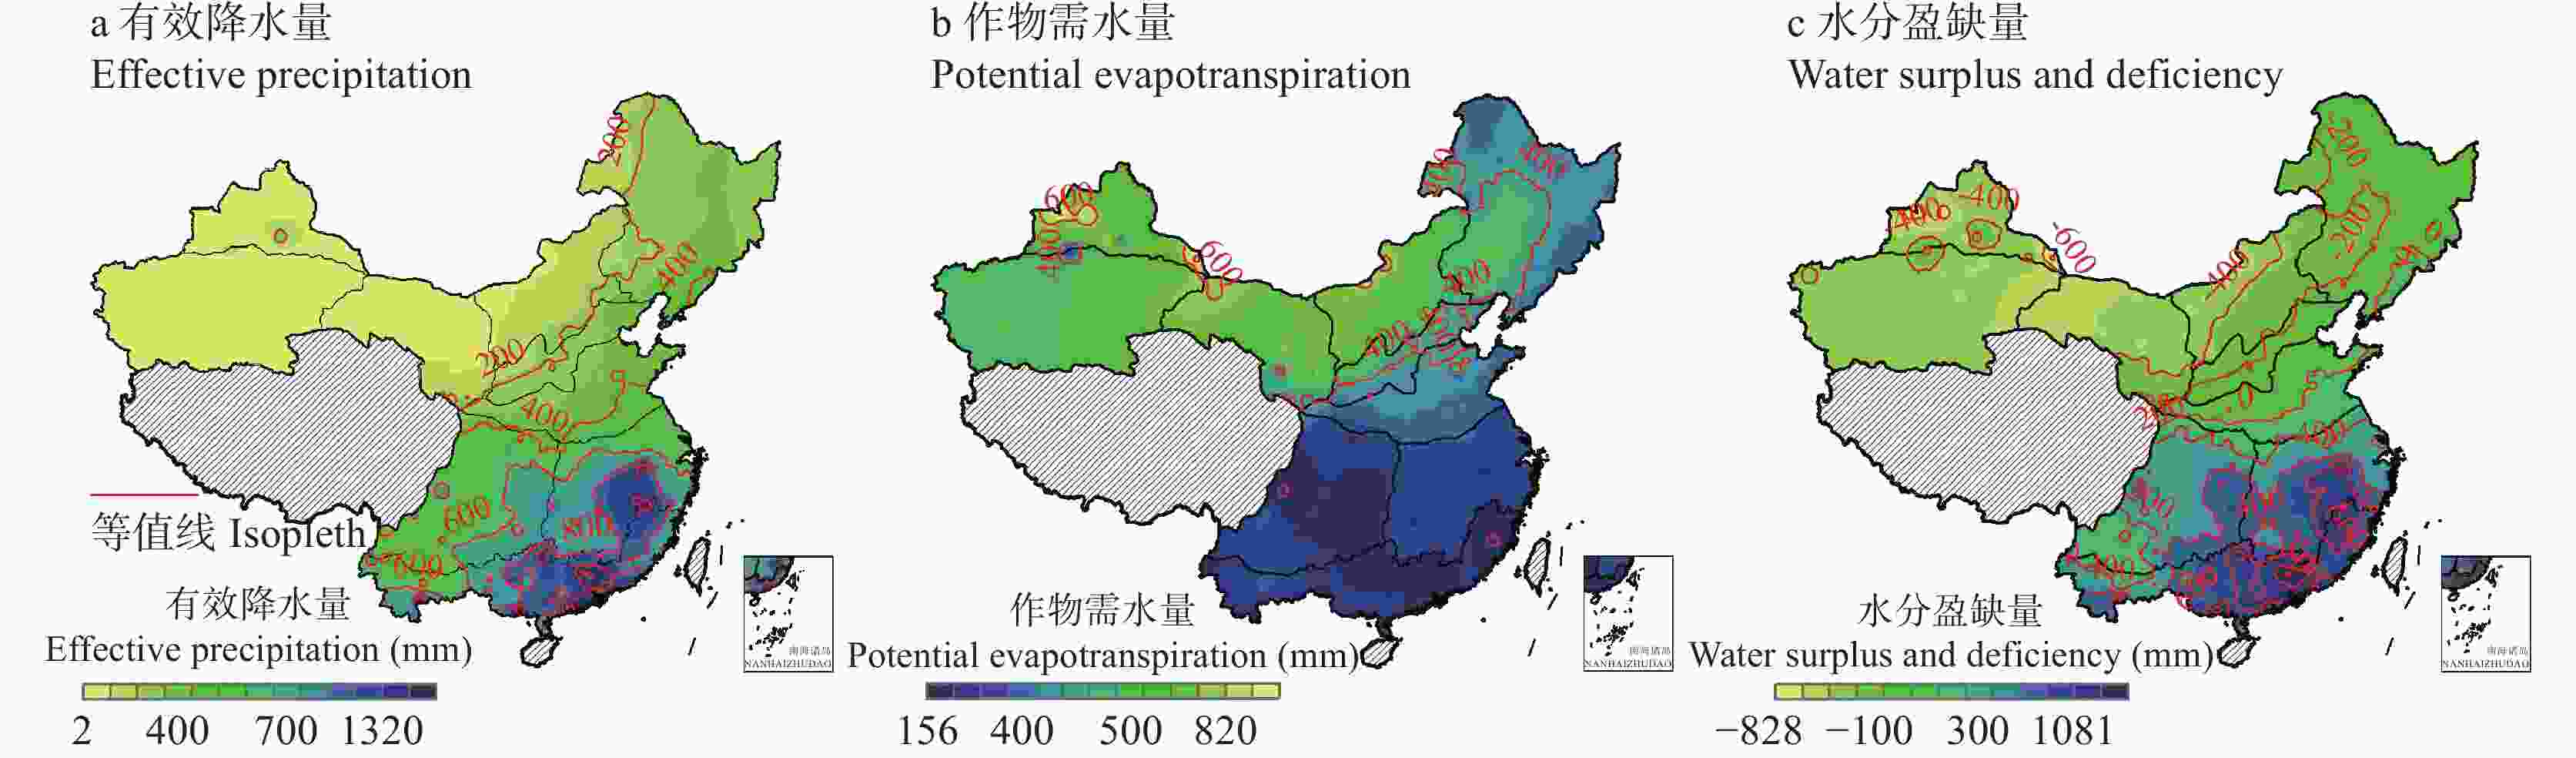
图 2 1961—2020年小麦全生长季有效降水量、作物需水量和水分盈缺量空间分布
Figure 2. Distributio of effective precipitation, and crop potential evapotranspiration and water surplus and deficiency during the wheat growing season in China from 1961 to 2020
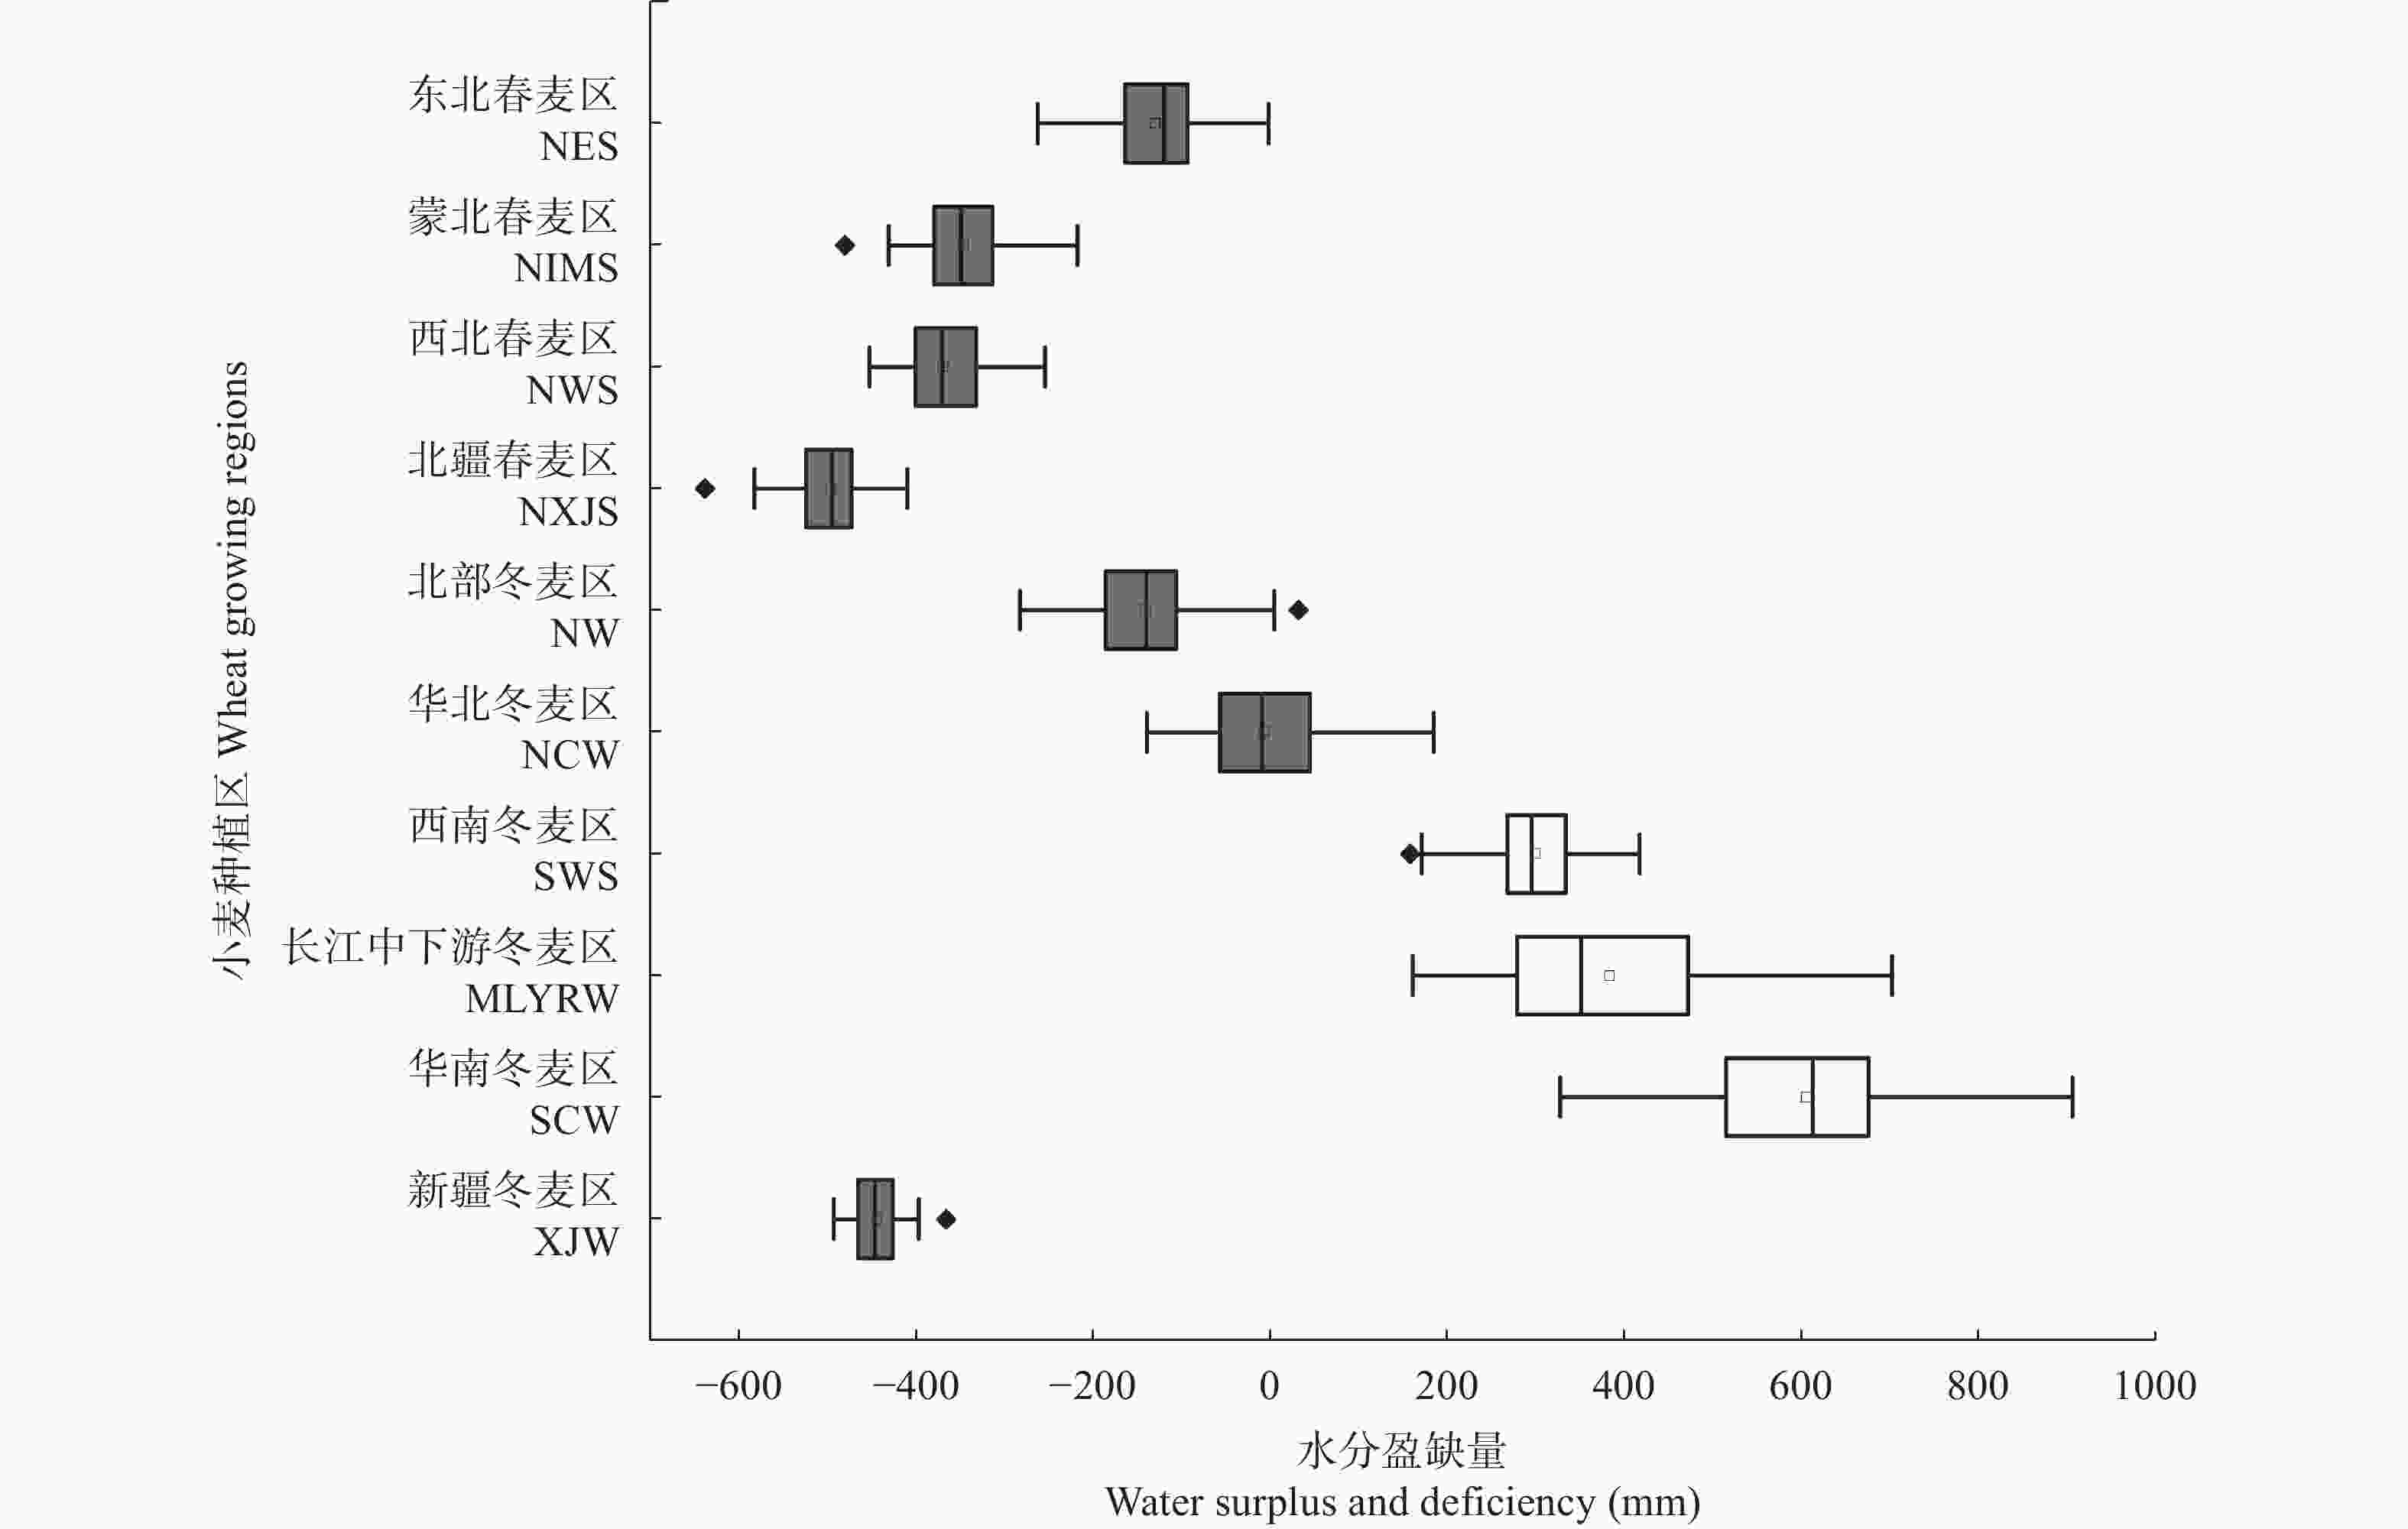
图 3 1961—2020年不同小麦种植区小麦全生长季水分盈缺量的盒须图
白色表示该种植区生长季内水分盈余, 不需要灌水; 灰色表示该种植区生长季内水分亏缺, 需要灌水。每个盒须图中的点代表最异常值, 线表示分位数(上四分位数、中位数和下四分位数)。The abbreviations of different wheat planting regions are shown in the table 1. White indicates that the planting regions are water surplus during the growing period and unrequire irrigation; grey indicates that the planting regions are water deficiency during the growing period and require irrigation. Within each boxplot, the dot represent outlier and the lines indicate the quantiles (25th percentile, 50th percentile and 75th percentile).
Figure 3. Mean values of the of water surplus and deficiency during the wheat growing season in different wheat planting regions of China from 1961−2020
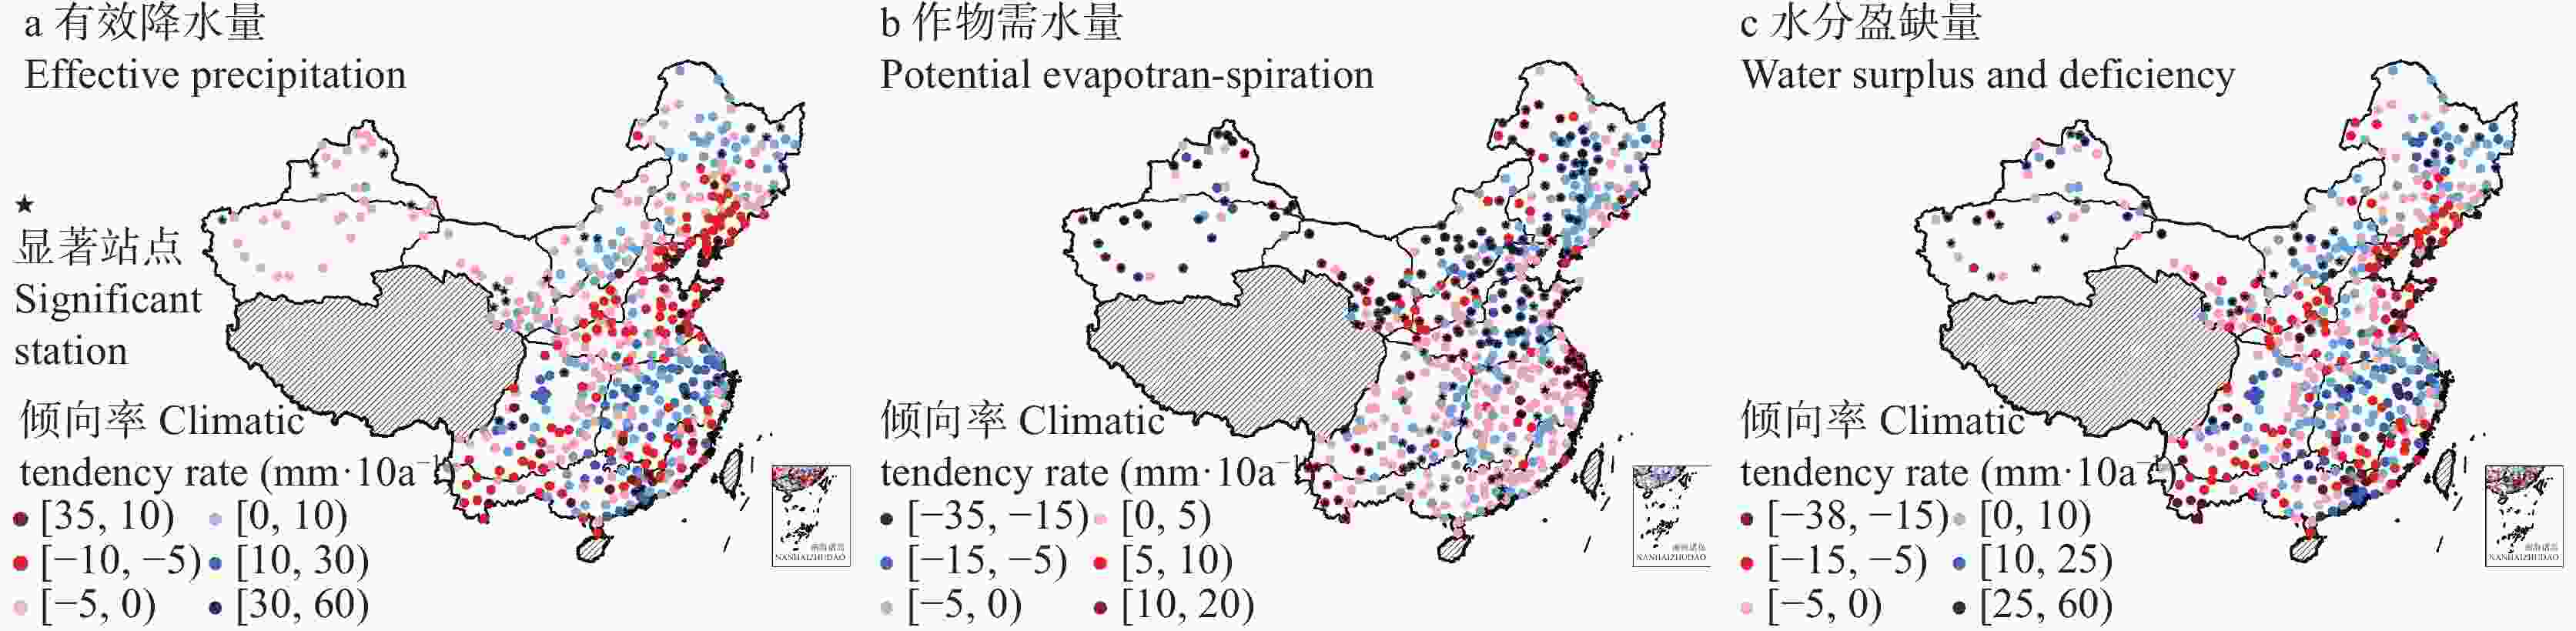
图 4 1961—2020年小麦全生长季有效降水量、作物需水量、水分盈缺量的气候倾向率
Figure 4. Climatic tendency rates of effective precipitation, crop potential evapotranspiration and water surplus and deficiency during the wheat growing season in China from 1961 to 2020
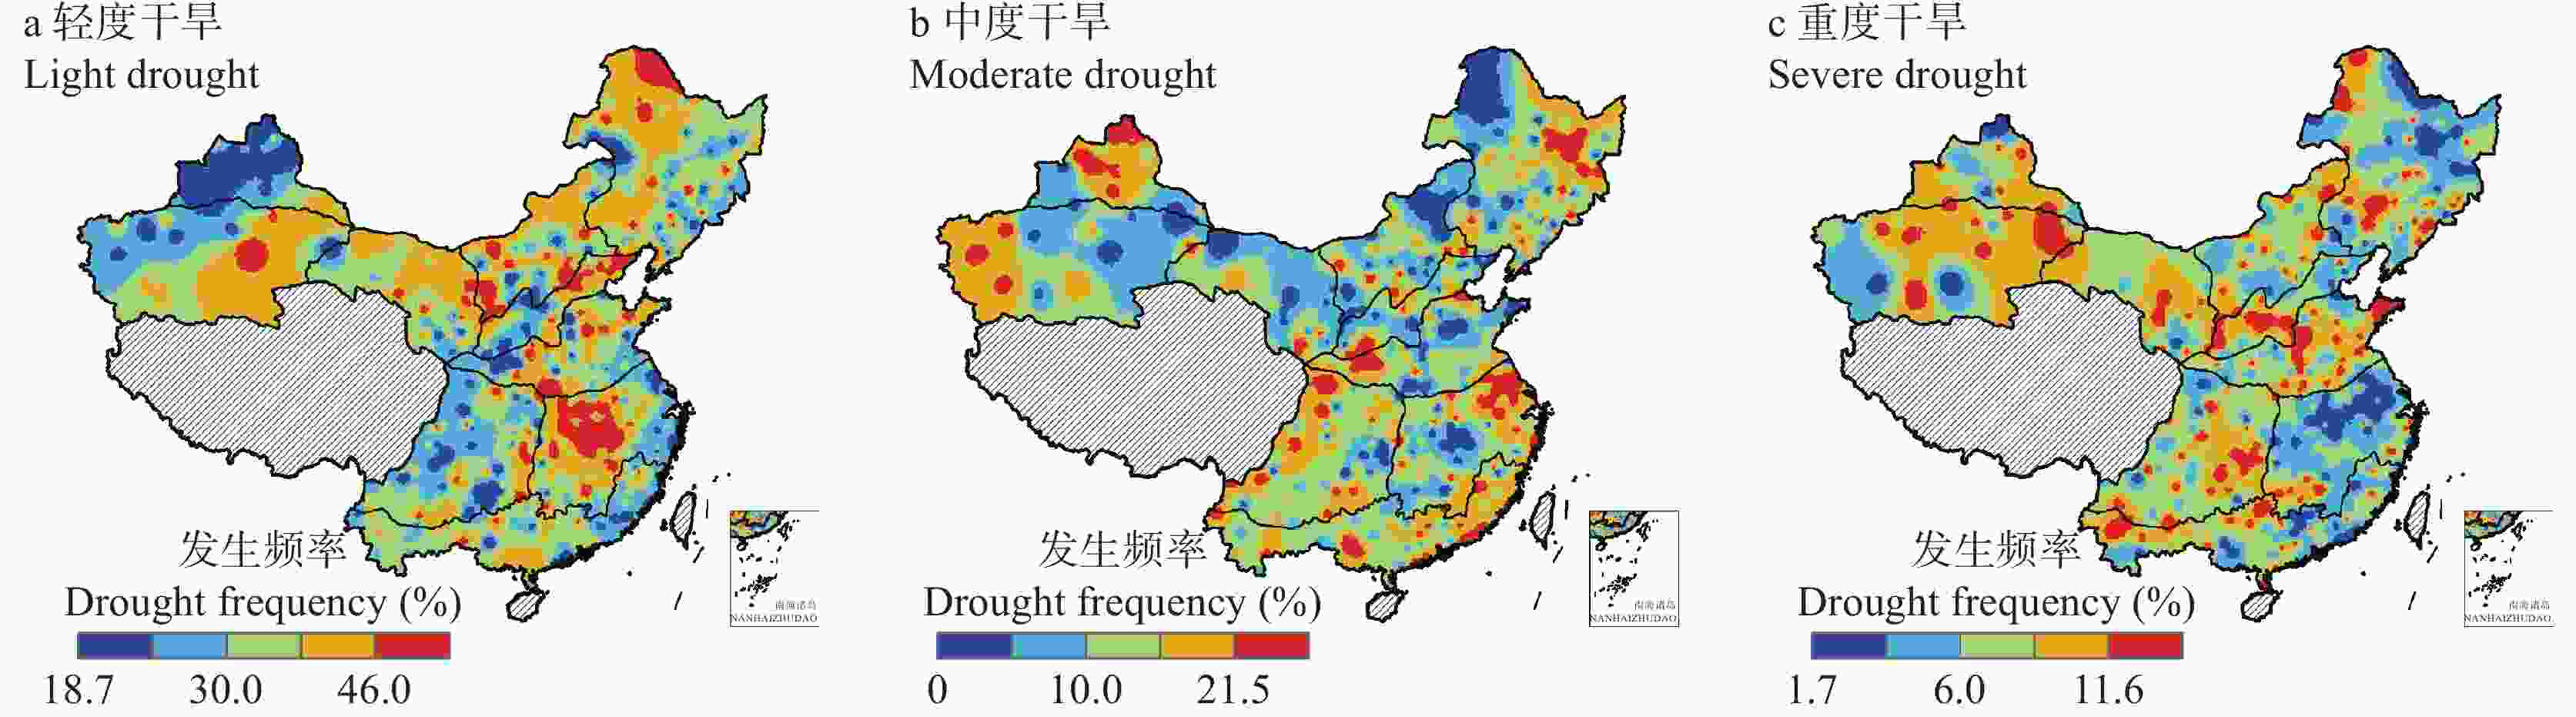
图 5 1961—2020年小麦生长季干旱频率空间分布
Figure 5. Distribution of drought frequency during the wheat growing season from 1961 to 2020
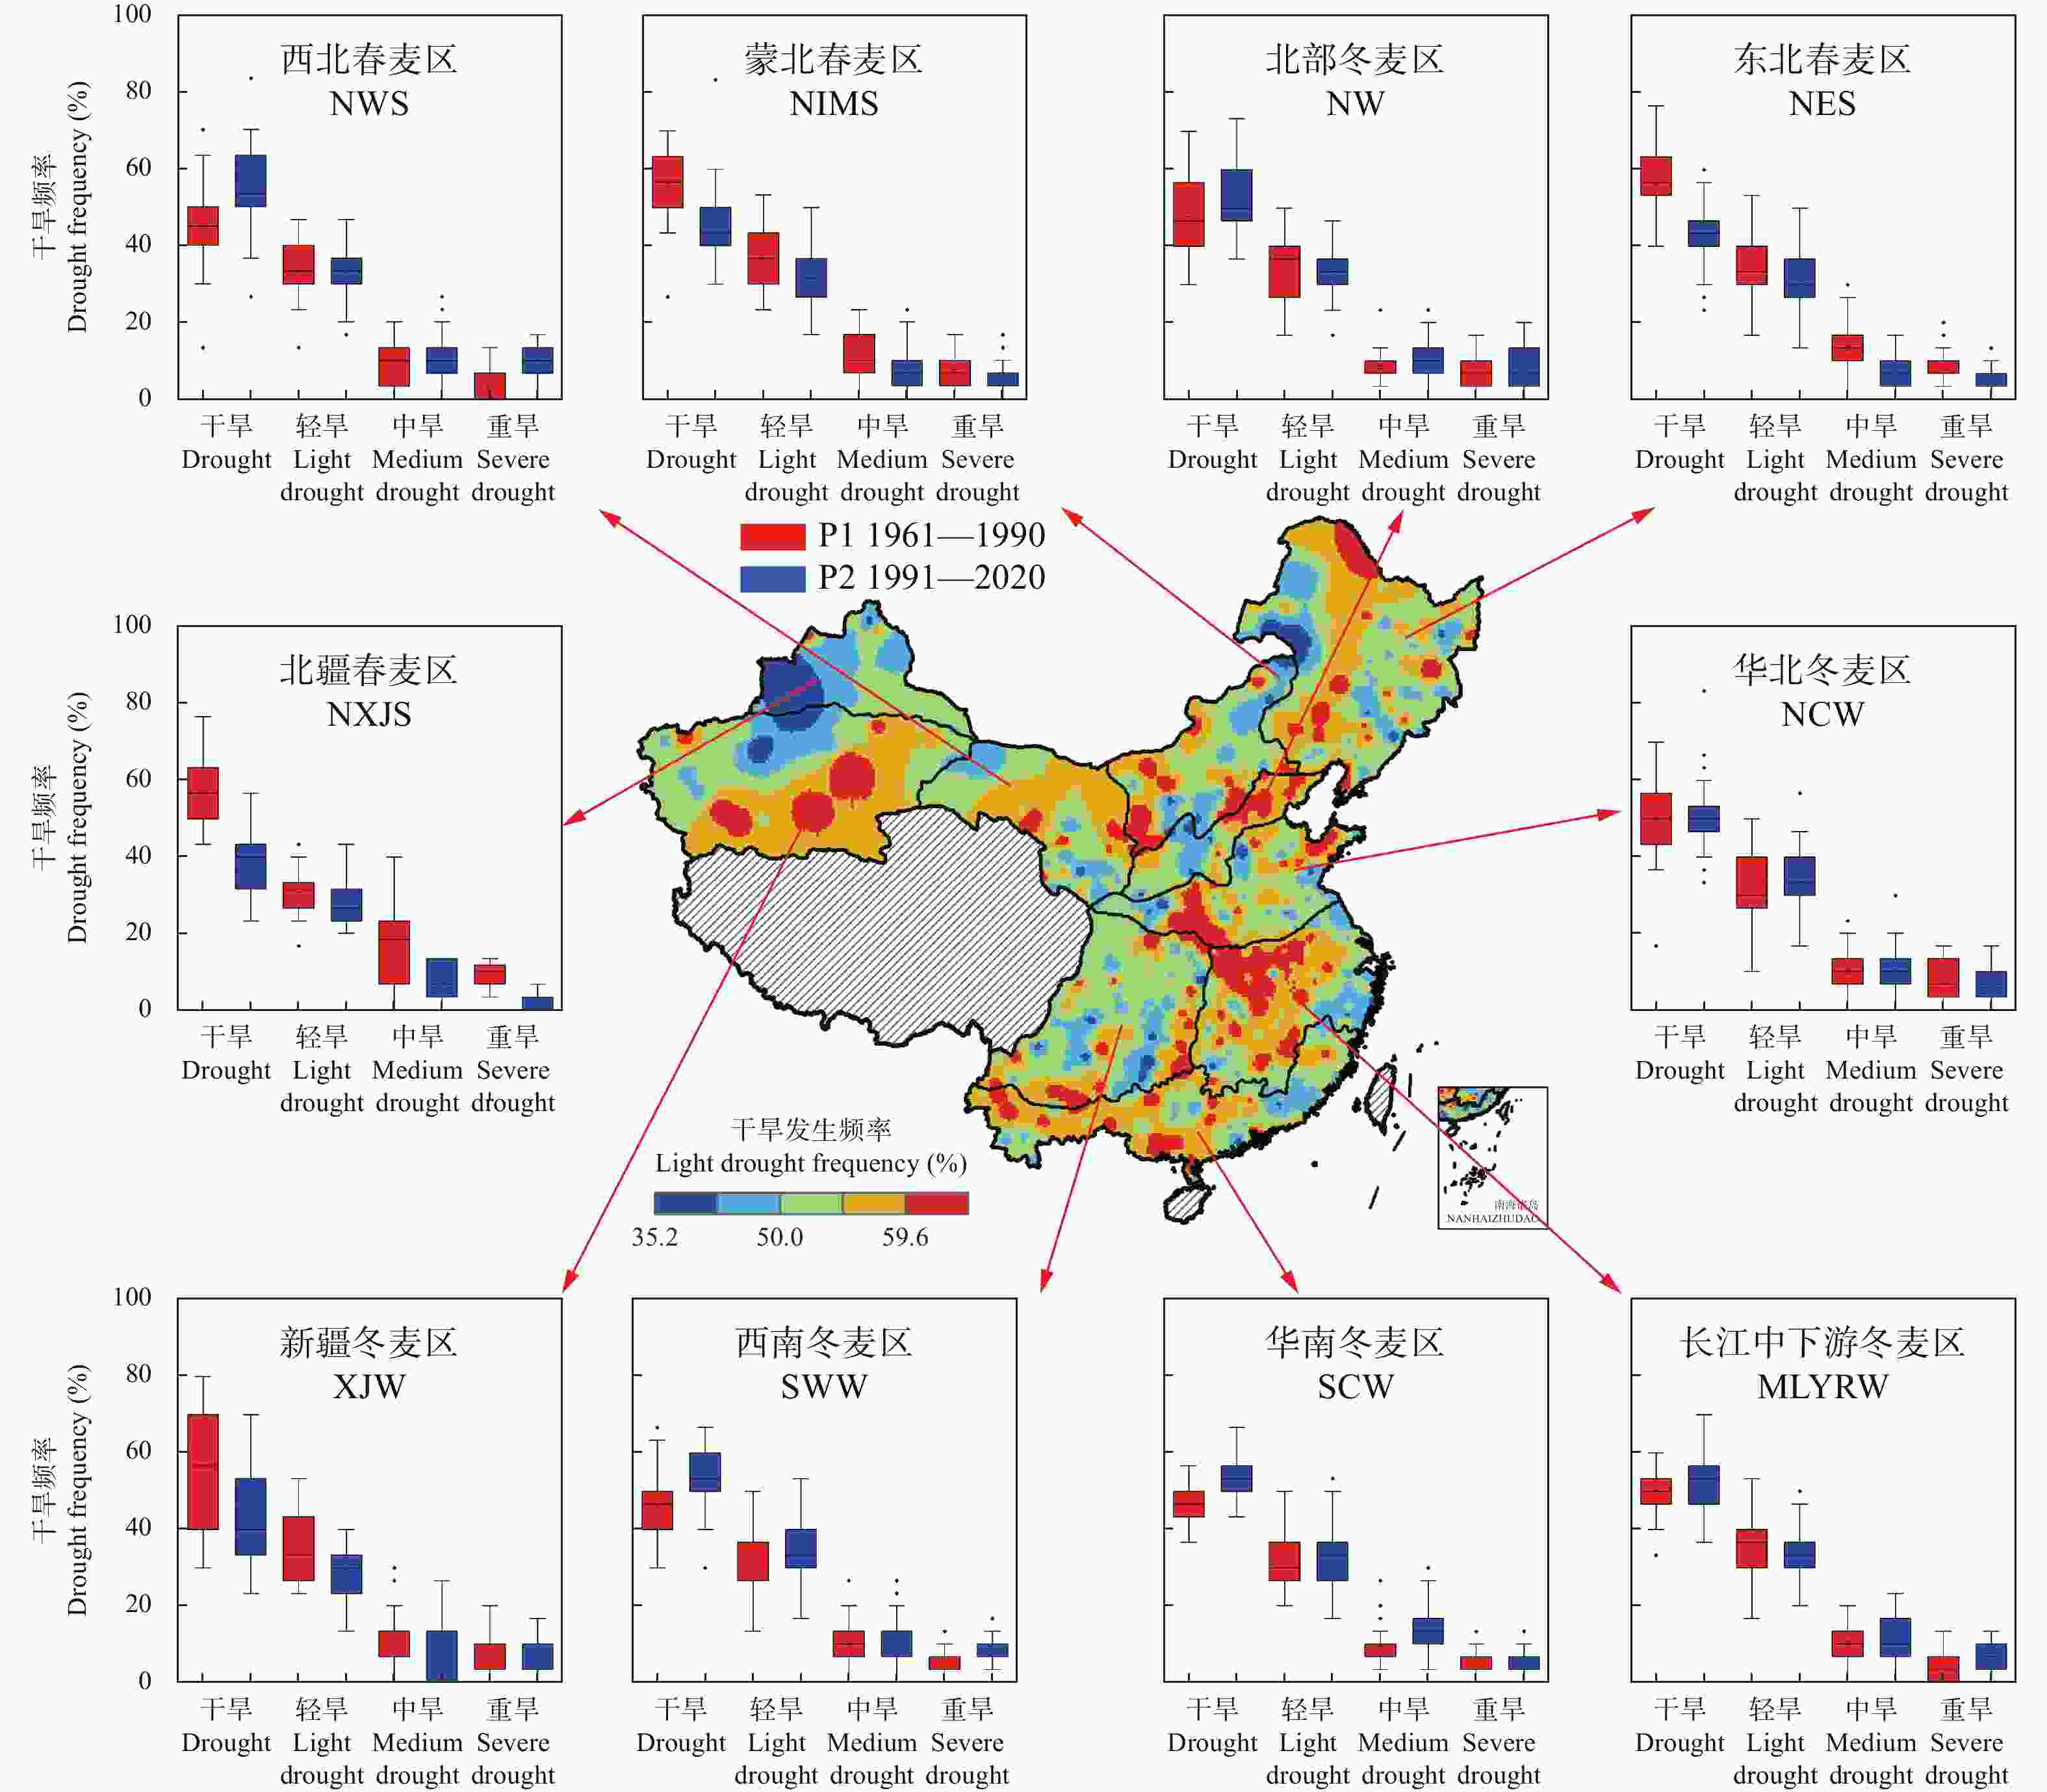
图 6 1961—2020年不同时段(1961—1990年, P1; 1991—2020年, P2)不同小麦种植区的小麦全生长季干旱频率空间分布
每个盒须图中的点代表最异常值, 线表示分位数(上四分位数、中位数和下四分位数)。The abbreviations of different wheat planting regions are shown in the table 1. Within each boxplot, the dot represent outlier and the lines indicate the quantiles (25th percentile, 50th percentile and 75th percentile).
Figure 6. Distribution of drought frequency during the wheat growing season in different wheat planting regions in different periods (P1: 1961 to 1990; P2: 1991 to 2020)
表 1 中国不同小麦种植区生长季及选取的SPEI指数
Table 1. Growing periods and standardized precipitation evapotranspiration indexes (SPEI) in different wheat planting regions of China
小麦种植区
Wheat planting region生长季
Date of growing season选取的SPEI值
Value of the selected SPEI蒙北春麦区
Northern Inner Mongolia Spring Wheat Region (NIMS)4月上旬—8月上旬
Early April − early August7月的SPEI-6值
SPEI-6 of July西北春麦区
Northwest China Spring Wheat Region (NWS)3月下旬—8月下旬
Late March − late August7月的SPEI-6值
SPEI-6 of July东北春麦区
Northeast China Spring Wheat Region (NES)4月中旬—7月下旬
Mid April Late July6月的SPEI-6值
SPEI-6 of June北疆春麦区
Northern Xinjiang Spring Wheat Region (NXJS)4月上旬—7月下旬
Early April − late July6月的SPEI-6值
SPEI-6 of June新疆冬麦区
Xinjiang Winter Wheat Region (XJW)10月上旬—6月下旬
Early October − late June5月的SPEI-6值
SPEI-6 of May北部冬麦区
Northern China Winter Wheat Region (NW)9月下旬—6月下旬
Late September − late June5月的SPEI-6值
SPEI-6 of May华北冬麦区
North China Plain Winter Wheat Region (NCW)10月中旬—6月上旬
Mid October − early June5月的SPEI-6值
SPEI-6 of May西南冬麦区
Southwest winter wheat region (SWW)11月上旬—5月中旬
Early November − mid May4月的SPEI-6值
SPEI-6 of April长江中下游冬麦区
Middle-Lower Reaches of the Yangtze River Winter Wheat Region (MLYRW)11月上旬—5月下旬
Early November − late May4月的SPEI-6值
SPEI-6 of April华南冬麦区
South China Winter Wheat Region (SCW)11月上旬—5月上旬
Early November − early May4月的SPEI-6值
SPEI-6 of April 下载: 导出CSV
表 2 1961—2020年不同时段小麦全生长季的有效降水量、作物需水量、水分盈缺量的气候倾向率
Table 2. Climatic tendency rates of precipitation, crop potential evapotranspiration and water surplus and deficiency during the wheat growing season in China in different periods from 1961 to 2020
小麦种植区
Wheat planting regionP1 (1961−1990) P2 (1991−2020) 有效降水量
Effective preclpntation作物需水量
Crop evapotranspiration水分盈缺量
Water surplus and deficiency有效降水量
Effective precipitation作物需水量
Crop evapotranspiration水分盈缺量
Water surplus and deficiency东北春麦区 NES 


蒙北春麦区 NIMS 


西北春麦区 NWS 


北疆春麦区 NXJS 


北部冬麦区 NW 


华北冬麦区 NCW 


西南冬麦区 SWW 


长江中下游冬麦区 MLYRW 


华南冬麦区 SCW 


新疆冬麦区XJW 


向上和向下的箭头分别表示倾向率的正值和负值。蓝色表示气候湿化, 红色表示气候干化, 绿色表明倾向率变化趋势不明显; 颜色越深, 表示变化趋势越大: 绿色[−5~5 mm·(10a)−1], 浅蓝色和浅粉色[绝对值为5~10mm·(10a)−1], 蓝色和粉色[绝对值>10 mm·(10a)−1]。The abbreviations of different wheat planting regions are shown in the table 1. Upward and downward arrows indicate positive and negetive climate tendency, respectively. Blue indicates a wetting climate, red indicates a drying climate, green indicates an insignificant climate trend. Colour shade denotes the effect value range: green, −5 ~5 mm·(10a)−1 (light effects); light blue and light pink, absolute values of 5~10 mm·(10a)−1 (medium effects ); blue and pink, absolute values >10 mm·(10a)−1 (large effects).
下载: 导出CSV
-
[1] DOUVILLE H, RAGHAVAN K, RENWICK J, et al. Water Cycle Changes[M]. IPCC. Climate change 2021: the physical science basis. Cambridge: Cambridge University Press, 2021 [2] 申双和, 张方敏, 盛琼. 1975—2004年中国湿润指数时空变化特征[J]. 农业工程学报, 2009, 25(1): 11−15SHEN S H, ZHANG F M, SHENG Q. Spatio-temporal changes of wetness index in China from 1975 to 2004[J]. Transactions of the Chinese Society of Agricultural Engineering, 2009, 25(1): 11−15 [3] 赵俊芳, 郭建平, 徐精文, 等. 基于湿润指数的中国干湿状况变化趋势[J]. 农业工程学报, 2010, 26(8): 18−24,386ZHAO J F, GUO J P, XU J W, et al. Trends of Chinese dry-wet condition based on wetness index[J]. Transactions of the Chinese Society of Agricultural Engineering, 2010, 26(8): 18−24,386 [4] 胡琦, 董蓓, 潘学标, 等. 1961—2014年中国干湿气候时空变化特征及成因分析[J]. 农业工程学报, 2017, 33(6): 124−132,315HU Q, DONG B, PAN X B, et al. Spatiotemporal variation and causes analysis of dry-wet climate over period of 1961–2014 in China[J]. Transactions of the Chinese Society of Agricultural Engineering, 2017, 33(6): 124−132,315 [5] 中华人民共和国统计局. 中国统计年鉴[M]. 北京: 中国统计出版社, 2020National Bureau of Statistics of China. China Statistical Yearbook[M]. Beijing: China Statistics Press, 2020 [6] 姜大膀, 王娜. IPCC AR6报告解读: 水循环变化[J]. 气候变化研究进展, 2021, 17(6): 699−704JIANG D B, WANG N. Water cycle changes: interpretation of IPCC AR6[J]. Climate Change Research, 2021, 17(6): 699−704 [7] 卫捷, 马柱国. Palmer干旱指数、地表湿润指数与降水距平的比较[J]. 地理学报, 2003, 58(7s): 117–124WEI J, MA Z G. Comparison of palmer drought severity index, percentage of precipitation anomaly and surface humid index[J]. Acta Geographica Sinica, 2003, 58(7s): 117–124 [8] VICENTE-SERRANO S M, BEGUERÍA S, LÓPEZ-MORENO J I. A multiscalar drought index sensitive to global warming: the standardized precipitation evapotranspiration index[J]. Journal of Climate, 2010, 23(7): 1696−1718 doi: 10.1175/2009JCLI2909.1 [9] 史建国, 严昌荣, 何文清, 等. 黄河流域水分亏缺时空格局变化研究[J]. 自然资源学报, 2008, 23(1): 113−119SHI J G, YAN C R, HE W Q, et al. Study on spatial and temporal variation of water surplus and deficiency in Yellow River Basin[J]. Journal of Natural Resources, 2008, 23(1): 113−119 [10] 房全孝, 王建林, 于舜章. 华北平原小麦-玉米两熟制节水潜力与灌溉对策[J]. 农业工程学报, 2011, 27(7): 37−44FANG Q X, WANG J L, YU S Z. Water-saving potential and irrigation strategies for wheat-maize double cropping system in the North China Plain[J]. Transactions of the Chinese Society of Agricultural Engineering, 2011, 27(7): 37−44 [11] ZENG R Y, YAO F M, ZHANG S, et al. Assessing the effects of precipitation and irrigation on winter wheat yield and water productivity in North China Plain[J]. Agricultural Water Management, 2021, 256: 107063 doi: 10.1016/j.agwat.2021.107063 [12] 赵彦茜, 肖登攀, 齐永青, 等. 华北平原不同降水年型和作物种植模式下的产量和耗水模拟[J]. 农业工程学报, 2018, 34(20): 108−116ZHAO Y X, XIAO D P, QI Y Q, et al. Crop yield and water consumption of different cropping patterns under different precipitation years in North China Plain[J]. Transactions of the Chinese Society of Agricultural Engineering, 2018, 34(20): 108−116 [13] 李亮. 气候变化条件下中国西北地区主要作物需水量时空演变及干旱指标研究[D]. 杨凌: 西北农林科技大学, 2019LI L. Impact of climate change on crop water requirement and drought indices in Northwest China[D]. Yangling: Northwest A & F University, 2019 [14] 张永, 陈发虎, 勾晓华, 等. 中国西北地区季节间干湿变化的时空分布−基于PDSI数据[J]. 地理学报, 2007, 62(11): 1142−1152ZHANG Y, CHEN F H, GOU X H, et al. The temporal and spatial distribution of seasonal dry-wet changes over the northwesterina: based on PDSI[J]. Acta Geographica Sinica, 2007, 62(11): 1142−1152 [15] 靳立亚, 李静, 王新, 等. 近50年来中国西北地区干湿状况时空分布[J]. 地理学报, 2004, 59(6): 847−854 doi: 10.3321/j.issn:0375-5444.2004.06.006JIN L Y, LI J, WANG X, et al. The temporal and spatial distribution of surface dry-wet conditions over northwestern China in recent 50 years[J]. Acta Geographica Sinica, 2004, 59(6): 847−854 doi: 10.3321/j.issn:0375-5444.2004.06.006 [16] 赵茹欣, 王会肖, 董宇轩. 气候变化对关中地区粮食产量的影响及趋势分析[J]. 中国生态农业学报(中英文), 2020, 28(4): 467−479ZHAO R X, WANG H X, DONG Y X. Impact of climate change on grain yield and its trend across Guanzhong region[J]. Chinese Journal of Eco-Agriculture, 2020, 28(4): 467−479 [17] 周晓红, 赵景波. 历史时期关中地区气候变化与灾害关系的分析[J]. 干旱区资源与环境, 2006, 20(3): 75−7ZHOU X H, ZHAO J B. Analysis on the relation between climatic changes and calamities in Guanzhong regional within the past 3000 years[J]. Journal of Arid Land Resources and Environment, 2006, 20(3): 75−7 [18] 王允, 刘普幸, 曹立国, 等. 基于湿润指数的1960—2011年中国西南地区地表干湿变化特征[J]. 自然资源学报, 2014, 29(5): 830−838WANG Y, LIU P X, CAO L G, et al. Characteristics of southwestern China dry-wet condition based on wetness index in 1960−2011[J]. Journal of Natural Resources, 2014, 29(5): 830−838 [19] 陆双飞, 殷晓洁, 韦晴雯, 等. 气候变化下西南地区植物功能型地理分布响应[J]. 生态学报, 2020, 40(1): 310−324LU S F, YIN X J, WEI Q W, et al. The geographical distribution response of plant functional types to climate change in southwestern China[J]. Acta Ecologica Sinica, 2020, 40(1): 310−324 [20] 戴声佩, 李海亮, 刘海清, 等. 全球气候变暖背景下华南地区农业气候资源时空变化特征[J]. 中国农业资源与区划, 2014, 35(1): 52−60DAI S P, LI H L, LIU H Q, et al. The spatio-temporal change characteristics of agriculture climate resources in Southern China under the background of global warming[J]. Chinese Journal of Agricultural Resources and Regional Planning, 2014, 35(1): 52−60 [21] 伍红雨, 杜尧东. 1961—2008年华南区域寒潮变化的气候特征[J]. 气候变化研究进展, 2010, 6(3): 192−197WU H Y, DU Y D. Climatic characteristics of cold waves in South China in the period 1961–2008[J]. Advances in Climate Change Research, 2010, 6(3): 192−197 [22] 中国科学院编辑委员会. 中国自然地理: 气侯[M]. 北京: 科学出版社, 1984Chinese Academy of Sciences Editorial Committee. Natural Geography of China: Meteorology[M]. Beijing: Science Press, 1984 [23] 吴绍洪, 尹云鹤, 郑度, 等. 近30年中国陆地表层干湿状况研究[J]. 中国科学(D辑: 地球科学), 2005, 35(3): 276–283WU S H, YIN Y H, ZHENG D, et al. Dry and wet conditions of land surface in China in recent 30 years[J. ] Scientia Sinica (D: Terrae), 2005, 35(3): 276–283 [24] 赵广才. 中国小麦种植区划研究(一)[J]. 麦类作物学报, 2010, 30(5): 886−895ZHAO G C. Study on Chinese wheat planting regionalization (I)[J]. Journal of Triticeae Crops, 2010, 30(5): 886−895 [25] 王文玉, 张强, 阳伏林. 半干旱榆中地区最小有效降水量及降水转化率的研究[J]. 气象学报, 2013, 71(5): 952−961WANG W Y, ZHANG Q, YANG F L. Study of the minimum available precipitation and the precipitation conversion rate in the semiarid Yuzhong region[J]. Acta Meteorologica Sinica, 2013, 71(5): 952−961 [26] ALLEN R G, PEREIRA L S, RAES D, et al. Crop evapotranspiration guidelines for computing crop water requirements[J]. FAO Irrigation and drainage paper 56, 1998: 1−50 [27] GAO X R, ZHAO Q, ZHAO X N, et al. Temporal and spatial evolution of the standardized precipitation evapotranspiration index (SPEI) in the Loess Plateau under climate change from 2001 to 2050[J]. Science of the Total Environment, 2017, 595: 191−200 doi: 10.1016/j.scitotenv.2017.03.226 [28] 马雪晴, 胡琦, 王靖, 等. 基于SPEI_KC的华北平原小麦玉米周年干旱特征分析[J]. 农业工程学报, 2020, 36(21): 164−174MA X Q, HU Q, WANG J, et al. Spatiotemporal variation characteristics of drought trend at annual of wheat-maize in the North China Plain based on SPEI_KC index[J]. Transactions of the Chinese Society of Agricultural Engineering, 2020, 36(21): 164−174 [29] 刘钰, Pereira L S. 对FAO推荐的作物系数计算方法的验证[J]. 农业工程学报, 2000, 16(5): 26−30LIU Y, PEREIRA L S. Validation of FAO methods for estimating crop coefficients[J]. Transactions of the Chinese Society of Agricultural Engineering, 2000, 16(5): 26−30 [30] 栗健, 岳耀杰, 潘红梅. 中国主要小麦种植区雨养条件下水分胁迫发生规律模拟[J]. 干旱地区农业研究, 2015, 33(1): 105−112LI J, YUE Y J, PAN H M. Simulation of water stress regularity in main wheat planting regions in China under rainfed conditions[J]. Agricultural Research in the Arid Areas, 2015, 33(1): 105−112 [31] 张雅芳. 全球主要农业生产国作物需水及缺水程度研究[D]. 石家庄: 河北师范大学, 2020ZHANG Y F. Study on global crop water demand and water shortage in major agricultural production countries[D]. Shijiazhuang: Hebei Normal University, 2020 -

 下载:
下载:


 点击查看大图

计量
- 文章访问数: 111
- HTML全文浏览量: 49
- PDF下载量: 8
- 被引次数: 0
