

Measurement and analysis of agricultural green total factor productivity based on farmers’ perspective
-
摘要: 提升农业绿色全要素生产率, 加快农业绿色转型是全面建设社会主义现代化强国的必然选择。研究以中国家庭追踪调查(China Family Panel Studies, CFPS)的全国性大容量样本农户数据为蓝本, 在微观测度方法比较分析的基础上, 基于技术优化的Malmquist-Luenberger指数为基准, 测度分析了农户层农业绿色全要素生产率的状况, 并进一步选用核密度估计法和Dagum基尼系数法, 揭示呈现了微观样本农业绿色全要素生产率的动态演变规律及其区域差异特征。主要研究发现如下: 1)技术优化的Malmquist-Luenberger指数测度显示, 2014、2016和2018年3期样本农户的农业绿色全要素生产率均值为1.0030, 总体发展态势良好; 农业绿色技术变化、绿色技术效率变化的共同作用是驱动农户层面农业绿色发展变化的主要引致因素, 且后者的影响程度远大于前者; 农户资源配置、管理模式及组织方式的改善优化, 在现阶段是农户发展绿色农业的提升关键, 其影响相对高于农户农业生产技术的革新。2)通过核密度估算发现, 2016和2018年样本农户的绿色全要素生产率集中度较高, 农业绿色技术效率并未出现两级分化, 但农业绿色技术进步呈现上升趋势。3) Dagum基尼系数法结果表明, 农户层面农业绿色全要素生产率的区域差距不断缩小, 区域差距的降幅达22.32%, 超变密度是引致主因; 在区域内差距上, 东、西、中部地区内部, 农户的绿色农业差距依次递减; 在区域间差距上, 东西、东中、中西部间差距不断缩小、协同性不断增强, 但差距易受到环境因素影响。
-
关键词:
- 农户视角 /
- 农业全要素生产效率 /
- 技术优化的Malmquist-Luenberger测度 /
- 差距识别
Abstract: Enhancing agricultural green total factor productivity and accelerating green transformation of agriculture are inevitable choices for building a strong socialist modernization country in a comprehensive manner. Based on the comparative analysis of micro-measurement methods, the study analyzes the status of agricultural green total factor productivity at the farm household level based on the technically optimized Malmquist-Luenberger index. The kernel density estimation method and the Dagum Gini coefficient method were further used to reveal the dynamic evolution of agricultural green total factor productivity and its regional differences in the micro sample. The main findings are as follows: 1) from the measurement results, the mean value of agricultural green total factor productivity in the micro field during the sample period is 1.0030, with a good overall development trend. The mean value of agricultural green total factor productivity of farmers in 2016 is 1.0099, and agricultural green development is in a good growth trend. The mean values of technical efficiency change and technical progress change are 1.0165 and 0.9928, indicating that the improvement of farmers’ green agricultural technical efficiency is the main driving factor, while the change of technical progress is relatively slow. By 2018, the mean value of green total factor production of farmers was 0.9960, which showed a decreasing trend. The corresponding mean values of technical efficiency change and technical progress change were 0.9765 and 1.0200, indicating that the technical efficiency improvement of green agriculture did not achieve a sustainable spillover effect, and the innovation function of technical progress change played a role in boosting. 2) In terms of contributing factors, whether using subjective environmental assessment scores or objective provincial-level environmental pollution data as proxies for non-desired outputs, among farmers with higher levels of agricultural green total factor productivity, agricultural green technological progress and agricultural green technological efficiency were found to be more effective. In farmers with high levels of agricultural green total factor productivity, both green technological advances and green technological efficiency in agriculture are the drivers of green growth, and the contribution of the latter is greater than that of the former. The former is significantly worse than the latter in terms of regression. Therefore, the improvement and optimization of farmers’ resource allocation, management mode and organization is the key to enhance the agricultural green total factor productivity at the present stage, and its impact is relatively higher than the innovation of agricultural production technology. 3) From the perspective of dynamic evolution pattern, in terms of agricultural green total factor productivity, the concentration in 2016 and 2018 is high, showing distinct clustering, the divergence phenomenon is not obvious, and the number of farmers with high level of green development in 2018 is much higher than that in 2016; in terms of agricultural green technical efficiency of farmers, there is no bifurcation in 2016 and 2018. The number of low-level farmers in 2018 is more than that in 2016, there is a regression phenomenon, and the difference between the agricultural green technical efficiency of high and low-level farmers is obvious; in terms of agricultural green technical progress of farmers, the overall is in the rising stage, the number of low-level farmers in 2016 is less, and the number of high-level farmers is relatively more, while in 2018, the number of high and In 2018, the number of high and low level farmers remained the same, and the spatial clustering effect appeared. In 2018, the number of farmers with low level of agricultural green technology progress decreased “precipitously”. On the premise that the number of farmers remained unchanged, this part of low level farmers moved to the middle and high level groups, forming the dynamic transfer effect of “internal push and external pull” is formed. Therefore, in comprehensively promoting the modernization of agriculture and rural areas and accelerating the process of green transformation of agriculture, we should be alert to and prevent the “polarization” of farm households. 4) From the perspective of regional disparity, the overall gap of agricultural green total factor productivity in the sample period is decreasing, with a decline of 22.32%. From the source decomposition, the hyper-variance density is the main cause of the overall regional disparity in agricultural green total factor productivity; from the contribution rate, the contribution rate of hyper-variance density is much higher than the contribution rate of intra- and inter-regional disparity, indicating that the cross-over problem between different regions is the main cause of the overall disparity in agricultural green total factor productivity at the farmer level. Further, from the intra-regional disparity, the disparity of agricultural green total factor productivity at the household level decreases within the eastern and western regions; from the inter-regional disparity, the disparity between the eastern-western, eastern-central, and central-western regions decreases continuously during the sample period and the synergy is the strongest, but this gap is vulnerable to environmental factors. -

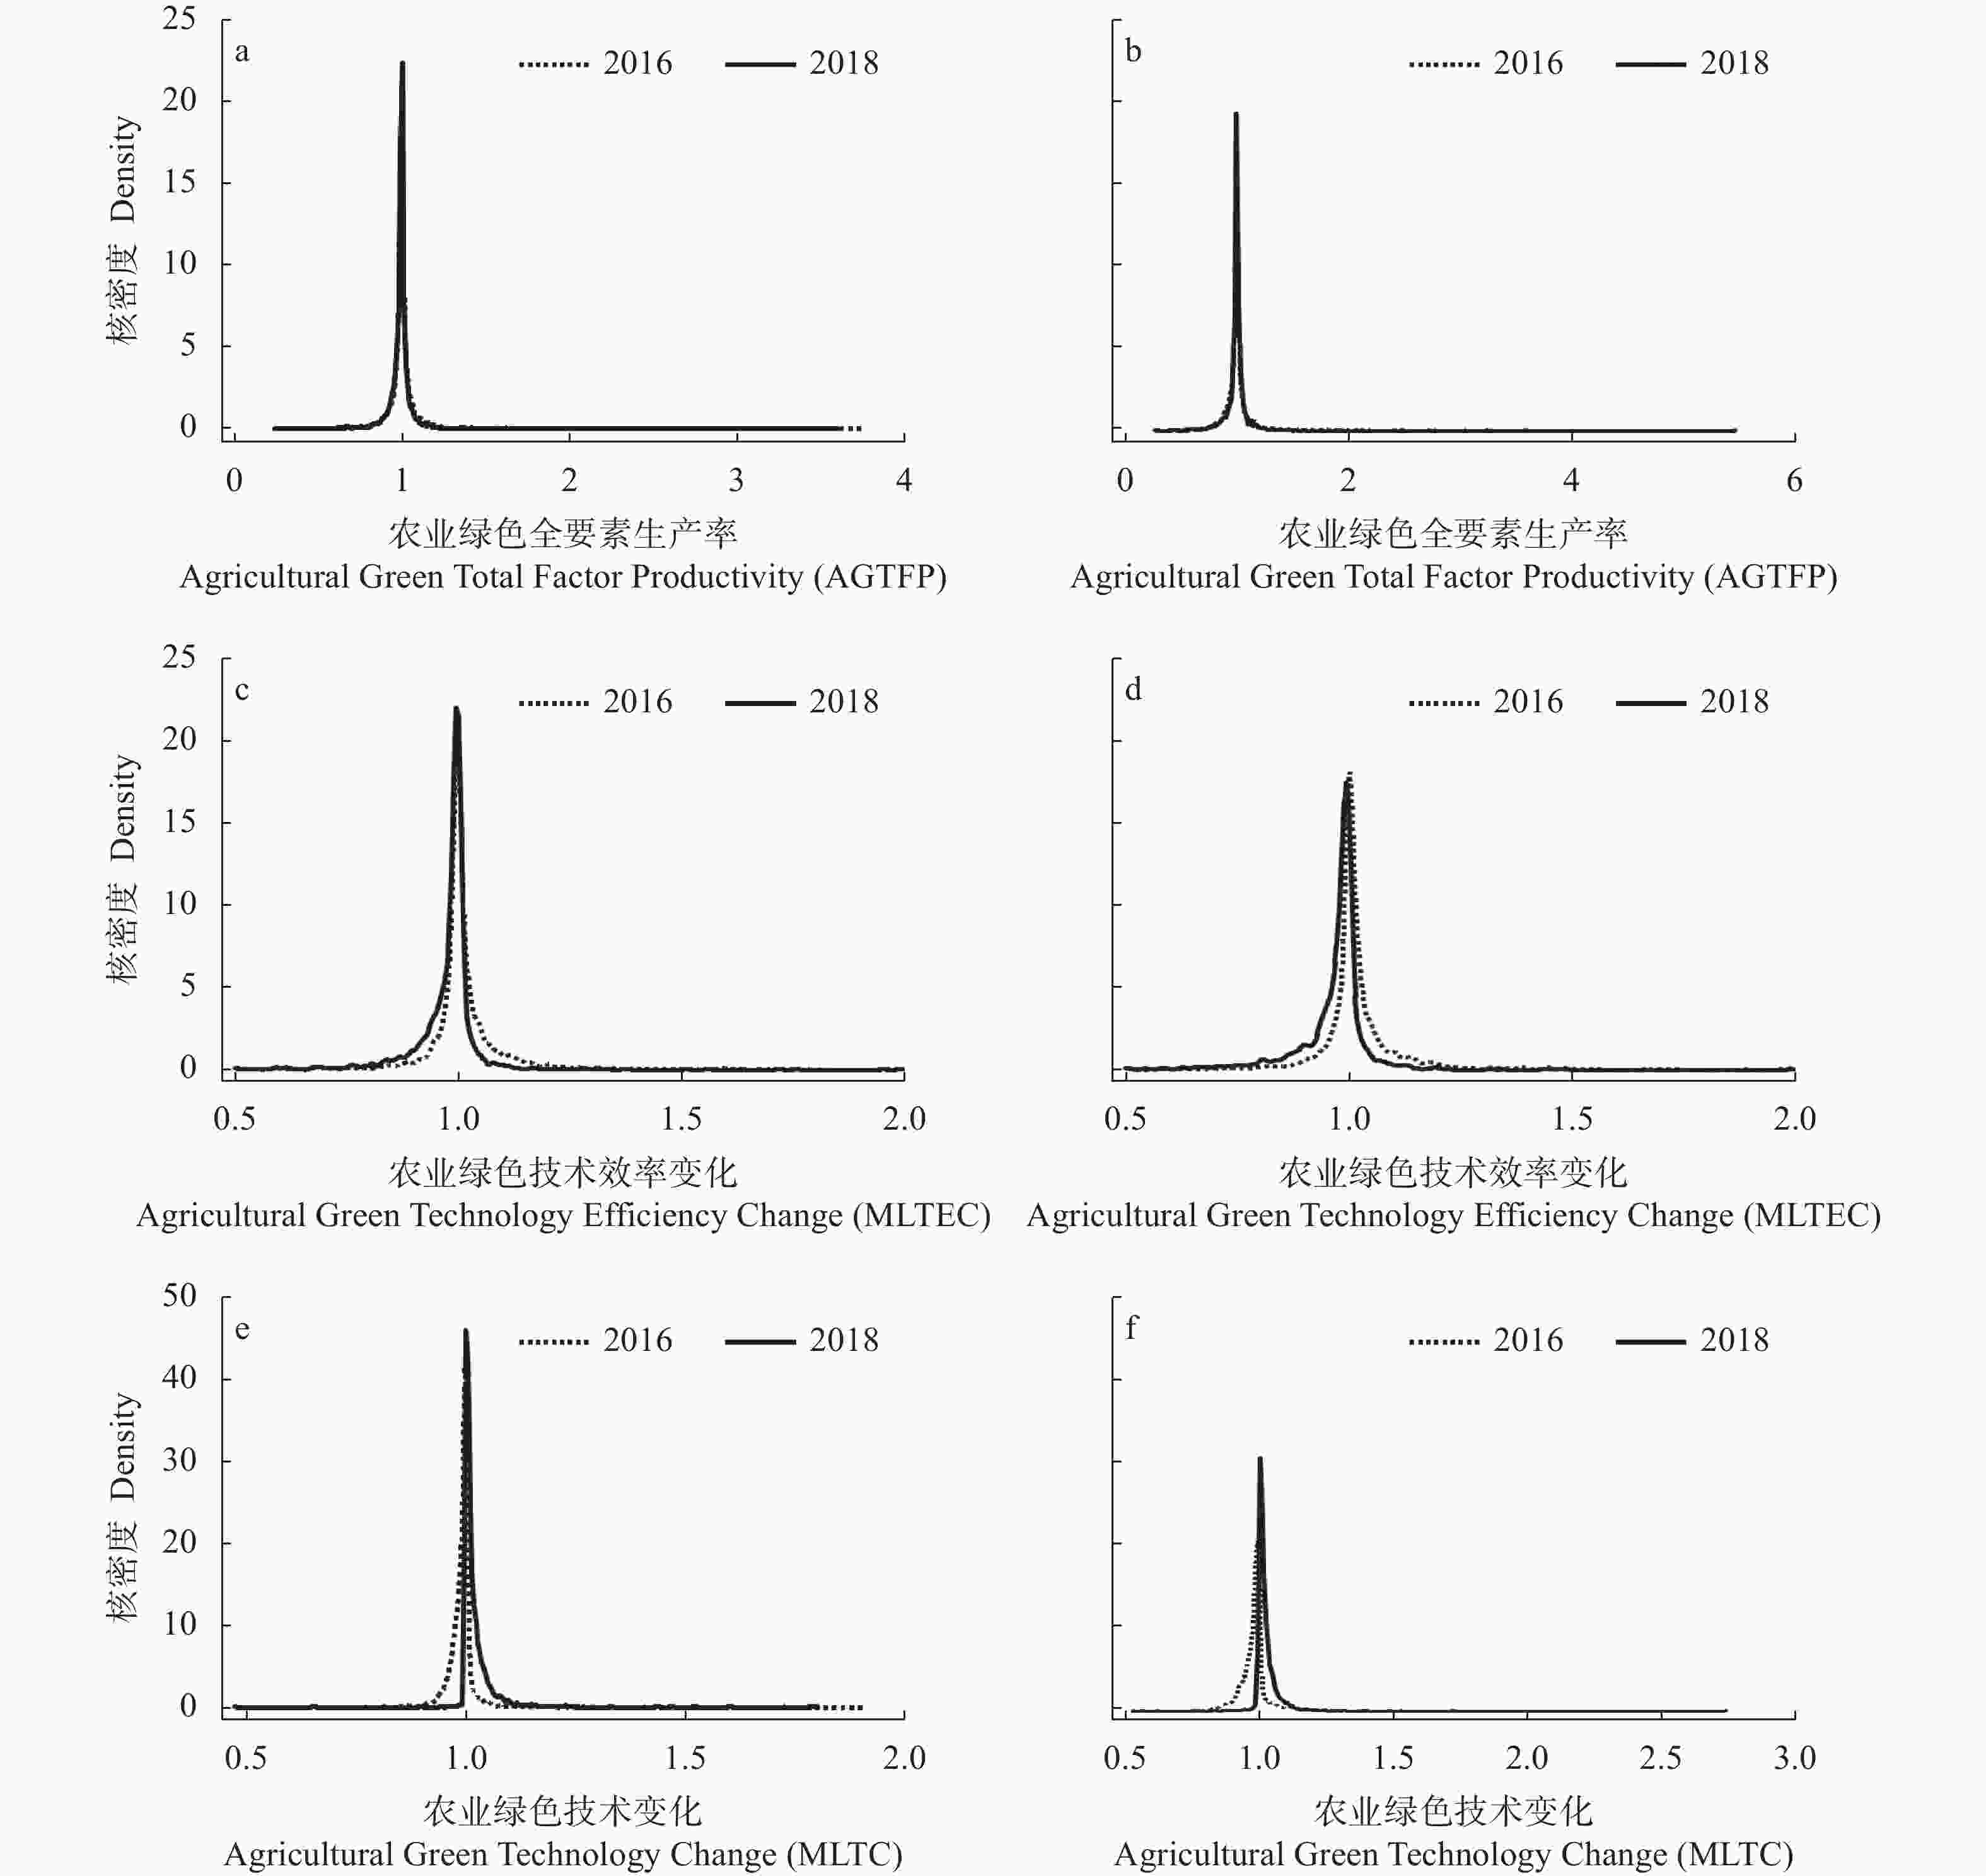
图 1 农业绿色全要素生产率(a, b)、农业绿色技术效率变化(c, d)和农业绿色技术变化(e, f)的核密度分布
左图为使用虚拟户主的主观污染感知度作为非期望产出; 右图为使用农业COD、TN、TP等标排放量等客观农业面源污染作为非期望产出。The left panel uses the subjective pollution perception of the virtual household head as the non-desired output; the right panel uses objective agricultural surface source pollution such as agricultural COD, TN, TP and other standard emissions as the non-desired output.
Figure 1. Kernel density distribution of agricultural green total factor productivity (a, b), agricultural green technical efficiency change (c, d) and agricultural green technological change (e, f)
表 1 改进后的农业绿色全要素生产率测算体系
Table 1. An improved system for measuring Agricultural Green Total Factor Productivity
目标层
Target layer一级指标
Primary indicator二级指标
Secondary indicator
latitude变量定义
Specific variables
and descriptions指标单位
Indicator unit符号
Symbol农业绿色全要素生产率 Agricultural Green Total Factor Productivity 投入指标
Inputs
Indicators资本 Capital 农业生产的流动性资本投入与固定性资本投入之和
Sum of liquid capital inputs and fixed capital inputs in agricultural production¥ x1 劳动力 Labor 过去12个月参与的自家农业生产活动的家庭成员数 Number of household members involved in home-based agricultural production activities in the past 12 months Persons x2 土地 Land 承包地面积与租用地面积之和/15
Sum of contracted land area and leased land areahm² x3 期望产出指标 Desired Output Indicators 农产品总产出
Total agricultural output过去12个月, 家庭所生产的农产品、养殖物及副产品销售收入以及自家消费总值之和
The sum of income from the sale of agricultural products, farm products and by-products produced by the household and the total value of own consumption in the past 12 months¥ y1 非期望产出指标
Non-desired output indicators农业面源污染
Agricultural surface source pollution农业化学需氧量(COD)等标排放量
Agricultural chemical oxygen demand (COD) equivalent emissionst yu2 农业总氮(TN)等标排放量
Agricultural total nitrogen (TN) equivalent emissionsyu3 农业总磷(TP)等标排放量
Agricultural total phosphorus (TP) equivalent emissionsyu4 主观污染感知度
Subjective pollution perception degree采用农业活动管账人对环境污染问题严重度的感知, 0代表不严重, 10代表非常严重
The perception of the severity of environmental pollution problems by the custodians of agricultural activities was used, with 0 representing not serious and 10 representing very serious.yu1  下载: 导出CSV
表 2 投入和产出指标的描述性统计结果
Table 2. Results of descriptive statistics for input and output indicators
指标
Index样本量
Sample size均值
Mean value标准差
Standard deviation最大值
Maximum value最小值
Minimum value资本 Capital 9735 11.0715 29.6284 0.0060 1000.0000 劳动力 Labor 9735 3.8680 1.8298 1.0000 21.0000 土地 Land 9735 0.8235 2.3192 0.0067 73.3333 农产品总产出 Total agricultural output 9735 16.4968 35.8345 0.0010 900.0000 主观污染感知度Subjective pollution perception degree 9735 6.5300 2.5024 1.0000 10.0000 COD等标排放量 COD equivalent emissions 9735 2.0374 2.1763 0.0087 9.4930 TN等标排放量 TN equivalent emissions 9735 38.5440 27.1381 1.4973 131.6150 TP等标排放量 TP equivalent emissions 9735 13.5534 10.0784 0.9760 58.9300 鉴于运用DEA方法进行估算之前, 需要先期对所选取的投入和产出指标二者之间的相关性进行统计性检验, 考察是否满足DEA方法中的“等张性”原则, 即要求农户层的农业绿色全要素生产率投入、产出指标是同时增加或者减少的(表3)。
下载: 导出CSV
表 3 投入和产出指标的相关性检验
Table 3. Correlation test of input and output indicators
指标
Index资本
Capital劳动力
Labor土地
Land农产品总产出
Total agricultural
output主观污染感知度
Subjective pollution
perception degreeCOD等标排放量
COD equivalent
emissionsTN等标排放量
TN equivalent
emissionsTP等标排放量
TP equivalent
emissions资本 Capital 1.0000 — — — — — — — 劳动力 Labor 0.0453*** 1.0000 — — — — — — 土地 Land 0.0512*** 0.0191* 1.0000 — — — — — 农产品总产出
Total agricultural output0.7714*** 0.0507*** 0.0324*** 1.0000 — — — — 主观污染感知度
Subjective pollution perception degree0.0421*** 0.0400*** 0.0378*** 0.0233** 1.0000 — — — COD等标排放量
COD equivalent emissions0.0473*** 0.0939*** 0.0568*** 0.0285*** 0.0435*** 1.0000 — — TN等标排放量
TN equivalent emissions0.0377*** 0.0875*** 0.0703*** 0.0193* 0.0161*** 0.3675*** 1.0000 — TP等标排放量
TP equivalent emissions0.0352*** 0.1113*** 0.0595*** 0.0415*** 0.0212*** 0.4296*** 0.8178*** 1.0000 ***、**、*分别表示在1%、5%、10%水平上的显著性, 数据来源于作者计算整理。***, **, * denote significance at the 1%, 5%, and 10% levels, the data were calculated and compiled by the authors.
下载: 导出CSV
表 4 2016年和2018年基于技术优化Malmquist-Luenberger指数的农业绿色全要素生产率及其分解项
Table 4. Agricultural Green total factor productivity and its decomposition term based on technology-optimized Malmquist-Luenberger index for 2016 and 2018
年份
Year排名
Rank农户代码
Farmer
code绿色全要素
生产率
ML(1)绿色技术
效率变化
MLTEC(1)绿色技术
进步变化
MLTC(1)农户代码
Farmer
codes绿色全要素
生产率
ML(2)绿色技术
效率变化
MLTEC(2)绿色技术
进步变化
MLTC(2)2016 前15名
Top 15440560 3.7512 1.9630 1.9109 500233 3.7620 1.9889 1.8915 350108 3.5632 1.9994 1.7821 510876 3.7029 1.9687 1.8809 441716 3.4232 1.9810 1.7281 440560 3.6210 1.9862 1.8231 510795 2.5510 1.5905 1.6039 441716 3.5514 1.9736 1.7994 330177 2.4194 1.9837 1.2197 500236 3.2982 1.9926 1.6552 360172 2.3063 1.7847 1.2923 510667 3.0436 1.9890 1.5302 441941 2.0632 1.5001 1.3754 500238 2.7742 1.6172 1.7154 510667 2.0528 1.9875 1.0329 510795 2.7659 1.5708 1.7608 320134 1.8947 1.7166 1.1037 510790 2.6306 1.7399 1.5120 130431 1.8898 1.5252 1.2390 500241 2.5685 1.6795 1.5294 620847 1.8680 1.6140 1.1573 620847 2.5500 1.9676 1.2960 140729 1.8670 1.5878 1.1758 441941 2.5474 1.6975 1.5007 441738 1.8566 1.2592 1.4744 621077 2.4891 1.9672 1.2653 330175 1.8561 1.6069 1.1551 500285 2.4136 1.7599 1.3714 441073 1.8424 1.4593 1.2625 220212 2.2019 1.8826 1.1696 后15名
Last 15450209 0.6130 0.5539 1.1067 500149 0.5028 0.5055 0.9947 510401 0.6072 0.5112 1.1877 621322 0.5008 0.6390 0.7837 621126 0.6049 0.5947 1.0172 620970 0.4994 0.5065 0.9861 500149 0.5968 0.5002 1.1931 210937 0.4868 0.5110 0.9527 440156 0.5893 0.6336 0.9301 211800 0.4843 0.5414 0.8946 440508 0.5823 0.6476 0.8992 120093 0.4748 0.6871 0.6910 620011 0.5526 0.5456 1.0128 621197 0.4733 0.6333 0.7474 610328 0.5458 0.5096 1.0709 621480 0.4485 0.5712 0.7853 210937 0.5419 0.5216 1.0388 610328 0.4414 0.5224 0.8451 683126 0.5378 0.5494 0.9788 621126 0.4385 0.5567 0.7876 211800 0.5197 0.5230 0.9937 621289 0.4197 0.5663 0.7412 621289 0.5197 0.5768 0.9010 140344 0.4081 0.5782 0.7058 530423 0.4893 0.6008 0.8144 620011 0.4053 0.5063 0.8007 140344 0.4551 0.5345 0.8514 350100 0.4025 0.7712 0.5219 140647 0.4346 0.5121 0.8486 621476 0.3775 0.5094 0.7410 平均 Average — 1.0099 1.0165 0.9928 — 1.0175 1.0294 0.9828 2018 前15名
Top 15441652 3.5980 1.9986 1.8002 510650 5.4701 1.9934 2.7441 510650 3.5806 1.9972 1.7928 441652 3.5961 1.9981 1.7998 140152 2.8038 1.9511 1.4370 440341 3.2432 1.8815 1.7237 370448 2.4048 1.9551 1.2300 140152 2.7156 1.8185 1.4933 530136 2.3989 1.9887 1.2062 530136 2.4714 1.9874 1.2435 440341 2.1583 1.7552 1.2297 621236 2.4492 1.9663 1.2456 210940 2.1467 1.7203 1.2479 370448 2.4075 1.9584 1.2293 140361 1.8543 1.6359 1.1335 620223 2.4038 1.9329 1.2436 550566 1.6099 1.5606 1.0316 621285 2.0741 1.7226 1.2041 621177 1.6086 1.2917 1.2454 621177 1.9621 1.4907 1.3162 441562 1.5932 1.3010 1.2246 210940 1.9401 1.3990 1.3868 410858 1.5904 1.3746 1.1570 621476 1.8889 1.6638 1.1353 130928 1.5341 1.3709 1.1191 621275 1.7729 1.5616 1.1353 370326 1.5237 1.2862 1.1846 550566 1.7526 1.6110 1.0879 620223 1.4896 1.5113 0.9856 620549 1.7439 1.4478 1.2046 后15名
Last 15530335 0.6427 0.5446 1.1801 140729 0.5781 0.5790 0.9984 530252 0.6312 0.5572 1.1328 520342 0.5767 0.6585 0.8758 620847 0.6312 0.6205 1.0172 210822 0.5730 0.5098 1.1240 320134 0.6239 0.5894 1.0586 500238 0.5722 0.6614 0.8651 450240 0.6221 0.5370 1.1584 500285 0.5625 0.5658 0.9942 450199 0.6198 0.6053 1.0240 360172 0.5311 0.5245 1.0126 620878 0.6143 0.6085 1.0097 621077 0.5205 0.5394 0.9650 441941 0.6026 0.5920 1.0179 500233 0.4526 0.5897 0.7676 620827 0.6016 0.5211 1.1544 500236 0.4447 0.5030 0.8841 360172 0.5269 0.5280 0.9978 620847 0.4243 0.5095 0.8329 510667 0.5207 0.5000 1.0412 510667 0.4193 0.5000 0.8386 441716 0.4873 0.5064 0.9622 440560 0.3103 0.5019 0.6183 330177 0.4764 0.5049 0.9436 441941 0.3021 0.5399 0.5596 510795 0.3445 0.5271 0.6535 510795 0.2993 0.5327 0.5617 440560 0.2393 0.5061 0.4728 441716 0.2663 0.5043 0.5281 平均 Average — 0.9960 0.9765 1.0200 — 0.9974 0.9713 1.0259 限于篇幅, 仅展示出农业绿色全要素生产率排名前15位、后15位农户和样本农户年度均值的结果。其中, ML (1)、MLTEC (1)、MLTC (1)分别表示使用虚拟户主主观污染感知度作为非期望产出的农业绿色全要素生产率、绿色技术效率变化、绿色技术进步变化;ML(2)、MLTEC(2)、MLTC(2)分别表示使用农业COD、TN、TP等标排放量等农业面源污染作为非期望产出的农业绿色全要素生产率、绿色技术效率变化、绿色技术进步变化。Due to the limitation of space, only the results of the top 15 farmers, the bottom 15 farmers and the annual average value of the sample farmers are shown. Among them, ML (1), MLTEC (1), and MLTC (1) denote agricultural green total factor productivity, green technical efficiency change, and green technological progress change using virtual household head subjective pollution perception as non-desired outputs; ML (2), MLTEC (2), and MLTC (2) denote agricultural green total factor productivity, green technical efficiency change, and green technical progress change in agriculture using agricultural surface source pollution such as agricultural COD, TN, and TP equivalents emissions as non-desired output.
下载: 导出CSV
表 5 农业绿色全要素生产率的区域差距及其来源
Table 5. Regional Gaps in Agricultural Green Total Factor Productivity in and their sources
年份
Year总体差距
Overall Gap区域内差距
Intra-regional Gap区域间差距
Inter-regional Gap超变密度
Super variable density贡献率 Contribution rate (%) 区域内差距
Intra-regional Gap区域间差距
Inter-regional Gap超变密度
Super variable density(1) 2016 0.0466 0.0159 0.0027 0.0280 34.12 5.79 60.09 2018 0.0362 0.0124 0.0002 0.0236 34.25 0.55 65.19 (2) 2016 0.0780 0.0274 0.0041 0.0465 35.13 5.26 59.62 2018 0.0496 0.0174 0.0014 0.0308 35.08 2.82 62.10 (1)、(2)分别表示使用虚拟户主主观污染感知度作为非期望产出、使用农业COD、TN、TP等标排放量等客观农业面源污染作为非期望产出。(1) and (2) denote the use of virtual household subjective pollution perceptions as non-desired output and objective agricultural surface source pollution such as agricultural COD, TN, TP emissions as non-desired output.
下载: 导出CSV
表 6 东、中、西部农业绿色全要素生产率的区域内差距和区域间差距
Table 6. Intra-regional and inter-regional disparities in green total factor productivity in agriculture in East, Central and West
年份 Year 区域内差距 Intra-regional Gap 区域间差距 Inter-regional Gap 东 East 中 Central 西 West 东—中 East-Central 东—西 East-West 中—西 West-Central (1) 2016 0.0551 0.0357 0.0477 0.0457 0.0515 0.0419 2018 0.0398 0.0295 0.0382 0.0348 0.0390 0.0340 (2) 2016 0.0520 0.0450 0.0499 0.0537 0.0852 0.0857 2018 0.0403 0.0348 0.0358 0.0377 0.0544 0.0515 (1)、(2)分别表示使用虚拟户主主观污染感知度作为非期望产出、使用农业COD、TN、TP等标排放量等客观农业面源污染作为非期望产出。(1) and (2) denote the use of virtual household subjective pollution perceptions as non-desired output and objective agricultural surface source pollution such as agricultural COD, TN, TP emissions as non-desired output.
下载: 导出CSV
-
[1] 王建宏, 张文攀. 加快建设乡村全面振兴样板区——访宁夏回族自治区党委副书记陈雍代表[N]. 光明日报, 2022-10-22WANG J H, ZHANG W P. Accelerating the construction of a model area for the comprehensive revitalization of the countryside: Interview with Yong Chen, Deputy Secretary of the Party Committee of Ningxia Hui Autonomous Region[N]. Guangming Daily, 2022-10-22 [2] 冯欣, 姜文来, 刘洋, 等. 绿色发展背景下农业水价综合改革研究[J]. 中国农业资源与区划, 2020, 41(10): 25−31FENG X, JIANG W L, LIU Y, et al. Research on comprehensive reform of agricultural water price under the background of green development[J]. Chinese Journal of Agricultural Resources and Regional Planning, 2020, 41(10): 25−31 [3] 程永生, 张德元, 赵梦婵. 黄河流域生态保护和高质量发展的时空演变与驱动因素[J]. 经济体制改革, 2021(5): 61−69CHENG Y S, ZHANG D Y, ZHAO M C. Spatial-temporal evolution and driving factors of ecological protection and high-quality development in the Yellow River Basin[J]. Reform of Economic System, 2021(5): 61−69 [4] 李政大, 赵雅婷, 袁晓玲. 基于公众参与的中国绿色共治实现路径研究[J]. 现代财经(天津财经大学学报), 2021, 41(6): 98−113LI Z D, ZHAO Y T, YUAN X L. Research on the path of China’s Green Co-governance based on public participation[J]. Modern Finance and Economics-Journal of Tianjin University of Finance and Economics, 2021, 41(6): 98−113 [5] 谭日辉, 刘慧敏. 中国农业绿色全要素生产率空间关联网络特征演化及影响因素[J/OL]. 中国生态农业学报(中英文), https://.kns.cnki.net/kcms/detail/13.142.s.20220729.1402.002.htmlTAN R H, LIU H M. Characteristic evolution of agricultural green total factor productivity spatial correlation network in China and the influencing factors[J]. Chinese Journal of Eco-Agriculture, 2022,DOI: 10.12357/cjea.20220339. [6] 李翔, 杨柳. 华东地区农业全要素生产率增长的实证分析−基于随机前沿生产函数模型[J]. 华中农业大学学报(社会科学版), 2018(6): 62−68,154LI X, YANG L. An empirical analysis of agriculture total factor productivity growth in East China—based on stochastic frontier production function model[J]. Journal of Huazhong Agricultural University (Social Sciences Edition), 2018(6): 62−68,154 [7] 黄祖辉, 扶玉枝, 徐旭初. 农民专业合作社的效率及其影响因素分析[J]. 中国农村经济, 2011(7): 4−13,62HUANG Z H, FU Y Z, XU X C. Analysis of the efficiency of farmers’ professional cooperatives and its influencing factors[J]. Chinese Rural Economy, 2011(7): 4−13,62 [8] EMROUZNEJAD A, YANG G L. A survey and analysis of the first 40 years of scholarly literature in DEA: 1978-2016[J]. Socio-Economic Planning Sciences, 2018, 61: 4−8 doi: 10.1016/j.seps.2017.01.008 [9] 程永生, 张德元, 赵梦婵, 等. 人力资本视角下雾霾污染对长江经济带绿色高质量发展的影响研究[J]. 重庆大学学报(社会科学版), 2022, 28(5): 46−60CHENG Y S, ZHANG D Y, ZHAO M C, et al. Research on the impact of haze pollution on the high-quality development of the Yangtze River Economic Belt from the perspective of human capital[J]. Journal of Chongqing University(Social Science Edition), 2022, 28(5): 46−60 [10] APARICIO J, BARBERO J, KAPELKO M, et al. Testing the consistency and feasibility of the standard Malmquist-Luenberger index: environmental productivity in world air emissions[J]. Journal of Environmental Management, 2017, 196: 148−160 [11] 潘丹. 考虑资源环境因素的中国农业生产率研究[D]. 南京: 南京农业大学, 2012PAN D. Study on China agricultural productivity incorporating water resource and agricultural non-point source pollution factors[D]. Nanjing: Nanjing Agricultural University, 2012 [12] 程永生. 农业社会化服务对于绿色全要素生产率的影响研究——基于农户要素禀赋的视角[D]. 合肥: 安徽大学, 2022CHENG Y S. Research on the Influence of Agricultural Socialization Service on Green Total Factor Productivity: Based on the perspective of farmer household’s factor endowments[D]. Hefei: Anhui University, 2022 [13] 康亚文, 彭博, 赵浚夷, 等. 基于Meta分析的中国农业全要素生产率研究[J]. 中国农业资源与区划, 2022, 43(2): 67−80KANG Y W, PENG B, ZHAO J Y, et al. Study on the China's agricultural total factor productivity estimations based on meta-analysis[J]. Chinese Journal of Agricultural Resources and Regional Planning, 2022, 43(2): 67−80 [14] 王璐, 杨汝岱, 吴比. 中国农户农业生产全要素生产率研究[J]. 管理世界, 2020, 36(12): 77−93 doi: 10.3969/j.issn.1002-5502.2020.12.008WANG L, YANG R D, WU B. A study on total factor productivity of agricultural production of rural households in China[J]. Management World, 2020, 36(12): 77−93 doi: 10.3969/j.issn.1002-5502.2020.12.008 [15] 李谷成, 冯中朝, 范丽霞. 小农户真的更加具有效率吗? 来自湖北省的经验证据[J]. 经济学(季刊), 2010, 9(1): 95−124LI G C, FENG G, FAN L X. Is the small-sized rural household more efficient? the empirical evidence from Hubei Province[J]. China Economic Quarterly, 2010, 9(1): 95−124 [16] 黄书苑, 马丁丑. 西北地区家庭林业全要素生产率测算及收敛性分析−基于陕甘两省7年的1000个固定样本[J]. 干旱区资源与环境, 2021, 35(2): 21−27 doi: 10.13448/j.cnki.jalre.2021.034HUANG S Y, MA D C. Measurement and convergence analysis of total factor productivity of family forestry in Northwest China[J]. Journal of Arid Land Resources and Environment, 2021, 35(2): 21−27 doi: 10.13448/j.cnki.jalre.2021.034 [17] Xie Y. The User’s Guide of the China Family Panal Studied[M]. Beijing: Institute of Scocial Science Survey, Peking University, 2012 [18] 周应恒, 杨宗之. 生态价值视角下中国省域粮食绿色全要素生产率时空特征分析[J]. 中国生态农业学报(中英文), 2021, 29(10): 1786−1799ZHOU Y H, YANG Z Z. Temporal and spatial characteristics of China’s provincial green total factor productivity of grains from the ecological value perspective[J]. Chinese Journal of Eco-Agriculture, 2021, 29(10): 1786−1799 [19] 程永生, 张德元, 汪侠. 农业社会化服务的绿色发展效应: 基于农户视角[J]. 资源科学, 2022, 44(9): 1848−1864 doi: 10.18402/resci.2022.09.09CHENG Y S, ZHANG D Y, WANG X. Green development effect of agricultural socialized services: An analysis based on farming households’ perspective[J]. Resources Science, 2022, 44(9): 1848−1864 doi: 10.18402/resci.2022.09.09 [20] MATHENGE M, SMALE M, TSCHIRLEY D. Off farm employment and input intensification among smallholder maize farmers in Kenya[J]. Journal of Agricultural Economics, 2015, 66: 519−536 doi: 10.1111/1477-9552.12093 [21] 白南生, 李靖, 陈晨. 子女外出务工、转移收入与农村老人农业劳动供给−基于安徽省劳动力输出集中地三个村的研究[J]. 中国农村经济, 2007(10): 48−54BAI N S, LI J, CHEN C. Children’s work outside the home, transfer income and agricultural labor supply of rural elders: a study based on three villages in Anhui Province where labor export is concentrated[J]. Chinese Rural Economy, 2007(10): 48−54 [22] 刘敏. 农机投入对农业绿色全要素生产率的影响及门槛效应研究[D]. 长春: 吉林农业大学, 2020LIU M. Study on the influence and threshold effect of farm machinery input on green total factor productivity of agriculture[D]. Changchun: Jilin Agricultural University, 2020 [23] 王云凤. 技术异质性视角下中国农业效率综合评价研究[D]. 天津: 天津商业大学, 2022WANG Y F. Research on comprehensive evaluation of agricultural efficiency in China under the view of technological heterogeneity[D]. Tianjin: Tianjin University of Commerce, 2022 [24] 钱龙. 非农就业、农地流转与农户农业生产变化[D]. 杭州: 浙江大学, 2017QIAN L. Off-farm employment, land transfer and changes in agricultural production[D]. Hangzhou: Zhejiang University, 2017 [25] 张景娜, 张雪凯. 互联网使用对农地转出决策的影响及机制研究−来自CFPS的微观证据[J]. 中国农村经济, 2020(3): 57−77ZHANG J N, ZHANG X K. The impact of Internet use on the decision-making of farmland transfer and its mechanism: evidence from the CFPS data[J]. Chinese Rural Economy, 2020(3): 57−77 [26] 杨芳. 社会网络对农户生产决策的影响研究[D]. 重庆: 西南大学, 2019YANG F. Research on the impact of social network on the production decision of rural household[D]. Chongqing: Southwest University, 2019 [27] 王越晗, 黄雨露, 夏煜, 等. 基于文献计量和可视化分析的中国水生态环境治理研究热点与趋势[J]. 长江科学院院报, 2022, 39(9): 137−143 doi: 10.11988/ckyyb.20220218WANG Y H, HUANG Y L, XIA Y, et al. Research hotspots and trends of water Eco-environmental governance in China based on Bibliometric and Visual analysis[J]. Journal of Yangtze River Scientific Research Institute, 2022, 39(9): 137−143 doi: 10.11988/ckyyb.20220218 [28] 常明. 农户兼业行为影响灌溉效率吗?−基于CFPS的微观证据[J]. 农林经济管理学报, 2020, 19(6): 681−689CHANG M. Can farmers’ concurrent business behavior affect irrigation efficiency? A study based on microscopic evidence from CFPS[J]. Journal of Agro-Forestry Economics and Management, 2020, 19(6): 681−689 [29] 吴国松, 姚升. 要素市场扭曲下农业绿色全要素生产率测度及效应研究[J]. 生态经济, 2021, 37(1): 96−102,115WU G S, YAO S. Measurement and effect of agricultural green TFP under factor market distortion[J]. Ecological Economy, 2021, 37(1): 96−102,115 [30] 赖斯芸, 杜鹏飞, 陈吉宁. 基于单元分析的非点源污染调查评估方法[J]. 清华大学学报(自然科学版), 2004, 9(9): 1184−1187 doi: 10.3321/j.issn:1000-0054.2004.09.009LAI S Y, DU P F, CHEN J N. Evaluation of non-point source pollution based on unit analysis[J]. Journal of Tsinghua University(Science and Technology), 2004, 9(9): 1184−1187 doi: 10.3321/j.issn:1000-0054.2004.09.009 [31] CHENG Y S, ZHANG D Y. Spatial and Temporal Differentiation Trends and Attributions of High-Quality Development in the Huaihe Eco-economic Belt[J]. Journal of Resources and Ecology, 2023, 14(2): 155−169 -

 下载:
下载:

 点击查看大图

计量
- 文章访问数: 89
- HTML全文浏览量: 42
- PDF下载量: 9
- 被引次数: 0
