

Evaluation of the effect of future climatic change on Hebei cotton production and water consumption using multiple GCMs
-
摘要: 气候模式是气候变化影响评估中不确定性的主要来源, 前人的研究多采用单个或较少的气候模式进行评估, 采用多种气候模式进行驱动可以降低由于气候模式的选择带来的误差。本研究在两年大田试验的基础上对作物模型APSIM-COTTON进行了精细的校验, 并选择22个GCMs(Global Climate Models)模式驱动作物模型评估了气候变化对河北棉花生产和耗水的影响。结果显示, 在所有气候情景下, 未来所有时间段, 播期提前, 各个发育时期(出苗、现蕾、吐絮、成熟)都较基准期缩短, 例如收获期在2090s 年代的SSP1-2.6、SSP2-4.5、SSP3-7.0和SSP5-8.5情景下分别提前15.3d、21.0 d、30.3 d和35.2 d。年内总蒸散量在多数情景下呈总的增加的趋势, 在SSP5-8.5情景下2030s、2050s、2070s和2090s分别增加6.5 mm、7.8 mm、14.3 mm和32.7 mm , 而灌水量减少25.7 mm、23.8 mm、30.5 mm和29.0 mm。棉花产量在未来则表现出在低辐射强迫下不同年代差异不大, 而在高辐射胁迫强迫下随着年代增加而降低的趋势。在SSP1-2.6、SSP2-4.5、SSP3-7.0和SSP5-8.5情景下2090s皮棉产量相比基准期分别减少61.5 kg∙hm−2、46.6 kg∙hm−2、407.1 kg∙hm−2和432.5 kg∙hm−2。棉花生产和耗水对未来气候变化的响应是气候要素CO2浓度、太阳辐射强度、温度、降雨等综合作用的结果, 本研究模拟结果为未来农业措施的响应提供理论支撑。Abstract: Climatic model is the main source of uncertainty in climate change impact assessment. It can soundly decrease the uncertainty by using multiple climate models during assessment. In this study, the crop model APSIM-COTTON was carefully calibrated on the basis of two years of field experiments, and 22 GCM models (AR6) were used to driven crop models to evaluate the effects of climate change on cotton production and water consumption in Hebei Province. As the main growth indicators, leaf area index, plant height, square number, boll number and dry matter weight of each plant organ, were used to correct the variety parameters of APSIM-COTTON. The coefficient of determination was above 0.8 indicated the simulated and observed values were well fitted. The trend of climate change in this site was that the solar radiation intensity under SSP1-2.6, SSP2-4.5 and SSP5-8.5 was higher than the baseline and increased with the time, but it was lower than the baseline under SSP3-7.0; temperature tended to increase in all scenarios, and the amplitude increase with the increase of radiative forcing and time, the minimum temperature increased more than the maximum temperature; Annual rainfall increased over time in most scenarios. The response of cotton production and water consumption to future climate change was the comprehensive effect of CO2 concentration, solar radiation, temperature, rainfall and other climatic factors. The crop model simulation results showed that under all climate scenarios and all time periods in the future, the sowing date was advanced, and all development stages (emergence, squaring, flowering, and harvesting) were shorter than that the baseline period. In the 2090s, under the scenarios of SSP1-2.6, SSP2-4.5, SSP3-7.0 and SSP5-8.5, the boll opening stage advanced 9.3 d, 12.0 d, 14.7 d and 16.0 d, respectively, while the harvest stage advanced 15.3 d, 21.0 d, 30.3 d and 35.2 d, respectively. The total ET in the year under all scenarios except SSP3-7.0 showed an increasing trend while the irrigation amount decreased. Under the SSP5-8.5 scenario, the annual ET in 2030s, 2050s, 2070s and 2090s increased by 6.5 mm, 7.8 mm, 14.3 mm and 32.7 mm compared with the baseline, respectively, while the irrigation amount decreased by 25.7 mm, 23.8 mm, 30.5 mm and 29.0 mm, respectively. In the future, the changes of cotton yield were not large in the scenarios of lower radiation focing and there was a decreasing trend with ages under high radiation forcing. Under the scenarios of SSP1-2.6 and SSP2-4.5, lint yield decreased about 61.5 kg∙hm−2 and 46.6 kg∙hm−2 in the 2090s. However, under the scenarios of SSP3-7.0 and SSP5-8.5, the reduction by 2090s reached 407.1 kg∙hm−2 and 432.5 kg∙hm−2. In this study, 22 GCM models were used to simulate the response of cotton growth and water consumption to climate change over 100 years in the 21st century, and the changing trends in different scenarios and different time periods were compared, which was expected to provide technical support for making adaption strategy to the climatic change. However, the uncertainty of evaluation the climatic effect on cotton production still exists in this study, and more site data should be considered in the calibration process and more crop simulation models with different mechanism should be compared in the evaluation in the future research.
-
Key words:
- Cotton /
- Climatic change /
- GCM /
- APSIM-COTTON /
- Yield /
- Water consumption /
- Hebei cotton production region
-

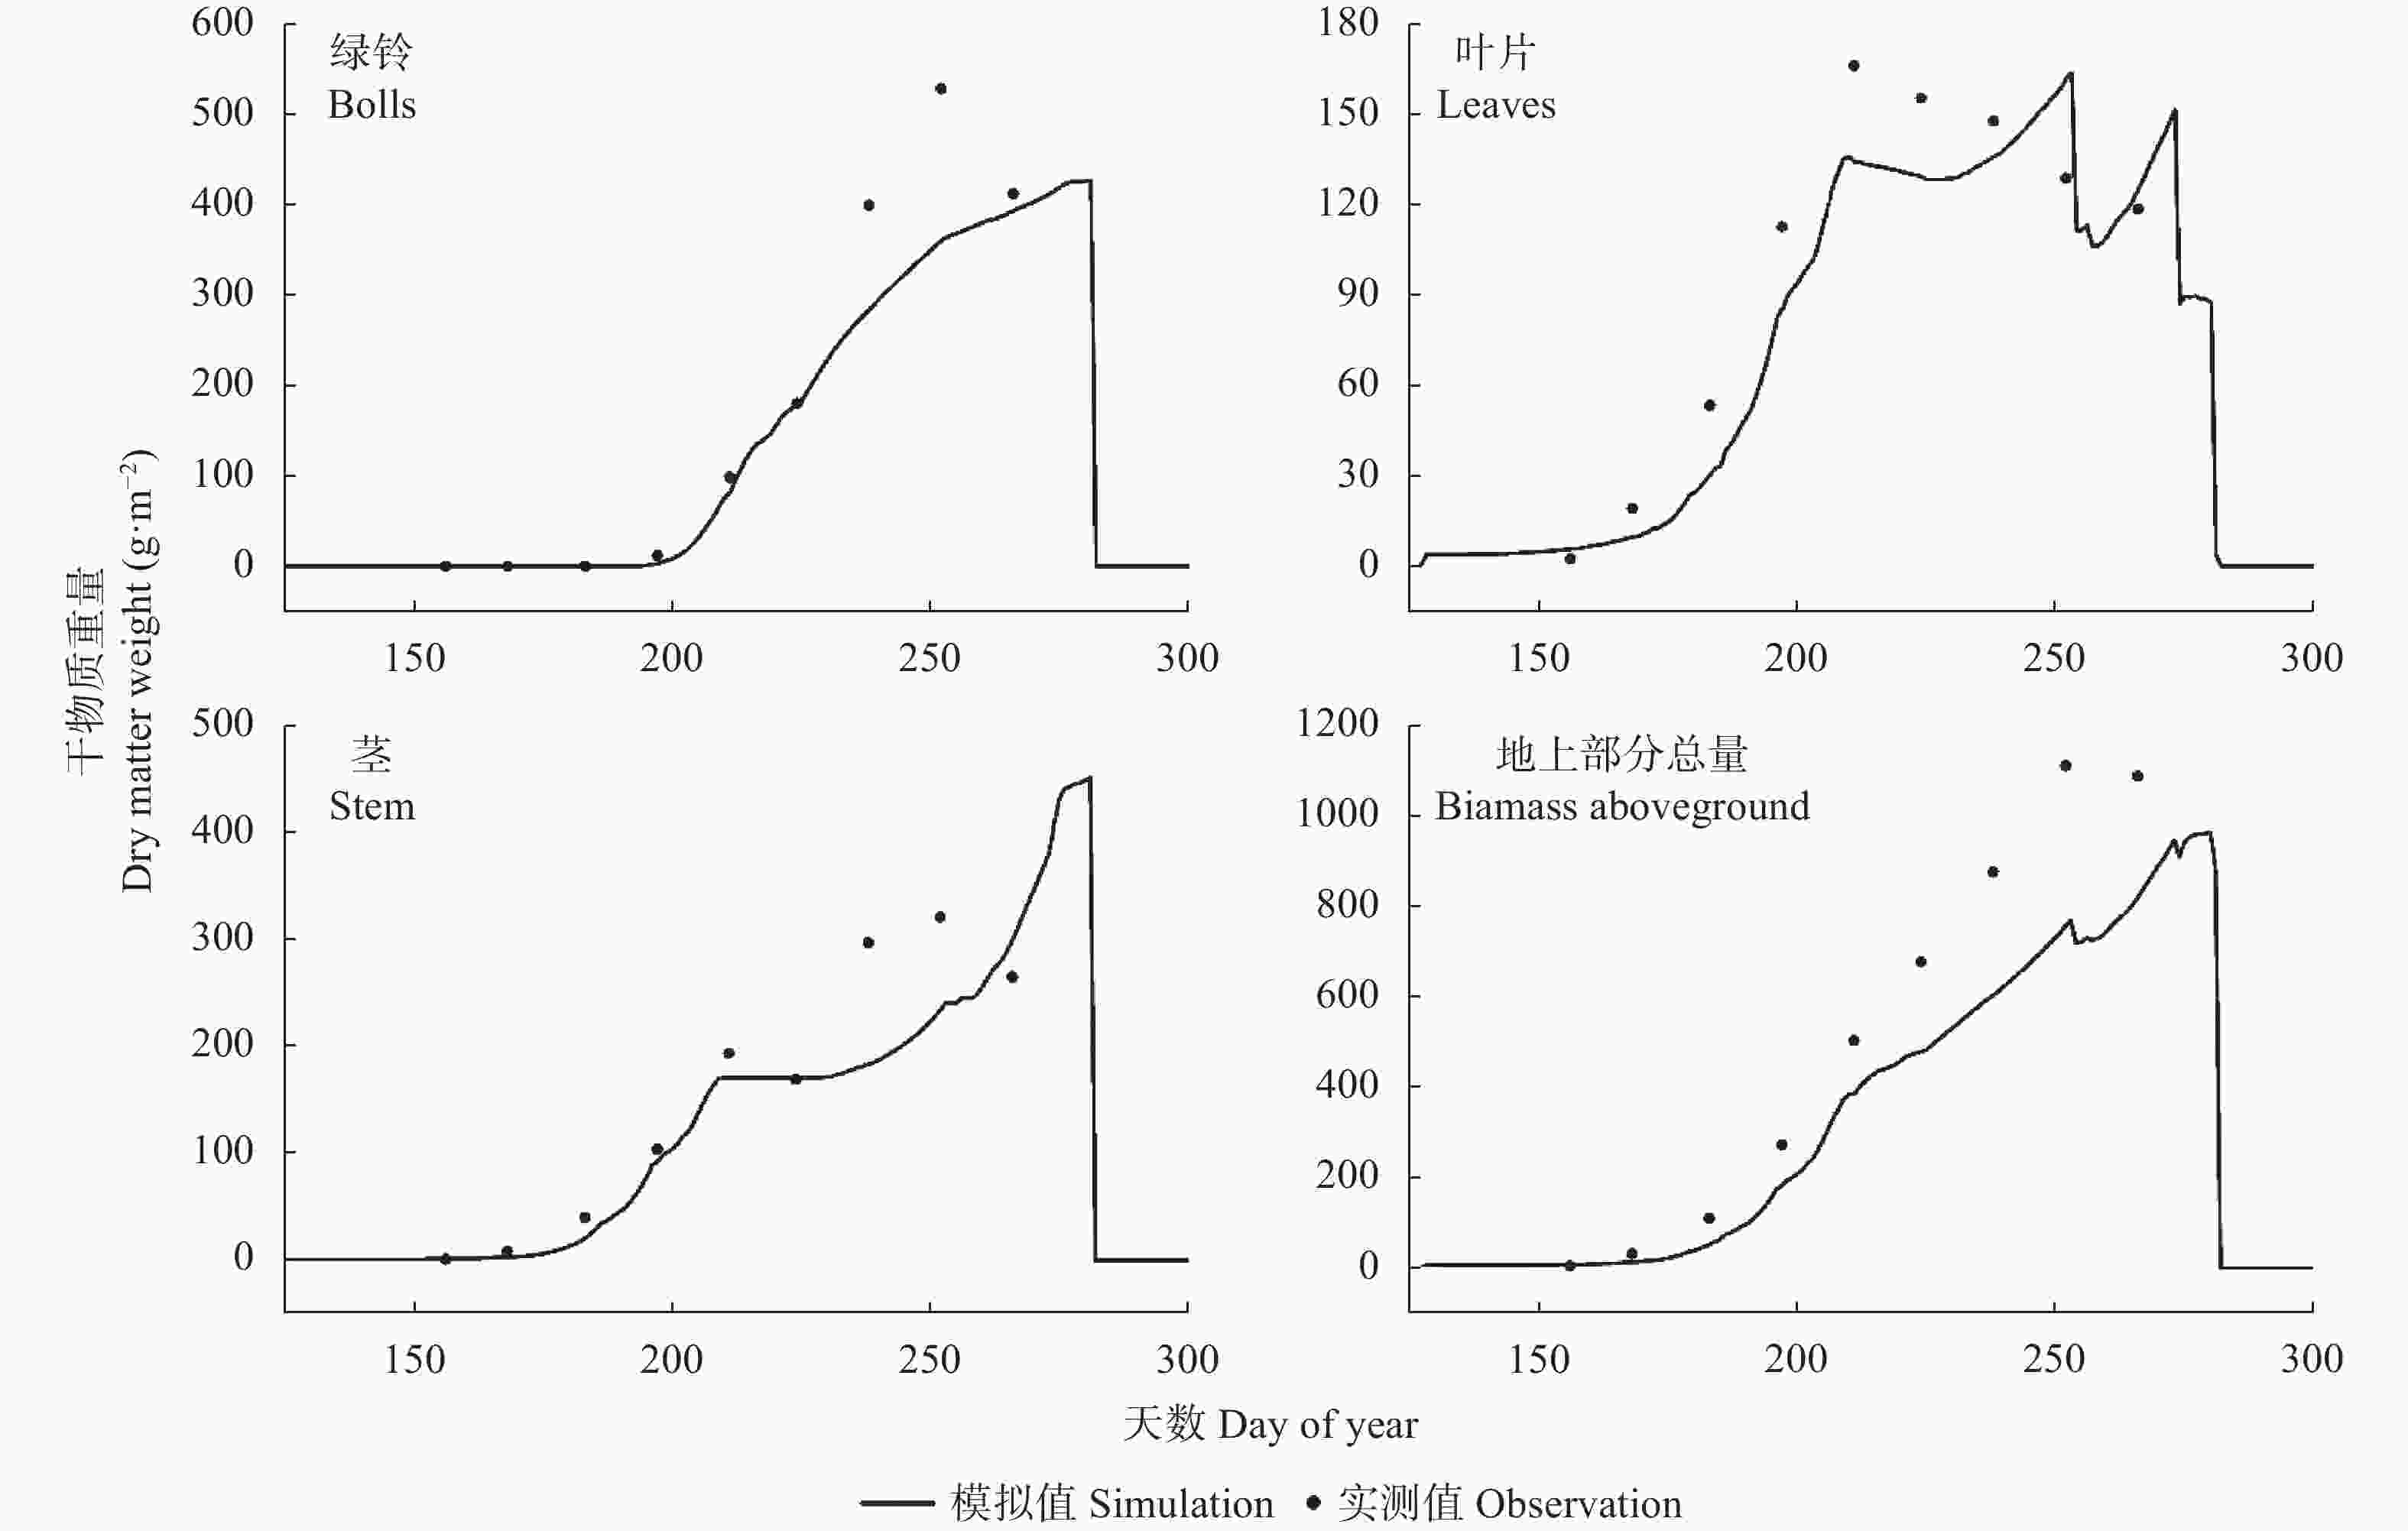
图 1 ‘中植棉2号’棉花干物质量模拟结果的验证
Figure 1. Verification of simulated dry matter of cotton cultivar ‘Zhongzhimian 2’ with results of field experiment
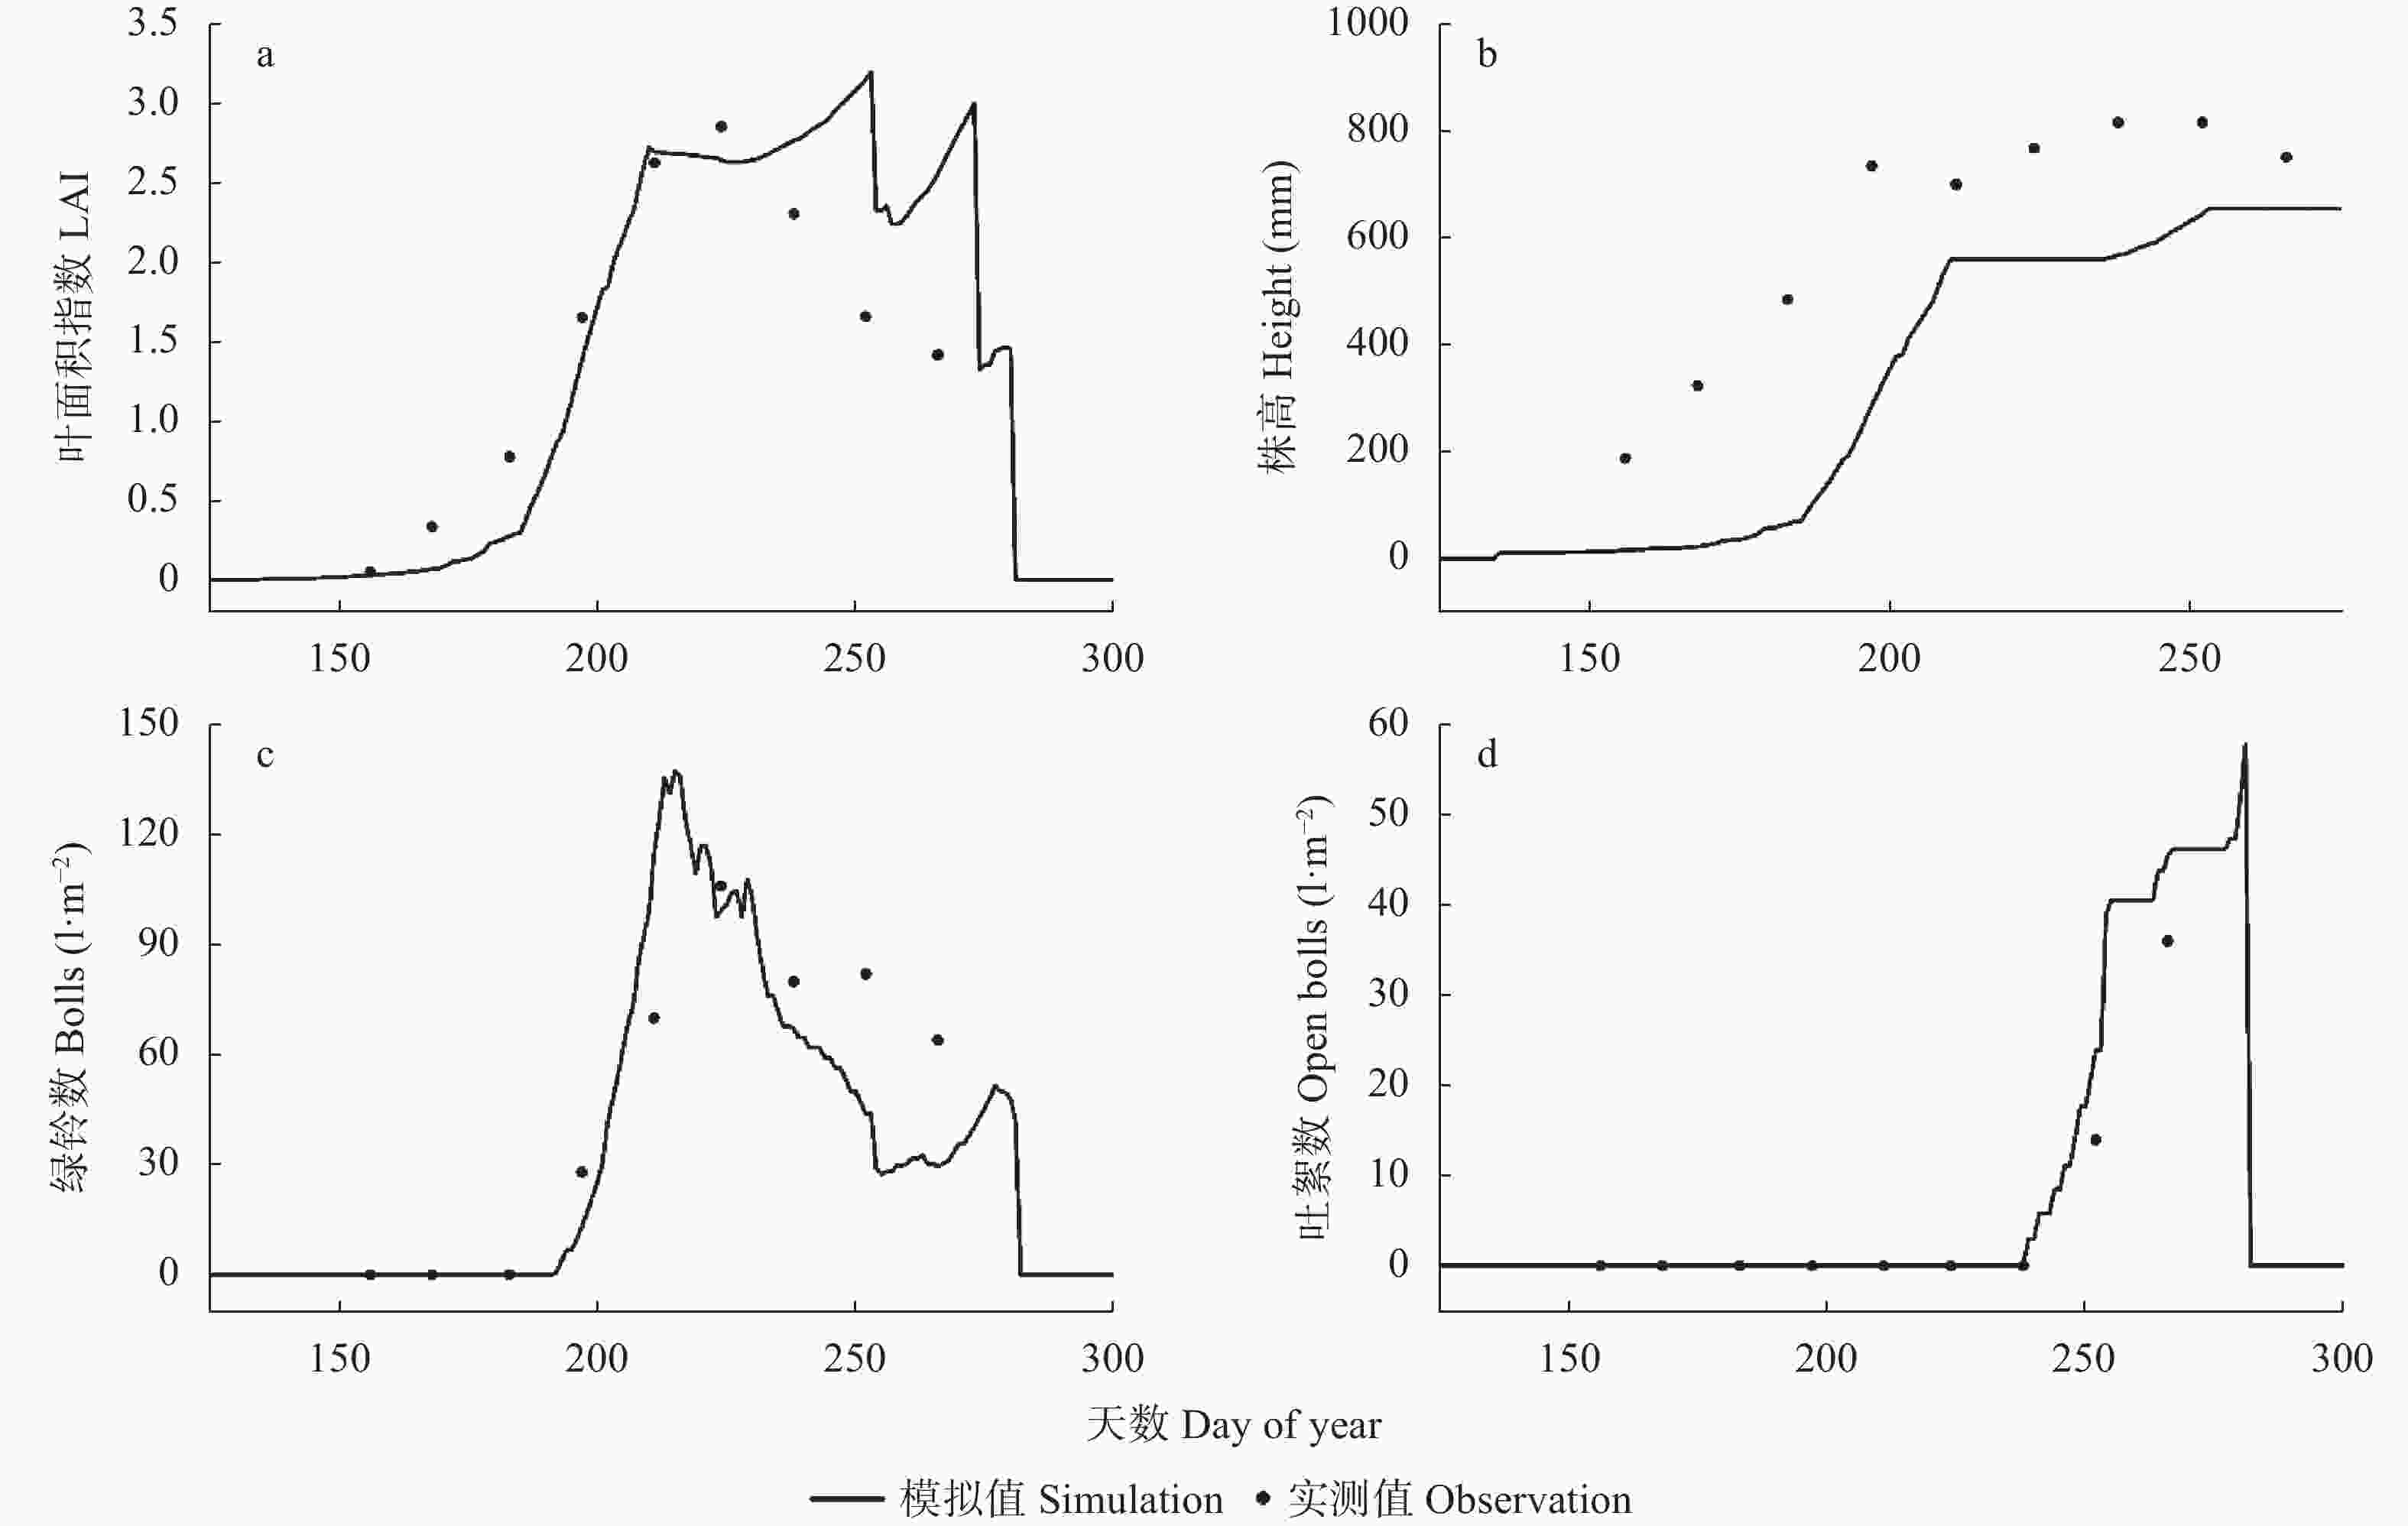
图 2 ‘中植棉2号’棉花叶面积指数(LAI)、株高、蕾数和吐絮数的验证结果
Figure 2. Verification results of leaf area index (LAI), plant height, squares number and open bolls number of cotton cultivar ‘Zhongzhimian 2’ with results of field experiment
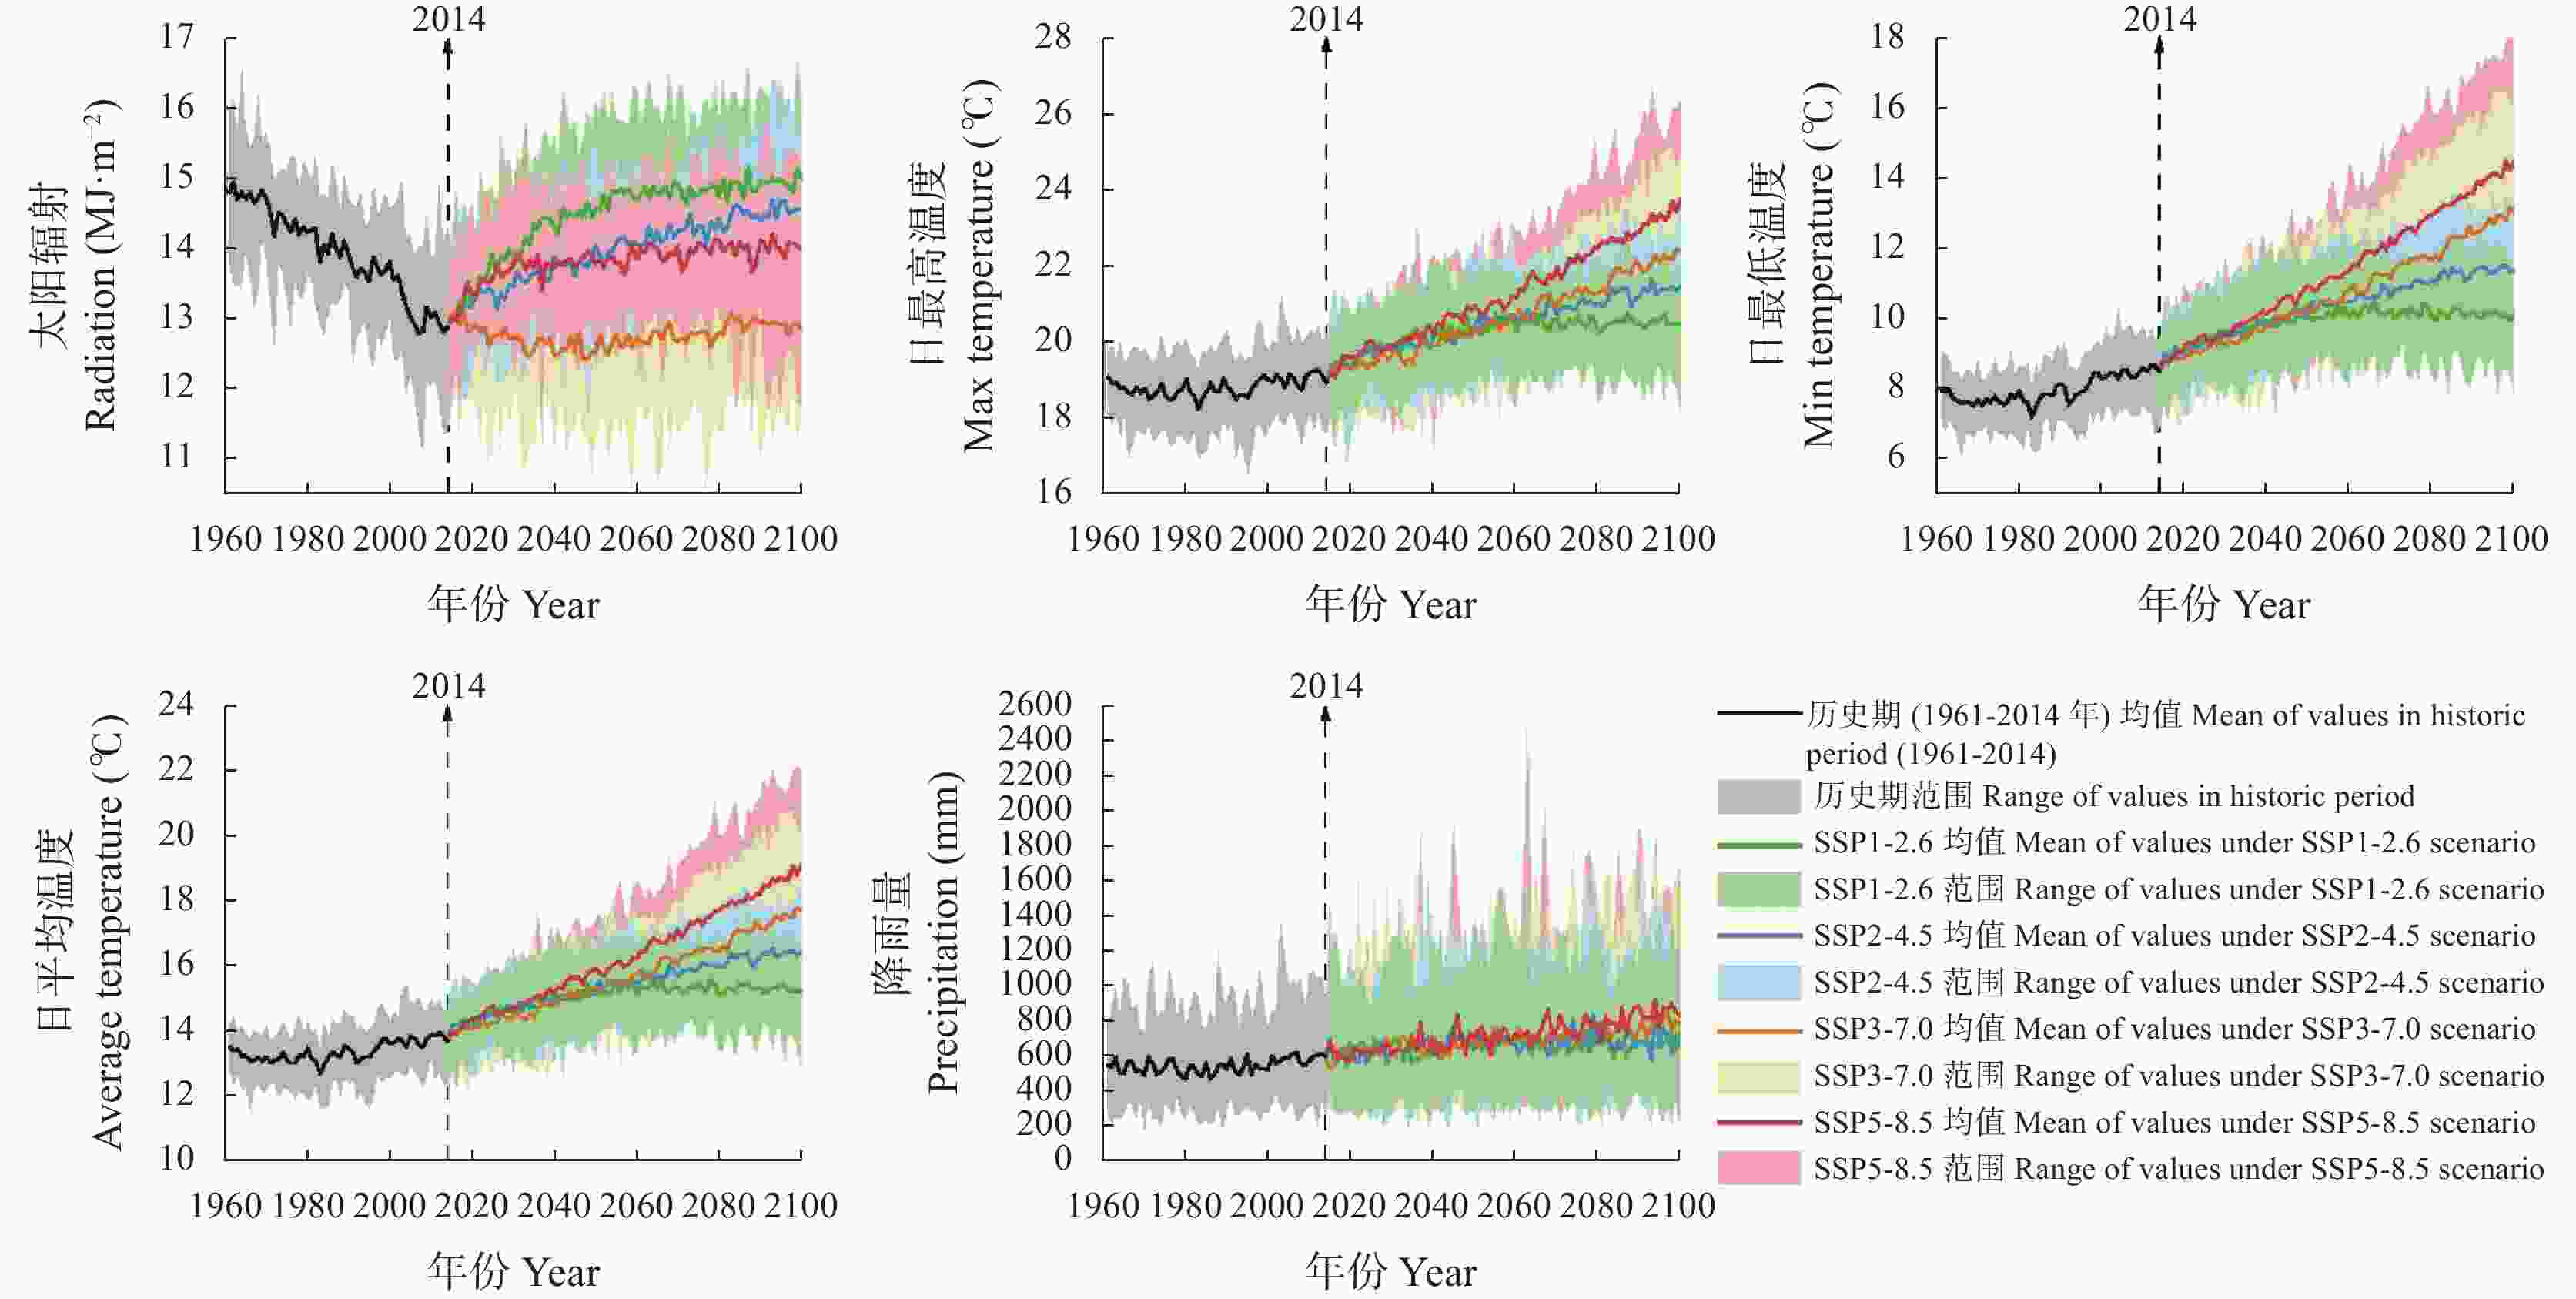
图 3 SSP1-2.6、SSP2-4.5、SSP3-7.0和SSP5-8.5气候情景下各气候指标变化趋势
Figure 3. Annual change trend of climate indexes at Baoding Station under SSP1-2.6, SSP2-4.5, SSP3-7.0 and SSP5-8.5 climate scenarios
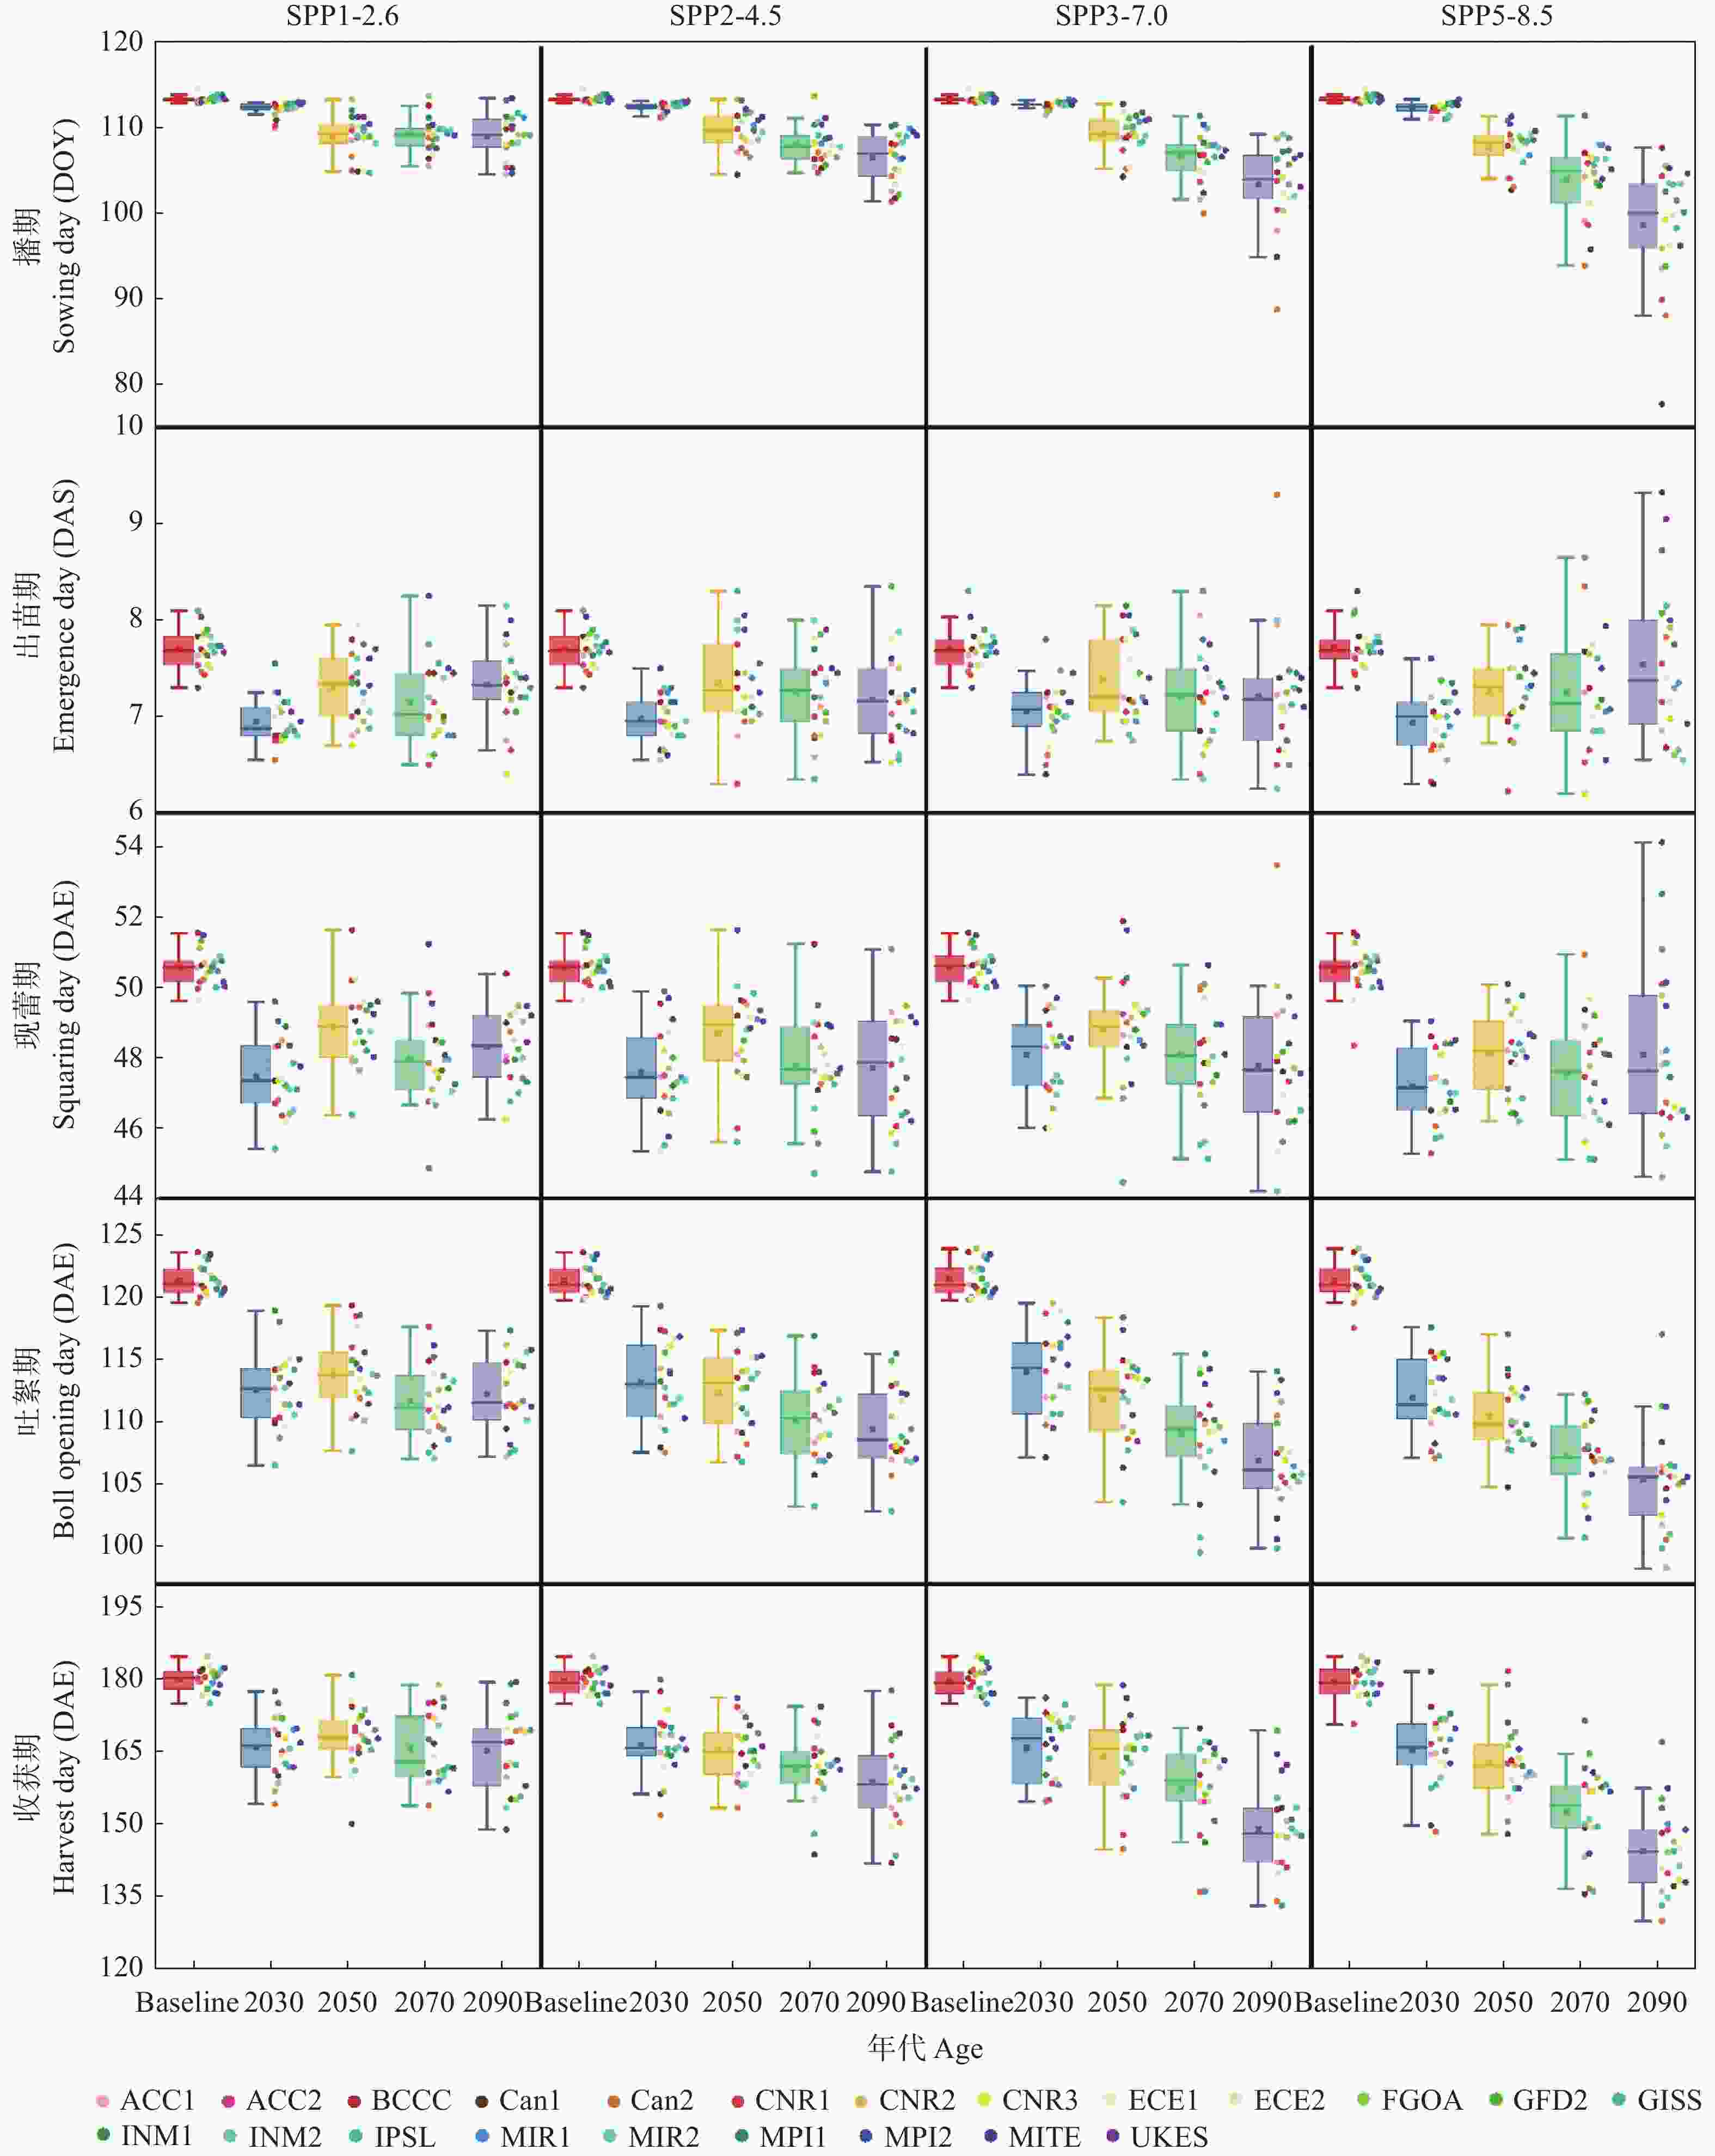
图 4 SSP1-2.6、SSP2-4.5、SSP3-7.0和SSP5-8.5气候情景下22种GCMs模拟的棉花物候期变化预测
在箱型图里, 箱体为25%~75%的范围, 箱体内横线为中位线, 方形表示平均值, 上下两须线是1.5倍IQR(四分位间距)内的范围, 图中为左箱体、右数据的分布类型。Y轴题中,DOY是年内天数 (Day of year)的简写, DAS是播种后天数 (Day after sowing day)的简写, DAE是出苗后天数(Day after emergence day)的简写。In the box plots, the box is 25%~75% of the range, the horizontal line is the median line, the square represents the average value, the upper and lower two muster lines are within the range of 1.5IQR (Interquartile Quartile Range), and the point beyond the muster line is the abnormal value. The figure shows the distribution type of the left box body and the right data. In the Y-axis title, DOY is the abbreviation of Day of year, DAS is the abbreviation of Day after seeding day and DAE is the abbreviation of Day after emergence day.
Figure 4. Prediction of cotton phenology change simulated by 22 GCMs under SSP1-2.6, SSP2-4.5, SSP3-7.0 and SSP5-8.5 climate scenarios
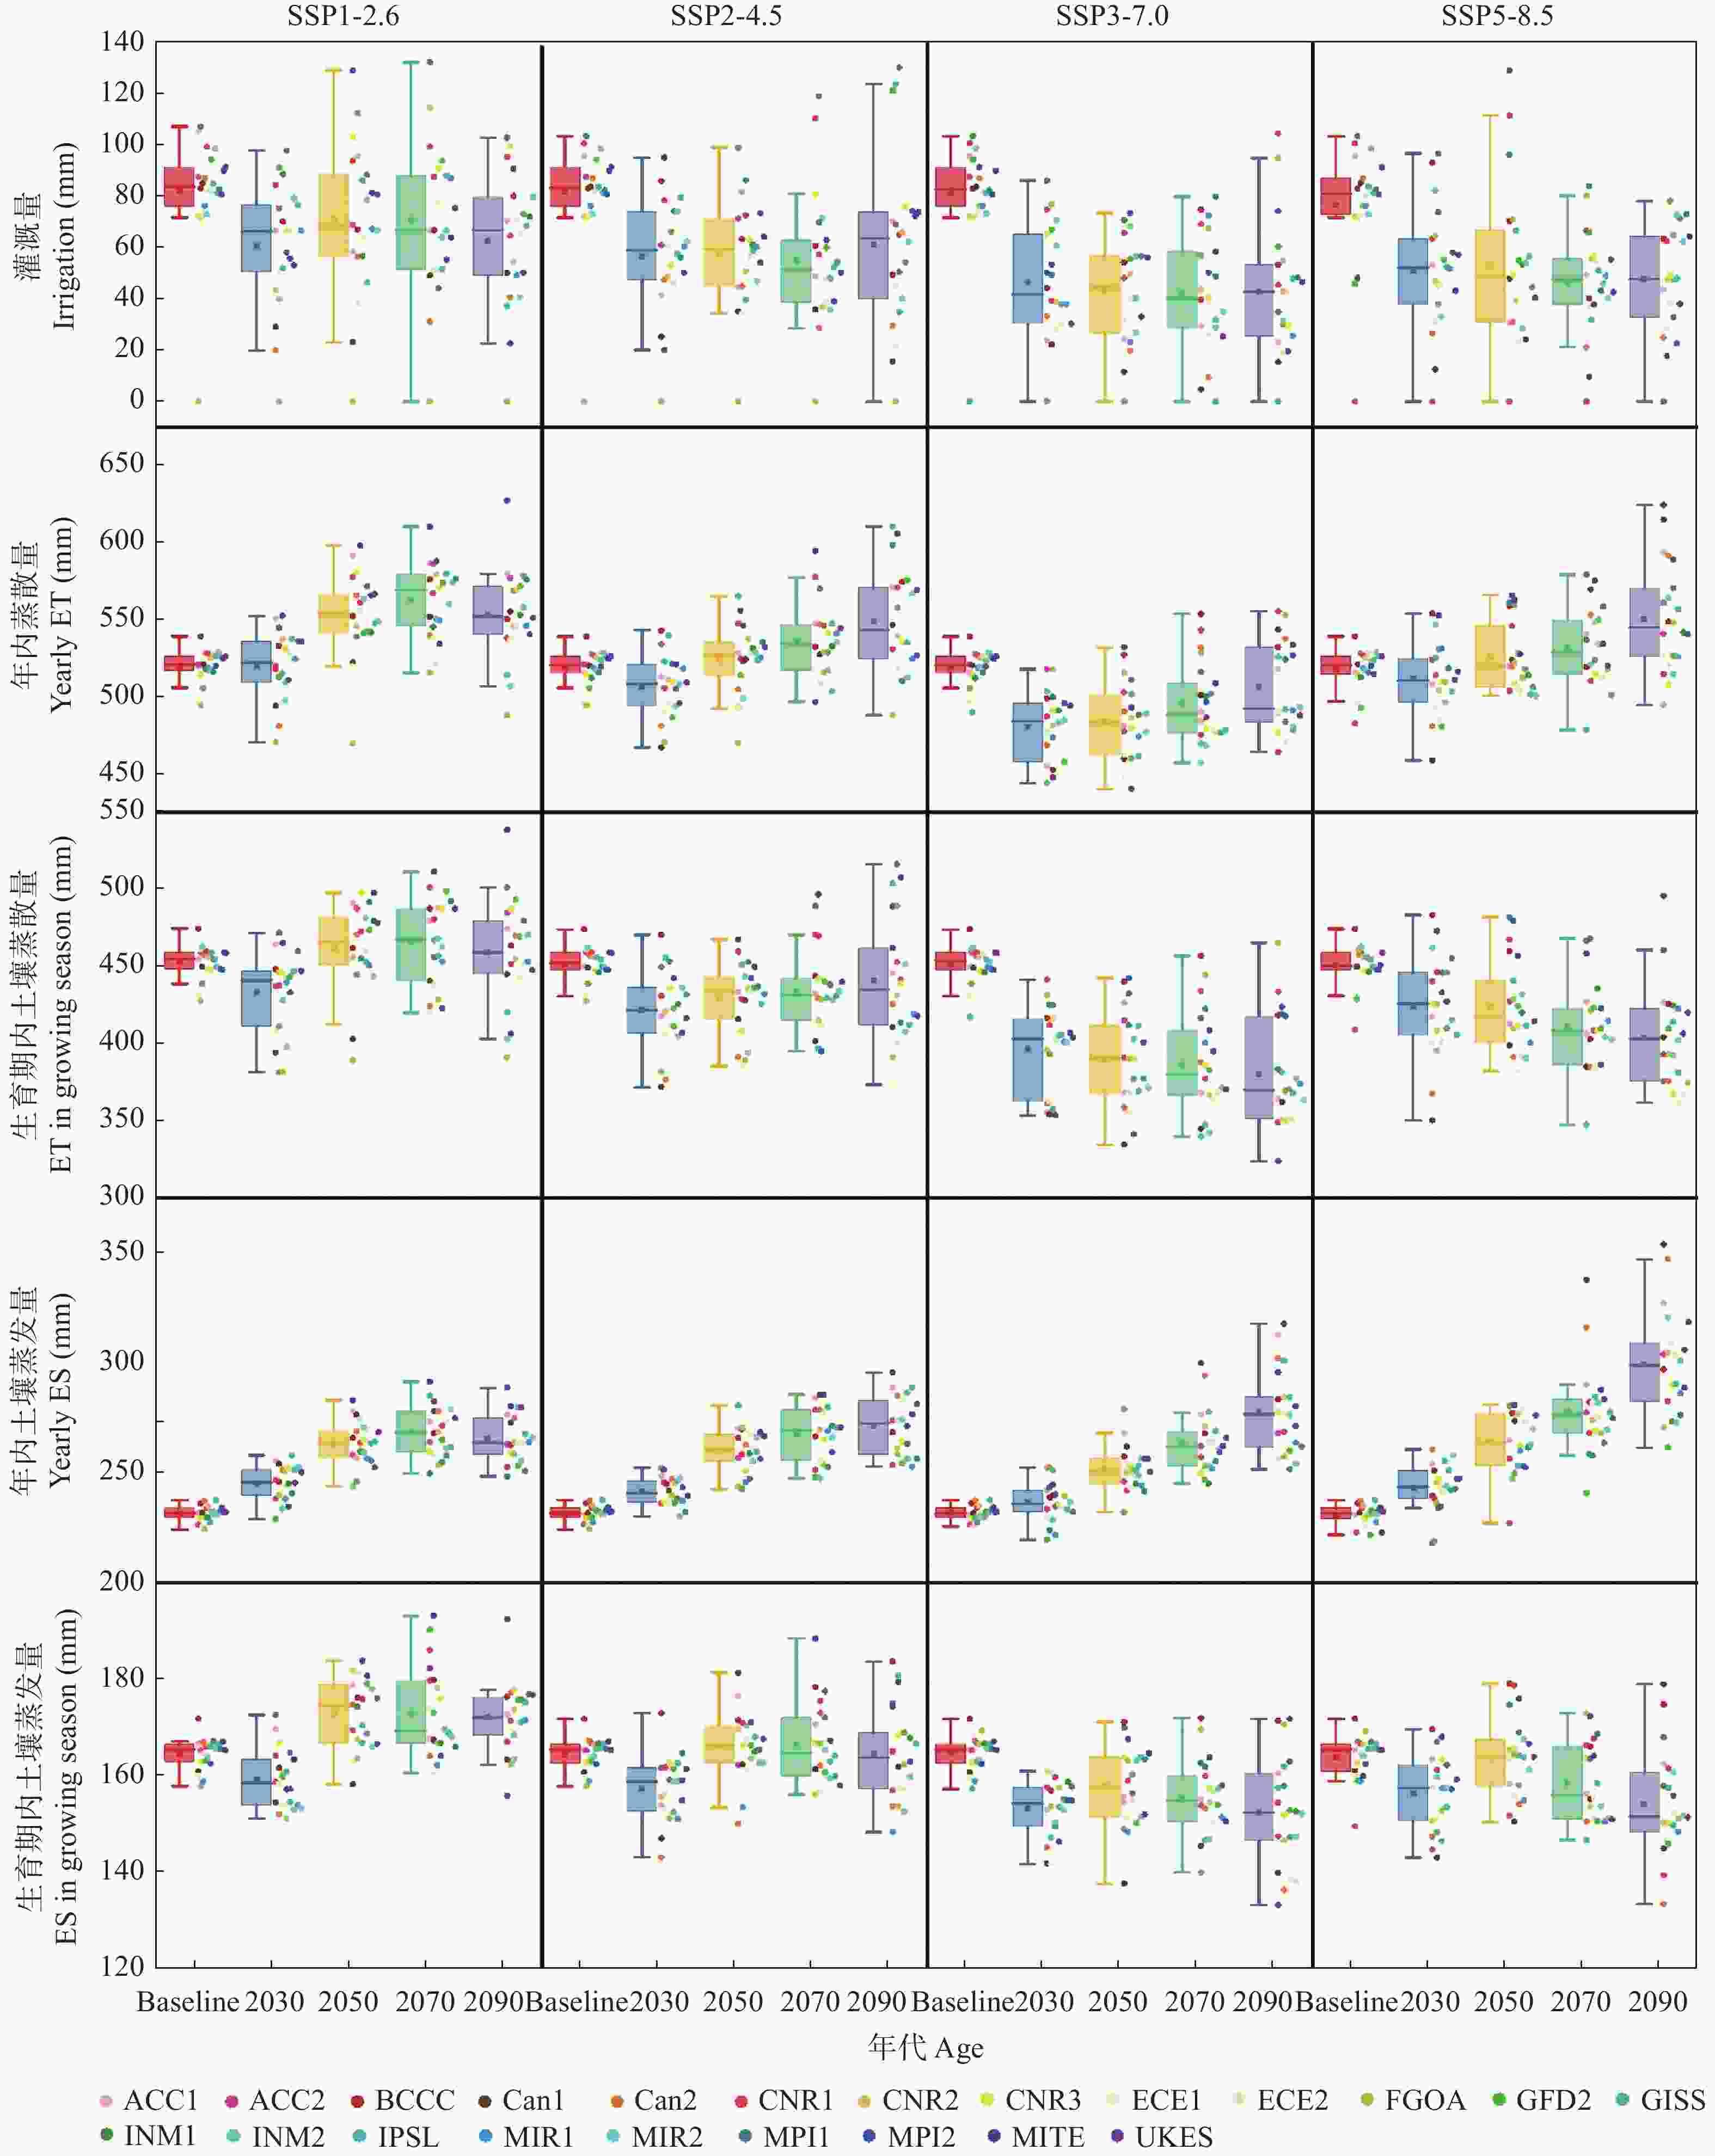
图 5 SSP1-2.6、SSP2-4.5、SSP3-7.0和SSP5-8.5气候情景下22种GCMs模拟的棉花耗水指标的变化预测
在箱型图里, 箱体为25%~75%的范围, 箱体内横线为中位线, 方形表示平均值, 上下两须线是1.5倍IQR(四分位间距)内的范围, 图中为左箱体、右数据的分布类型。在Y轴题目中, ET是蒸散发的缩写, ES是土壤蒸发的缩写。In the box plots, the box is 25%~75% of the range, the horizontal line is the median line, the square represents the average value, the upper and lower two muster lines are within the range of 1.5IQR (Interquartile Quartile Range), and the point beyond the muster line is the abnormal value. The figure shows the distribution type of the left box body and the right data. In the Y-axis title, ET is the abbreviation of evapotranspiration and ES is the abbreviation of soil evaporation
Figure 5. Prediction of cotton water consumption indexes change simulated by 22 GCMs under SSP1-2.6, SSP2-4.5, SSP3-7.0 and SSP5-8.5 climate scenarios
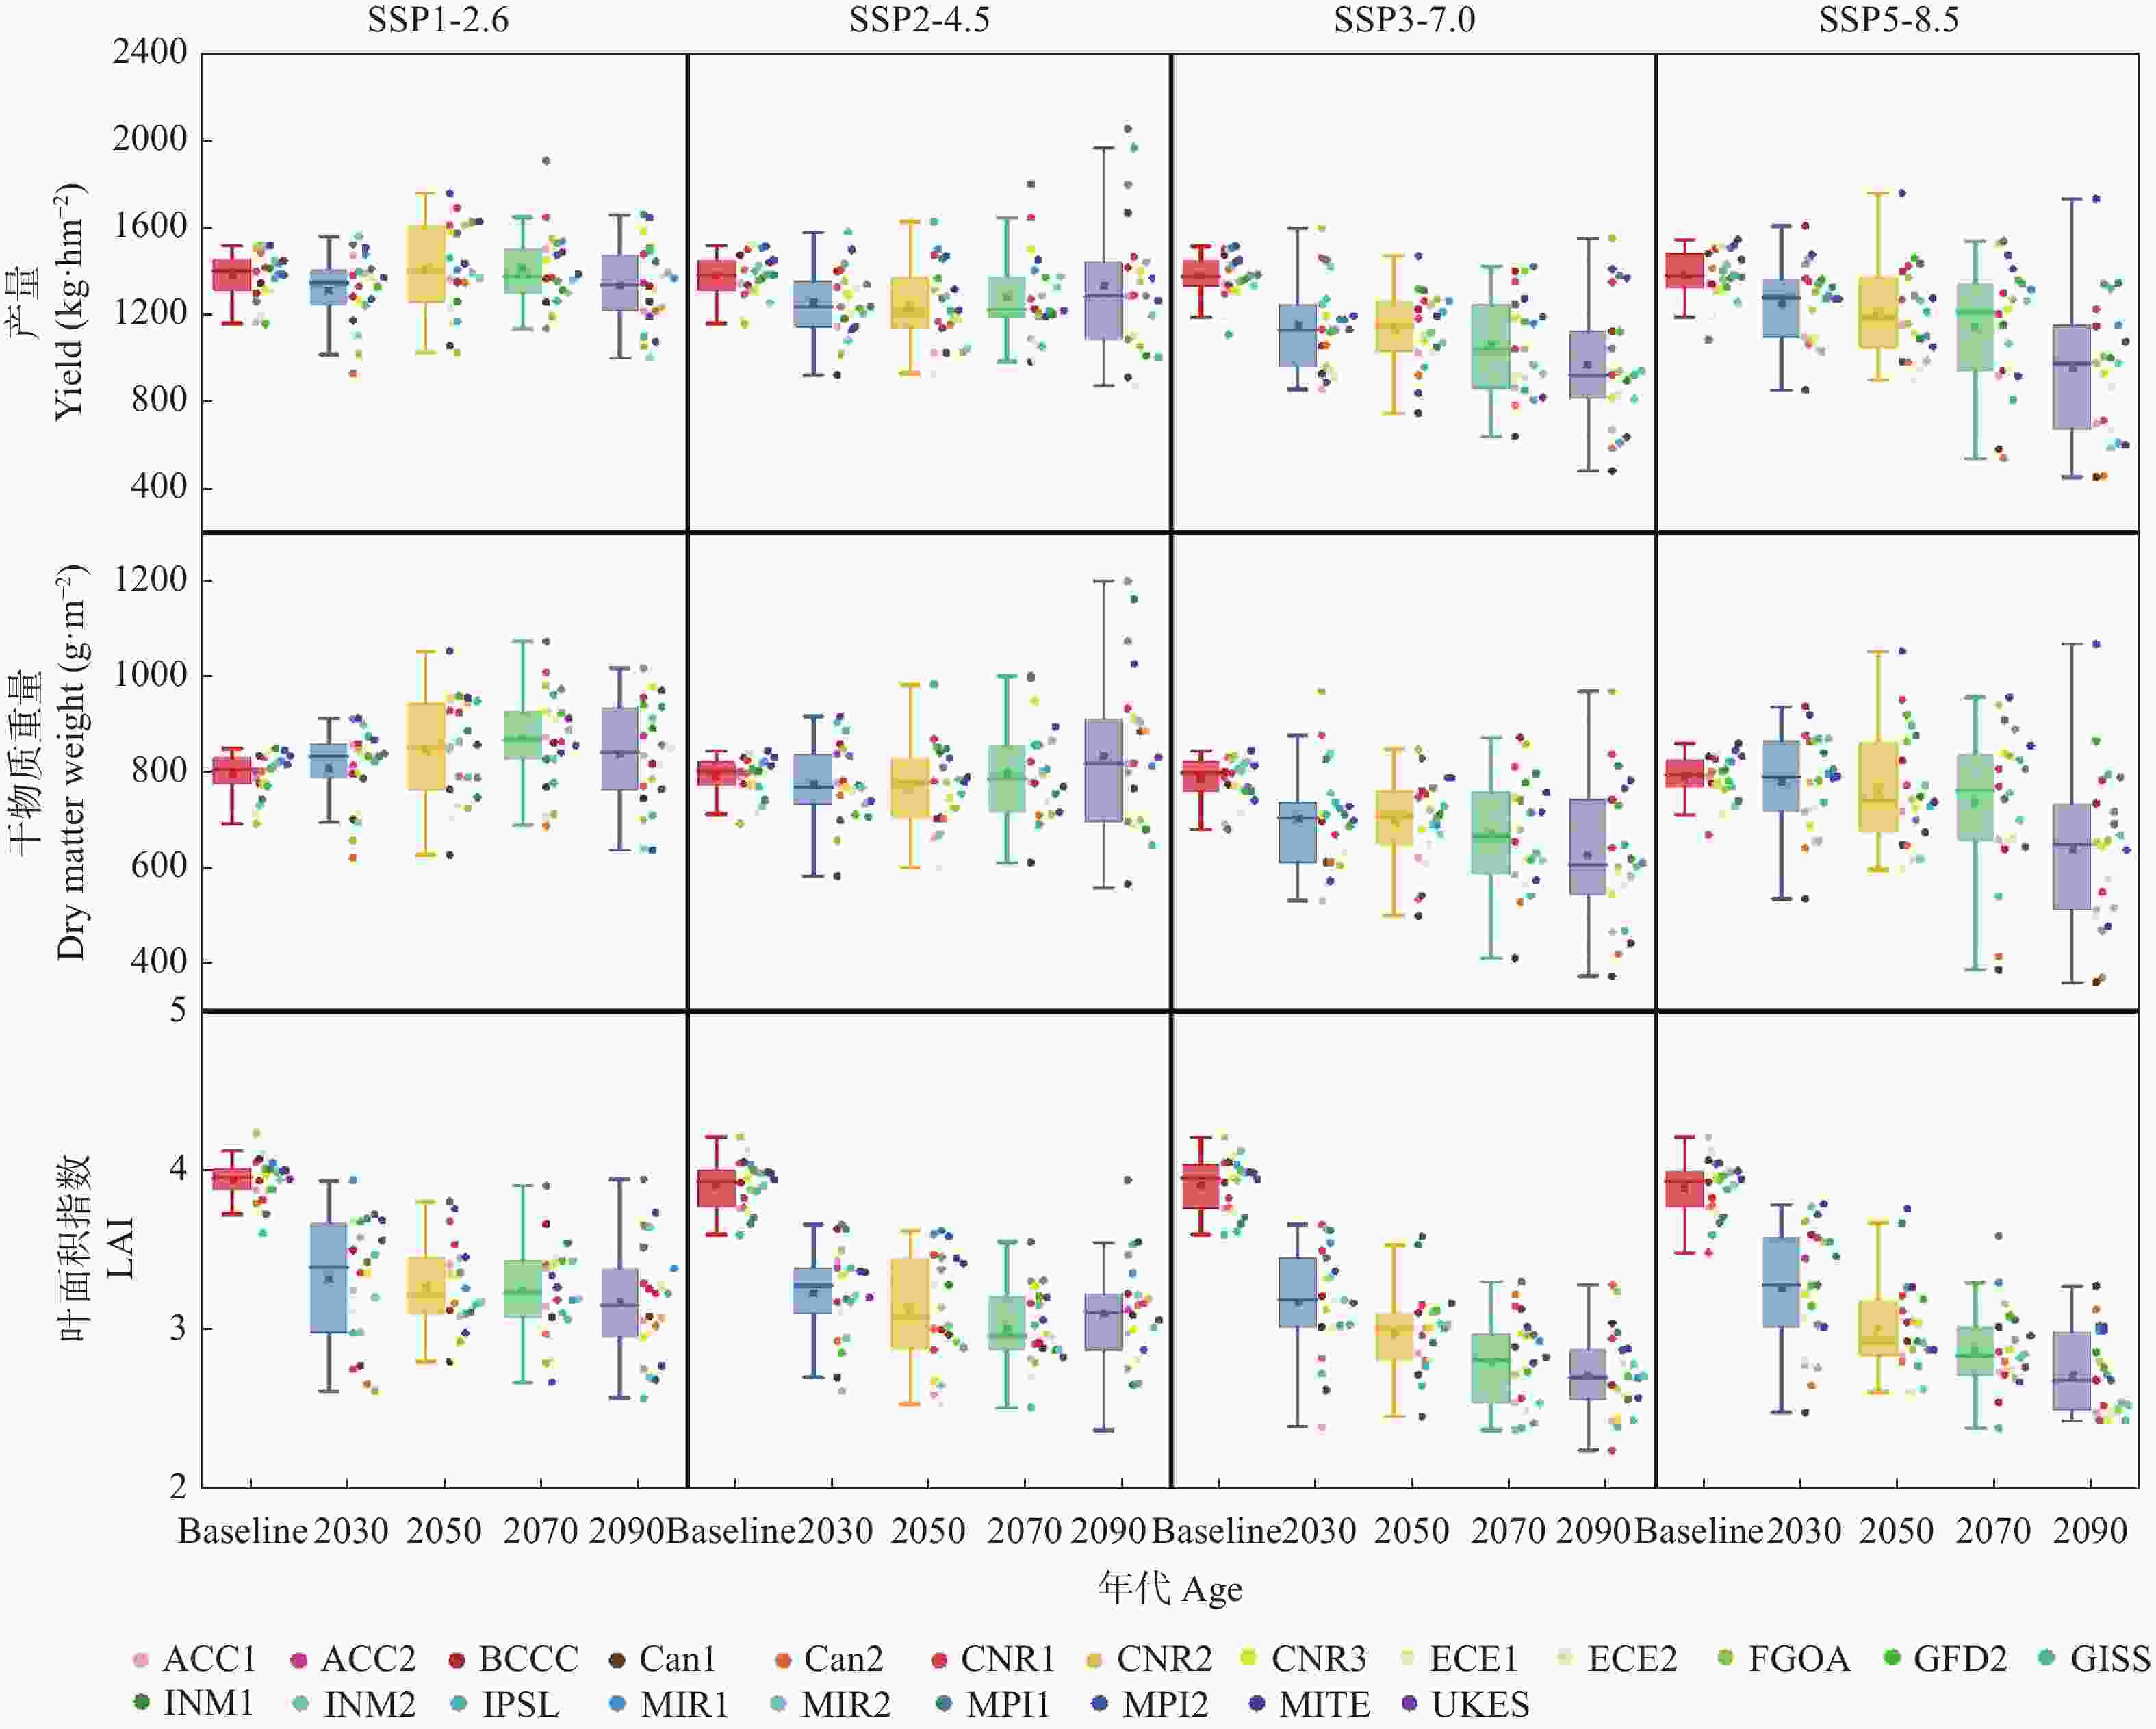
图 6 SSP1-2.6、SSP2-4.5、SSP3-7.0和SSP5-8.5气候情景下22种GCMs模拟的棉花产量、地上干物质重量和LAI的变化预测
在箱型图里, 箱体为25%~75%的范围, 箱体内横线为中位线, 方形表示平均值, 上下两须线是1.5倍IQR(四分位间距)内的范围, 图中为左箱体、右数据的分布类型。In the box plots, the box is 25%~75% of the range, the horizontal line is the median line, the square represents the average value, the upper and lower two muster lines are within the range of 1.5IQR (Interquartile Quartile Range), and the point beyond the muster line is the abnormal value. The figure shows the distribution type of the left box body and the right data.
Figure 6. Prediction of cotton yield, dry matter aboveground and LAI change simulated by 22 GCMs under SSP1-2.6, SSP2-4.5, SSP3-7.0 and SSP5-8.5 climate scenarios
表 1 本研究所涉及的22个全球气候模式(GCMs)信息
Table 1. Information of the 22 Global Climate Models (GCMs) applied in the study
编号 Number 代码 GCM code 名称 GCM name 机构 Institution ID 国家 Country 1 ACC1 ACCESS-CM2 BoM 澳大利亚 Australia 2 ACC2 ACCESS-ESM1-5 BoM 澳大利亚 Australia 3 BCC BCC-CSM2-MR BCC 中国 China 4 Can1 CanESM5 CCCMA 加拿大 Canada 5 Can2 CanESM5-CanOE CCCMA 加拿大 Canada 6 CNR1 CNRM-ESM2-1 CNRM 法国 France 7 CNR2 CNRM-CM6-1 CNRM 法国 France 8 CNR3 CNRM-CM6-1-HR CNRM 法国 France 9 ECE1 EC-Earth3-Veg EC-EARTH 欧盟 European Union 10 ECE2 EC-Earth3 EC-EARTH 欧盟 European Union 11 FGOA FGOALS-g3 FGOALS 中国 China 12 GFD GFDL-ESM4 NOAA GFDL 美国 United States 13 GISS GISS-E2-1-G NASA GISS 美国 United States 14 INM1 INM-CM4-8 INM 俄罗斯 Russia 15 INM2 INM-CM5-0 INM 俄罗斯 Russia 16 LPSL IPSL-CM6A-LR LPSL 法国 France 17 MIR1 MIROC6 MIROC 日本 Japan 18 MIR2 MIROC-ES2L MIROC 日本 Japan 19 MPI1 MPI-ESM1-2-HR MPI-M 德国 Germany 20 MPI2 MPI-ESM1-2-LR MPI-M 德国 Germany 21 MTIE MRI-ESM2-0 MIR 日本 Japan 22 UKES UKESM1-0-LL MOHC 英国 Britain  下载: 导出CSV
表 2 不同深度的土壤参数
Table 2. Soil parameters in different depths
深度
Soil depth
(cm)容重
Bulk density
(g∙cm−3)风干含水量
Air-dried moisture
(mm∙mm−1)凋萎系数
Wilting coefficient
(mm∙mm−1)田间最大持
Field capacity
(mm∙mm−1)饱和含水量
Saturated moisture
(mm∙mm−1)0~15 1.470 0.060 0.119 0.274 0.425 15~30 1.460 0.059 0.119 0.273 0.448 30~60 1.390 0.050 0.109 0.264 0.444 60~90 1.510 0.060 0.109 0.274 0.430 90~120 1.510 0.058 0.097 0.272 0.430 120~150 1.553 0.055 0.097 0.269 0.414 150~180 1.510 0.065 0.097 0.313 0.430
下载: 导出CSV
表 3 APSIM-COTTON中棉花‘中植棉2号’的作物品种遗传参数
Table 3. Genetic parameters of cotton cultivar ‘Zhongzhimian 2’ used in APSIM-COTTON model
参数名称
Parameter name单位
Unit描述
Description赋值
ValuePercent_l % 衣分 Percent lint 43 Scboll g∙Boll−1 单个棉铃籽棉重量 Seed cotton per boll 3.8 Respcon 呼吸常量 Respiration constant 0.01593 Sqcon 果节产生经验系数 Squaring constant 0.0181 Fcutout 引起果节产生停止的蕾铃承载量与可能载铃量的比值
Fruiting cutout0.5411 Flai 叶面积生长速率修正值 Cultivar adjustment for leaf ares per sites 0.52 DDISQ ℃·d 播种到现蕾的光热时间 Degree-day to 1st square 402 TIPOUT 单铃开花到吐絮积温经验常数
Degree-day from flowering to boll opening per boll constant52 FRUDD(1~8) ℃·d 蕾铃铃级对应的有效积温 Fruit development in degree-day 50, 169, 329, 356, 499, 642, 857, 1099 BLTME(1~8) 蕾铃铃级对应的发育程度 Boll time (fraction of period from) 0.00, 0.00, 0.00, 0.07, 0.21, 0.33, 0.55, 1.00 Dlds_max 每节位叶面积增加的平方根 Max LAI increase per site 0.12 Rate_emergence 出苗发育速率 Rate of emergence 1 Popcon 群体因子经验常数 Population constant 0.03633 Fburr 棉铃质量与籽棉质量的比值 Factor sc/boll to sc+burr/boll 1.23 ACOTYL mm2 初始子叶面积 Area of cotyledons 525 RLAI 现蕾之前叶面积相对生长率 LAI increase rate pre squaring 0.01
下载: 导出CSV
表 4 APSIM-COTTON模型模拟结果的评价指标
Table 4. Evaluation indexes of APSIM-COTTON model simulation results
总干物重
Dry matter-total
weight叶干物重
Dry matter-leaf
weight茎干物重
Dry matter-stem
weight铃干物重
Dry matter-boll
weight叶面积指数
Leaf area index株高
Plant height绿铃数
Bolls number吐絮数
Open bolls
numberR2 0.9937 0.8833 0.8635 0.9538 0.7234 0.8103 0.7059 0.9849 RMSE 193.1381 219.4410 502.2122 688.1290 0.6812 269.9656 23.8967 4.5918 NRMSE 2.2359 0.2186 0.3227 0.3799 0.4484 0.4349 0.5002 0.8266 R2 为决定系数; RMSE 为均方根误差; NRMSE 为相对均方根误差。R2 is the determination coefficient; RMSE is the root mean square error; NRMSE is the relative root mean square error.
下载: 导出CSV
-
[1] MASSON-DELMOTTE V, ZHAI P, PIRANI A, et al. IPCC, Climate Change 2021: The Physical Science Basis. Contribution of Working Group I to the Sixth Assessment Report of the Intergovernmental Panel on Climate Change[M]. Cambridge: Cambridge University Press, 2021 [2] 刘彦随, 刘玉, 郭丽英. 气候变化对中国农业生产的影响及应对策略[J]. 中国生态农业学报, 2010, 18(4): 905−910 doi: 10.3724/SP.J.1011.2010.00905LIU Y S, LIU Y, GUO L Y. Impact of climatic change on agricultural production and response strategies in China[J]. Chinese Journal of Eco-Agriculture, 2010, 18(4): 905−910 doi: 10.3724/SP.J.1011.2010.00905 [3] JONES J W, HOOGENBOOM G, PORTER C H, et al. The DSSAT cropping system model[J]. European Journal of Agronomy, 2003, 18(3/4): 235−265 [4] KEATING B A, CARBERRY P S, HAMMER G L, et al. An overview of APSIM, a model designed for farming systems simulation[J]. European Journal of Agronomy, 2003, 18(3/4): 267−288 [5] KO J, AHUJA L R, SASEENDRAN S A, et al. Climate change impacts on dryland cropping systems in the Central Great Plains, USA[J]. Climatic Change, 2012, 111(2): 445−472 doi: 10.1007/s10584-011-0175-9 [6] SOUSSANA J F, GRAUX A I, TUBIELLO F N. Improving the use of modelling for projections of climate change impacts on crops and pastures[J]. Journal of Experimental Botany, 2010, 61(8): 2217−2228 doi: 10.1093/jxb/erq100 [7] YANG Y M, YANG Y H, HAN S M, et al. Prediction of cotton yield and water demand under climate change and future adaptation measures[J]. Agricultural Water Management, 2014, 144: 42−53 doi: 10.1016/j.agwat.2014.06.001 [8] CHEN X P, QI Z M, GUI D W, et al. Simulating impacts of climate change on cotton yield and water requirement using RZWQM2[J]. Agricultural Water Management, 2019, 222: 231−241 doi: 10.1016/j.agwat.2019.05.030 [9] VOLOUDAKIS D, KARAMANOS A, ECONOMOU G, et al. Prediction of climate change impacts on cotton yields in Greece under eight climatic models using the AquaCrop crop simulation model and discriminant function analysis[J]. Agricultural Water Management, 2015, 147: 116−128 doi: 10.1016/j.agwat.2014.07.028 [10] ADHIKARI P, ALE S, BORDOVSKY J P, et al. Simulating future climate change impacts on seed cotton yield in the Texas High Plains using the CSM-CROPGRO-Cotton model[J]. Agricultural Water Management, 2016, 164: 317−330 doi: 10.1016/j.agwat.2015.10.011 [11] WANG Z B, CHEN J, XING F F, et al. Response of cotton phenology to climate change on the North China Plain from 1981 to 2012[J]. Scientific Reports, 2017, 7: 6628 doi: 10.1038/s41598-017-07056-4 [12] BASSU S, BRISSON N, DURAND J L, et al. How do various maize crop models vary in their responses to climate change factors?[J]. Global Change Biology, 2014, 20(7): 2301−2320 doi: 10.1111/gcb.12520 [13] BROUGHTON K J, SMITH R A, DUURSMA R A, et al. Warming alters the positive impact of elevated CO2 concentration on cotton growth and physiology during soil water deficit[J]. Functional Plant Biology:FPB, 2017, 44(2): 267−278 doi: 10.1071/FP16189 [14] NASIM W, AMIN A, FAHAD S, et al. Future risk assessment by estimating historical heat wave trends with projected heat accumulation using SimCLIM climate model in Pakistan[J]. Atmospheric Research, 2018, 205: 118−133 doi: 10.1016/j.atmosres.2018.01.009 [15] 国家统计局. 中国统计年鉴[J]. 北京: 中国统计出版社, 2021National Bureau of Statistics. China Statistical Yearbook [J]. Beijing: China Statistics Press, 2021 [16] BROCK T D. Calculating solar radiation for ecological studies[J]. Ecological Modelling, 1981, 14(1/2): 1−19 [17] LIUD L, ZUO H P. Statistical downscaling of daily climate variables for climate change impact assessment over New South Wales, Australia[J]. Climatic Change, 2012, 115(3): 629−666 [18] MCCOWN R L, HAMMER G L, HARGREAVES J N G, et al. APSIM: a novel software system for model development, model testing and simulation in agricultural systems research[J]. Agricultural Systems, 1996, 50(3): 255−271 doi: 10.1016/0308-521X(94)00055-V [19] HEARN A B, DA ROZA G D. A simple model for crop management applications for cotton (Gossypium hirsutum L.)[J]. Field Crops Research, 1985, 12: 49−69 doi: 10.1016/0378-4290(85)90053-X [20] RITCHIE J T. Model for predicting evaporation from a row crop with incomplete cover[J]. Water Resources Research, 1972, 8(5): 1204−1213 doi: 10.1029/WR008i005p01204 [21] 陈超, 潘学标, 张立祯, 等. 气候变化对石羊河流域棉花生产和耗水的影响[J]. 农业工程学报, 2011, 27(1): 57−65 doi: 10.3969/j.issn.1002-6819.2011.01.009CHEN C, PAN X B, ZHANG L Z, et al. Impact of climate change on cotton production and water consumption in Shiyang River Basin[J]. Transactions of the Chinese Society of Agricultural Engineering, 2011, 27(1): 57−65 doi: 10.3969/j.issn.1002-6819.2011.01.009 [22] 王凯旋. 气候和种植结构变化对黄淮海地区灌溉需水的影响评价[D]. 杨凌: 西北农林科技大学, 2022WANG K X. Impact assessment of climate and cropping structure changes on irrigation water requirement in Huang-Huai-Hai region[D]. Yangling: Northwest A & F University, 2022 [23] LUO Q Y, BANGE M, JOHNSTON D, et al. Cotton crop water use and water use efficiency in a changing climate[J]. Agriculture, Ecosystems & Environment, 2015, 202: 126−134 [24] LI N, YAO N, LI Y, et al. A meta-analysis of the possible impact of climate change on global cotton yield based on crop simulation approaches[J]. Agricultural Systems, 2021, 193: 103221 doi: 10.1016/j.agsy.2021.103221 [25] YANG Y M, Liu D L, Anwar M R, et al. Water use efficiency and crop water balance of rainfed wheat in a semi-arid environment: sensitivity of future changes to projected climate changes and soil type[J]. Theoretical and applied climatology, 2016, 123: 565−579 doi: 10.1007/s00704-015-1376-3 [26] PASSIOURA J. Increasing crop productivity when water is scarce—from breeding to field management. Agricultural Water Management, 2006, 80: 176–196 [27] LAWES RA, Oliver Y M, Robertson M J. Integrating the effects of climate and plant available soil water holding capacity on wheat yield. Field Crops Research, 2009, 113: 297–305 [28] 李娜. 气候变化对棉花生长和产量的影响[D]. 杨凌: 西北农林科技大学, 2021LI N. Effects of climate change on cotton growth and yield[D]. Yangling: Northwest A & F University, 2021 [29] RAHMAN M H U, AHMAD A, WANG X C, et al. Multi-model projections of future climate and climate change impacts uncertainty assessment for cotton production in Pakistan[J]. Agricultural and Forest Meteorology, 2018, 253/254: 94−113 doi: 10.1016/j.agrformet.2018.02.008 [30] ANWAR M R, WANG B, LIU D L, et al. Late planting has great potential to mitigate the effects of future climate change on Australian rain-fed cotton[J]. Science of the Total Environment, 2020, 714: 136806 doi: 10.1016/j.scitotenv.2020.136806 -

 下载:
下载:


 点击查看大图

计量
- 文章访问数: 31
- HTML全文浏览量: 10
- PDF下载量: 4
- 被引次数: 0
